Central Pivot Tool MT5
- Indicators
- Conor Stephenson
- Version: 1.1
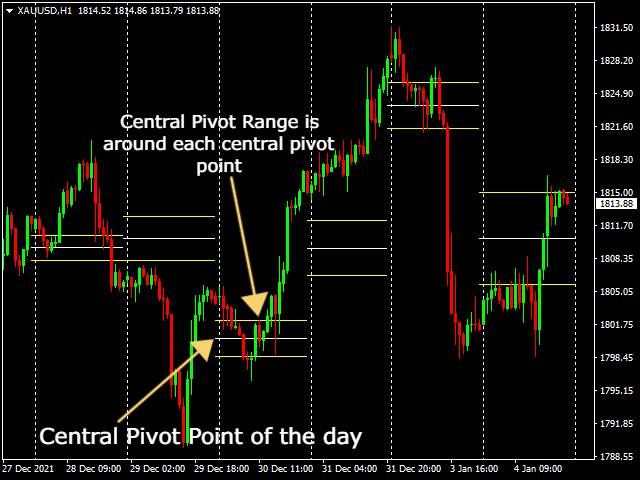
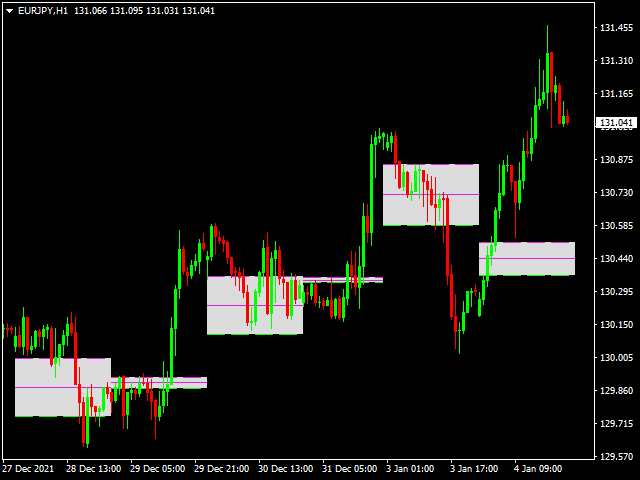
Central Pivot Range levels are formed around a central pivot point.
These levels in relation to the central pivot can be used to determine numerus market behaviours and possible outcomes.
The distance away from the central pivot, and the price that new levels form in relation to previous day levels, can be used to determine following days trending direction and strength.
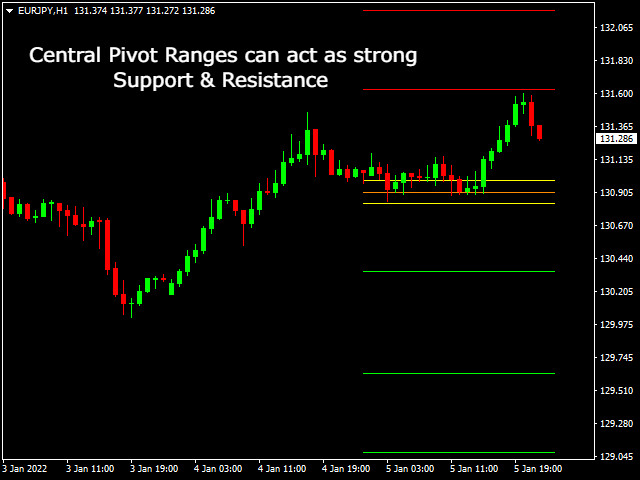
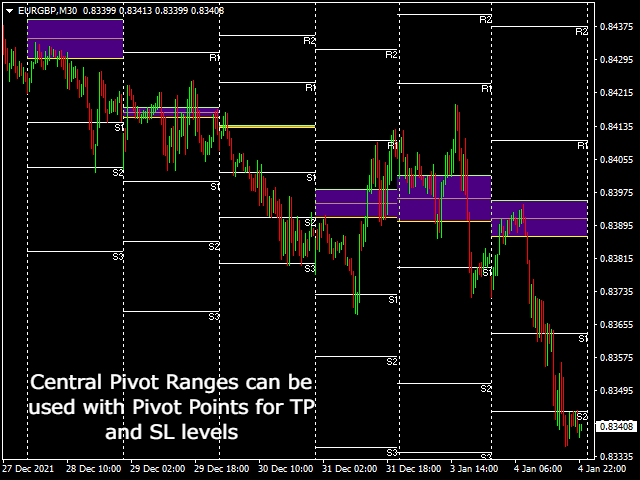
Central Pivot Ranges can act as support and resistance, offer a guide where to put a stop loss and also give signals of price continuing movement / breaking out.
-
Group chat : https://www.mql5.com/en/users/conorstephenson
-
Please contact me after your purchase for set up advice and a free Expert Advisor!
Key Features
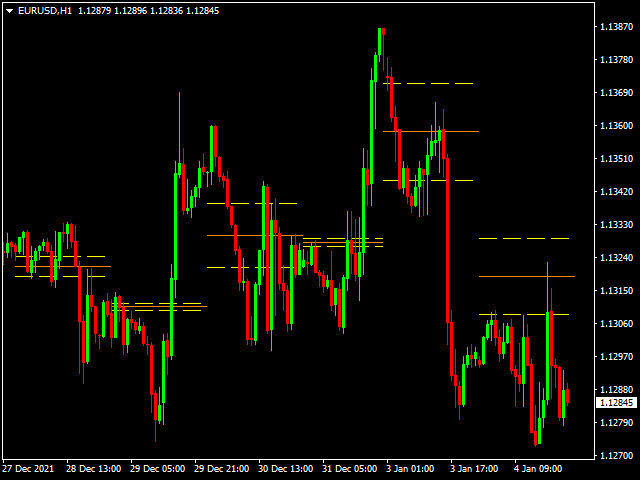
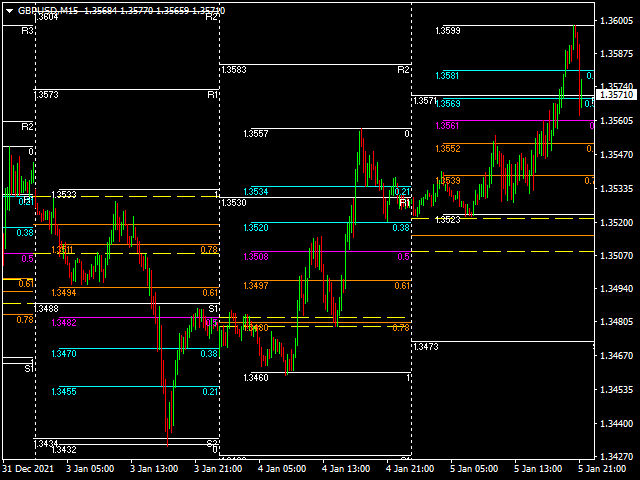
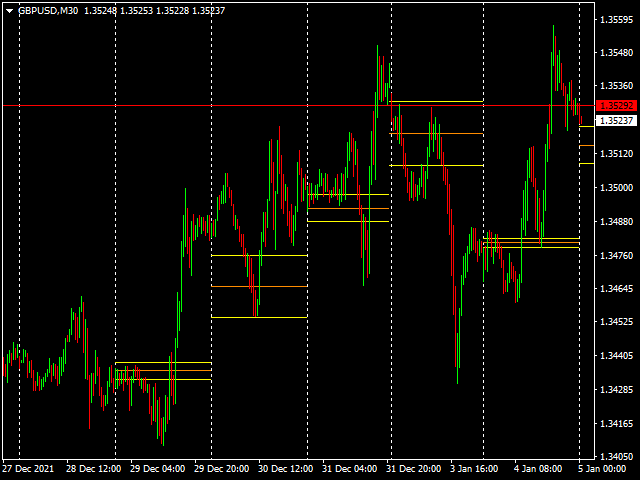
- Central Pivot Range focused indicator with additional Pivot Point & Fibonacci Levels.
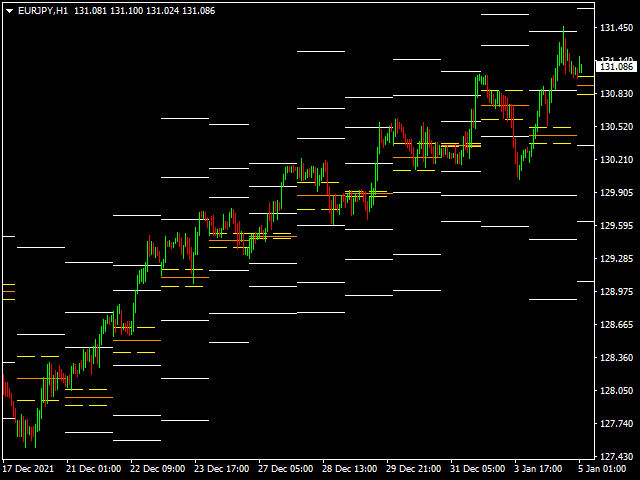
- Draws Pivot Points - R1, R2, R3, S1, S2, S3.
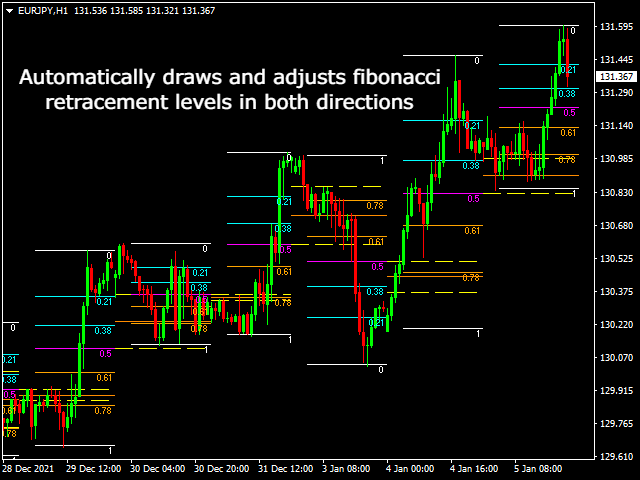
- Draws Fibonacci Levels - 0, 0.23, 0.38, 0.50, 0.61, 0.78, 1.
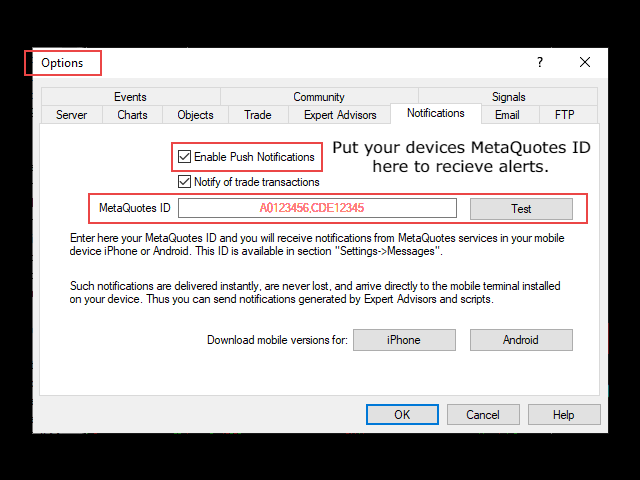
- Alert function. - Able to notify when levels are reached using the MT4 mobile app.
- Customisable line types, colors and sizes.
- Strong indications of possible market sentiment.
- Versatile indicator.
- Non repainting lines - Lines are formed at the end of each day using previous days fixed values.
- Set how many days back to draw levels from.
- All levels based on daily timeframes.
Recommendations
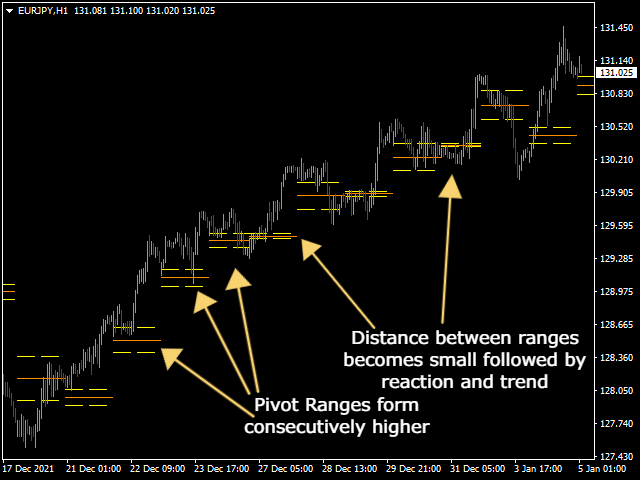
- When Central Pivot Ranges form consecutively higher than the previous ones, the overall market sentiment is considered bullish.
- When Central Pivot Ranges form consecutively lower than the previous ones, the overall market sentiment is considered bearish.
- When the distance between new CPR lines appears small, a market is considered to have previously been ranging in a relatively small area, this is a strong indication that day will have a strong trend.
- If the distance between new CPR lines is wide, a market is considered to have previously created a big range, so is an indication the day will have a smaller range with a non trending day.
- CPR regions can also work as a guide for entries into trades.
- Setting alerts on R1 & S1 can also work as a good trade set up.
- Support & Resistance pivot points can be used as a guide where to put take profits and stop losses.
My products are for sale only on MQL5, if you see this product anywhere else, it is an imitation. Don't be fooled.
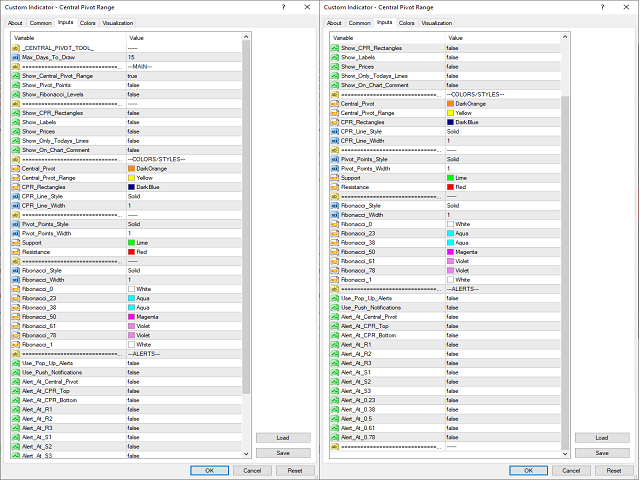
Input Definitions
- Max Days To Draw - How many days back to draw levels.
- Show Central Pivot Range - True will show the Range around the Central Pivot.
- Show Pivot Points - True will show levels R1, R2, R3, S1, S2, S3.
- Show Fibonacci Levels - True will show levels 0, 0.23, 0.38, 0.50, 0.61, 0.78, 1, in price.
- Show CPR Rectangles - True will draw colored rectangles over the CPR regions.
- Show Labels - True will show name labels for levels.
- Show Prices - True will show price labels for levels.
- Show Only Todays Lines.
- Show On Chart Comment- True will display level information on chart.
Colors
- Central Pivot.
- Central Pivot Range.
- CPR Rectangles.
- CPR Line Style.
- CPR Line Width.
- Pivot Points Style.
- Pivot Points Width.
- Support.
- Resistance.
- Fibonacci Style.
- Fibonacci Width.
- Fibonacci 0.
- Fibonacci 23.
- Fibonacci 38.
- Fibonacci 50.
- Fibonacci 61.
- Fibonacci 78.
- Fibonacci 1.
Alerts
- Use Pop Up Alerts - True will display an on-screen message when set alert levels are reached.
- Use Push Notification Alerts - True will send a notification to the MT4 mobile app when alert levels are reached.
- Alert At Central Pivot.
- Alert At CPR Top.
- Alert At CPR Bottom.
- Alert At R1.
- Alert At R2.
- Alert At R3.
- Alert At S1.
- Alert At S2.
- Alert At S3.
- Alert At 0.23.
- Alert At 0.38.
- Alert At 0.5.
- Alert At 0.61.
- Alert At 0.78.


Super indicator, price respects to the levels most of the times.