ROC Price Histogram Mt5
- Indicators
- Kenneth Parling
- Version: 1.0
- Activations: 7
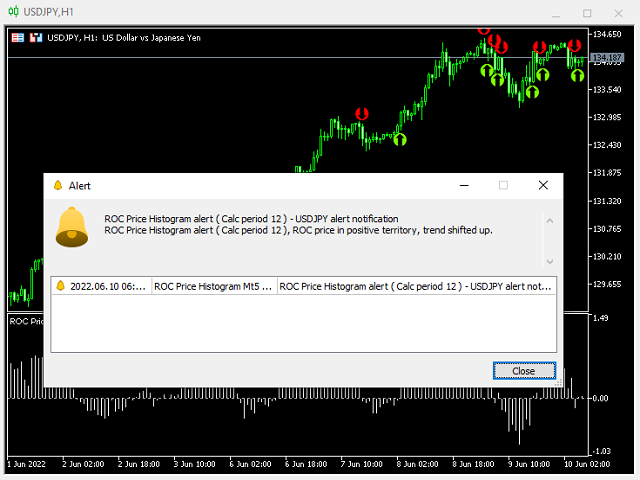
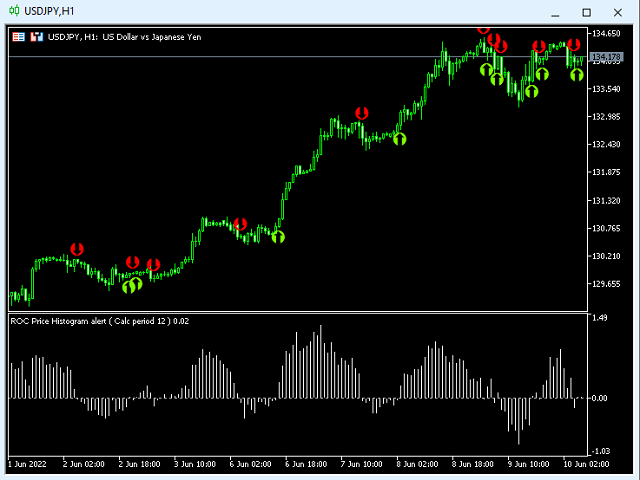
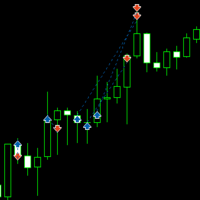
ROC Price Histogram Alert is a momentum-based technical indicator that measures the percentage change in price between the current price and the price a certain number of periods ago. ROC is plotted with a histogram against zero, with the indicator moving upwards into positive territory if price changes are to the upside, and moving into negative territory if price changes are to the downside.
The main step in calculating the ROC period, is the 'calculated period' input setting. Short-term traders may choose a small value, such as nine or twelve. Longer-term investors may choose a higher value such as 200. The 'calculated period' is how many periods ago the current price is being compared to. Smaller values will see the ROC react more quickly to price changes, but that can also mean more false signals. A larger value means the ROC will react slower, but the signals could be more meaningful when they occur.
There are both positive and negative sides to this type of technical indicator
Positive
- ROC price oscillator is and unbounded momentum indicator used in technical analysis set against a zero-level midpoint
- A rising ROC above zero typically confirms an uptrend while a falling ROC below zero indicates a downtrend
- Five alert types including visual buy-sell arrows
- Any symbol and time frame
- When the price is consolidating ROC will hover near zero. In this case, it is important to watch the overall price trend since the ROC will provide little insight except for confirming the consolidation.
Indicator menu categories
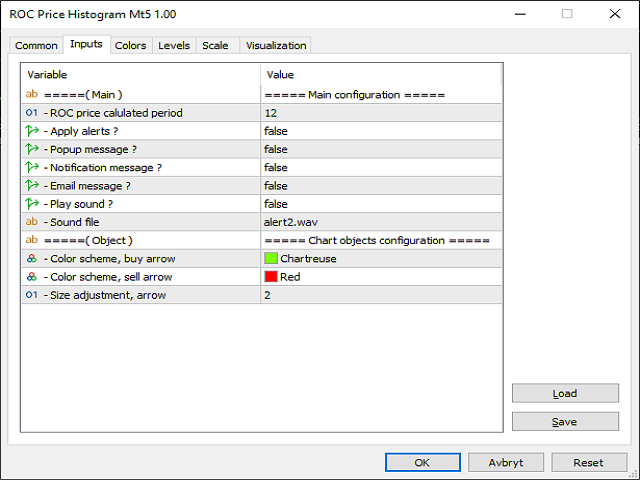
- Main configuration - ROC calculated period / Alerts setup - Apply alerts, popup, notifications, email and sound
- Objects configuration - Size adjustment for visual arrows
