UPD1 Profile Levels MT5
- Indicators
- Vitaliy Kuznetsov
- Version: 3.30
- Updated: 5 January 2024
- Activations: 20
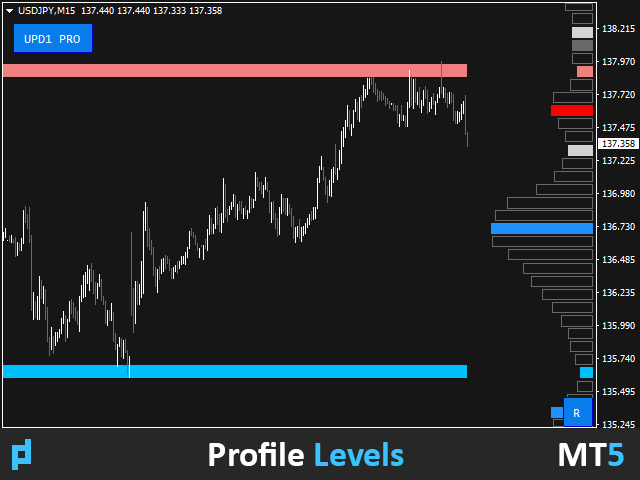
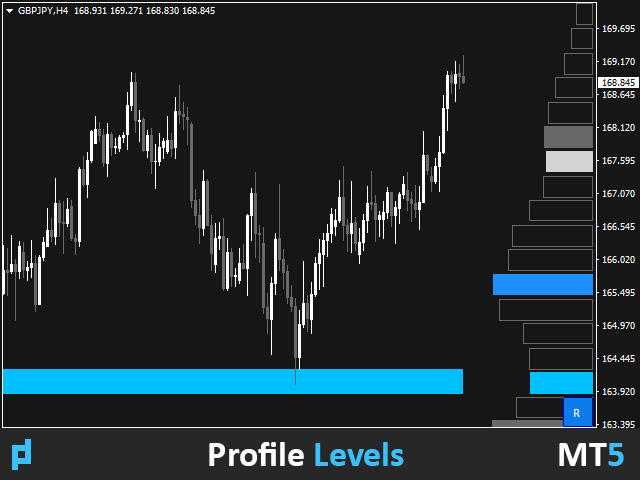
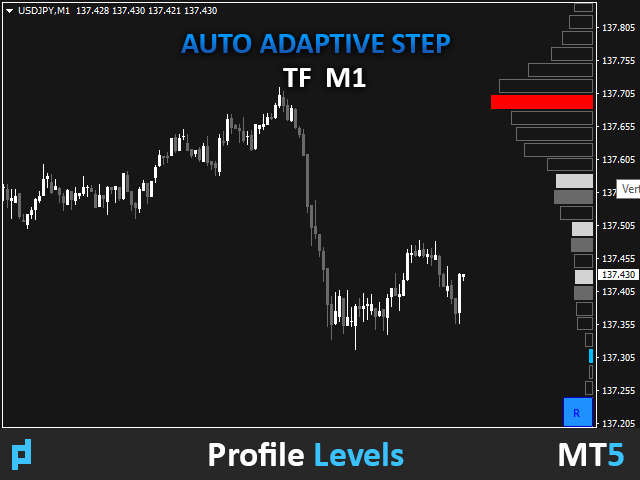
The indicator finds the levels of the maximum and minimum price volume (market profile) on the working histogram for the specified number of bars. Composite profile.
The height of the histogram is fully automatic and adapts to any instrument and timeframe. The author's algorithm is used and does not repeat well-known analogues.
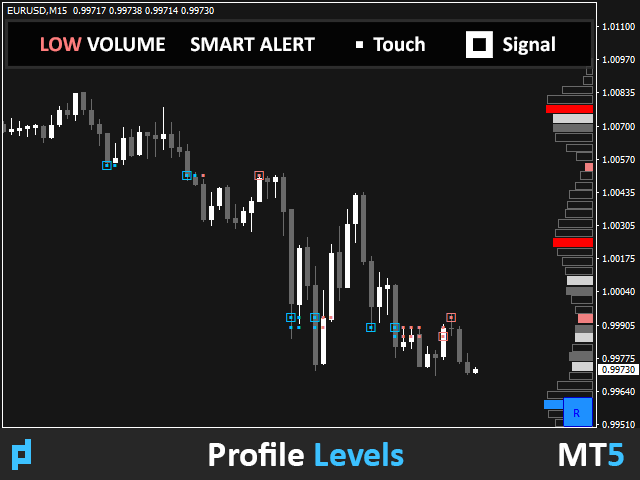
The height of the two histograms is approximately equal to the average height of the candle. Smart alert will help you to inform about the price concerning the volume level.
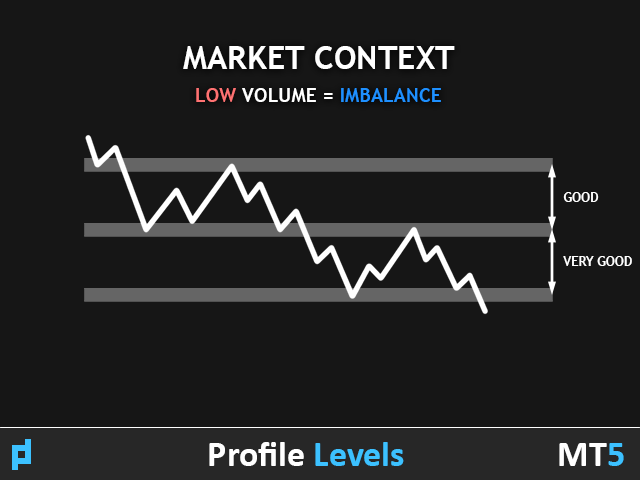
Concept Smart Money
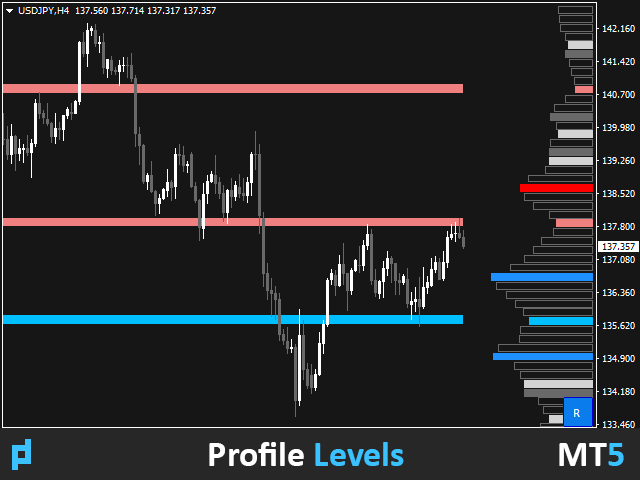
Low Volume - Imbalance. Is used to find a good market context, determine the structure of the market and as a filter for binary options. It is a magnet for the price.
High Volume - Liquidity. Is used for the test when exiting accumulation.
Input parameters.
Basic.
Bars Count - number of bars to count and display.
Signal Fractal = 5 (for color signal level). The level will become a signal under the following conditions: there are five histograms at the top and bottom that do not exceed it.
Min Candles For High Volume Level - the minimum number of candles at the level so that it can become a signal.
Button Settings.
Visual Button - button display (enable/disable).
Corner - snap angle of the button.
X indent - horizontal offset in pixels.
Y indent - vertical offset in pixels.
Histogram Settings.
Show On Shart - what to display on the chart:
Histo + Rectangle on Button.
Histo + Rectangle.
Rectangle.
Rectangle Type - which rectangles to display:
Low Volume.
High Volume.
All Volume.
Histo Weight in % - height of the histogram. Affects the distance between them. Visual only.
Shift X in px - indent from the right edge in pixels.
Size in px - maximum width of the histogram in pixels.
Color Settings.
Histo + Signal Levels + Support And Resistance Color.
Notification Settings.
Alert - select the alert type:
Low Volume.
High Volume.
All Volume.
Repeat Signal - Enable / No Signal (Smart Alert).
Show Touch Points - Shows all touches of price and signal levels (No Alert).
Alert Work Time - 00:00-23:59 - specify the time when the alert can beep.
Alert Pop Up - On/Off.
Alert Push - On/Off.
Alert Email - On/Off.
Alert Sound - On/Off.
Alert Sound Name.


Very useful for me at least. Looks great too, no complaints. Does what it says it does.