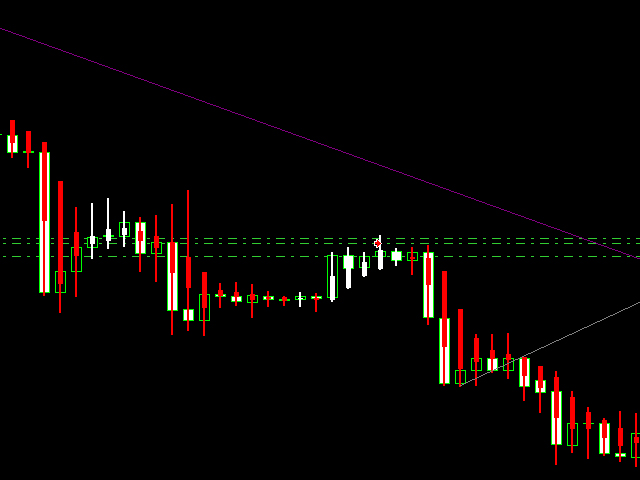
The coated chart
- Indicators
- Jin Wang
- Version: 1.0
- Activations: 5
Heiken Ashi candle chart is an improved version of The Japanese candle chart, which can effectively filter the market "noise" of the Japanese candle chart. It is favored by many traders for its simplicity and intuition. For trend traders, the HA candle chart is a magic tool.
Unlike the traditional Japanese candle chart, Heikenashi does not reflect the opening price, high price, low price and closing price of the market. Instead, Heikenashi calculates the value of a single K line in the dominant trend, and then indicates the change of trend through the change of color. This version is an improved version that addresses previous issues. The main purpose of this indicator is to filter out market noise.
If the seller dominates, the Heikenashi chart will show red, even if the price closes higher than its opening price.


