All Harmonics 26
- Indicators
- Alexey Isavnin
- Version: 1.6
- Updated: 22 June 2020
- Activations: 20
Harmonic patterns are characteristic series of price movements with respect to Fibonacci levels, which statistically precede price reversals. This indicator searches for harmonic patterns. It is capable of recognising 26 classical and non-classical harmonic patterns:
- Classical
- Gartley
- Butterfly
- Alternate Butterfly
- Bat
- Alternate Bat
- Crab
- Deep Crab
- Three Drives
- Non-classical
- Shark
- Alternate Shark
- Cypher
- 5-0
- Anti Gartley
- Anti Butterfly
- Anti Alternate Butterfly
- Anti Bat
- Anti Alternate Bat
- Anti Crab
- Anti Deep Crab
- Anti Shark
- Anti Alternate Shark
- Anti Cypher
- Nen Star
- Anti Nen Star
- Black Swan
- White Swan (Anti White Swan)
Features
This indicator searches for both potential and pending/past patterns.
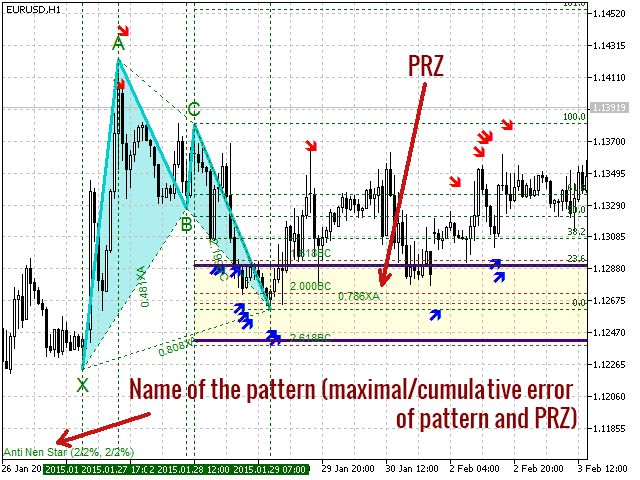
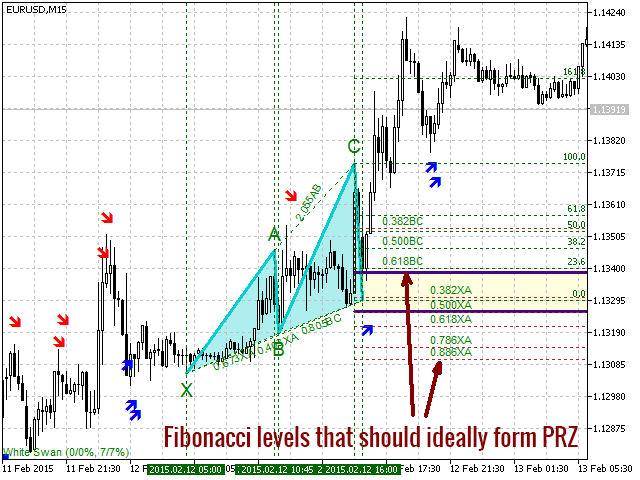
- Potential pattern is the one that has not completely formed yet - the price formed X, A, B and C points but the D point is not yet in the PRZ.
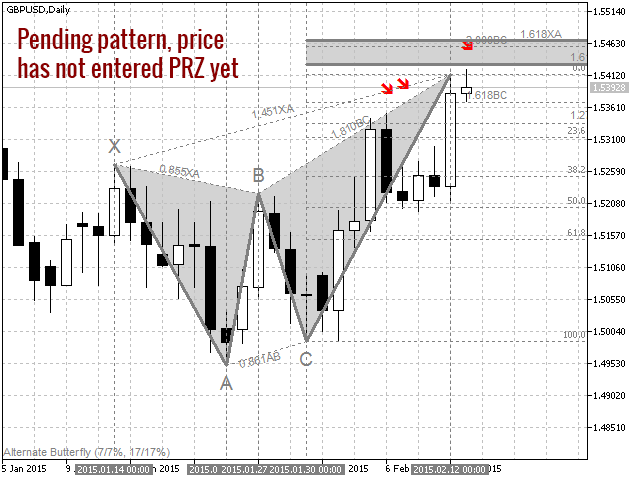
- Pending pattern is the one that has completely formed - the candle representing the D point is closed and already in the PRZ.
This indicator searches for all possible alternatives. This means that you can see all the potential and pending patterns found on a current candle. It is a usual situation when there are multiple pattern candidates at the same time - you can see them all!
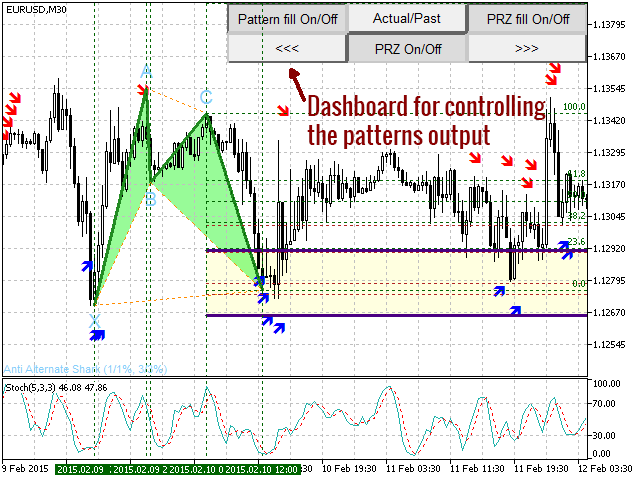
You can easily look through the current and past patterns using keyboardor dashboard. The following parameters control that feature:
- Use keyboard to control the indicator: If set to true, you can use the following keys (in English layout): W - for switching between current and past patterns, A and D - for moving between the patterns (previous and next), S - for switching on/off the PRZ, Q - for switching on/off the pattern fill, E - for switching on/off the PRZ fill.
- Use dashboard to control the indicator: If set to true, the dashboard with the same options as described above will be shown.
- Compression rate: Rate of time series compression in percents. The closer this value to 100%, the less extrema will be left for analysis (but those extrema will be more important). The time series compression is based on the Important Extrema indicator. You can read the corresponding documentation here.
- Update compression parameters periodically: If set to true, the indicator will update the parameters related to series compression periodically. Those parameters are dependant on history and so with new data coming in they might change.
- Update period (in bars) of compression parameters: How often the compression parameters should be updated if the previous is set to true.
- Length of data (in bars) for compression update: How big should be the piece of historical data used for updating compression parameters.
- Pattern length (in bars): The average length of harmonic patterns to be found.
- Pattern length delta: The deviation from average pattern length. For example, if we are searching for patterns with average length 100 and length delta 0.1, then the indicator will search for patterns with length from 90 to 110 bars.
- Do not allow price to go above/below XB.
- Do not allow price to go above/below AC.
- Do not allow price to go above/below BD.
- Do not allow price to go above/below XD (for some patterns).
- Pattern tolerance (in percents of XABC height): This option regulates the precision of patterns. For example, if this is set to 10%, then it is allowed for X, A, B and C points to have an absolute error of 0.1*height(XABC). The closer this value to 0%, the more precise patterns will be found.
- PRZ tolerance (in percents of XABC height): This option regulates the precision of price reversal zone (PRZ). For example, if this is set to 10%, then it is allowed for levels that define the D point to have an absolute error of 0.1*height(XABC). The cross-section of those levels comprises the PRZ. The closer this value to 0%, the narrower will be the PRZ, and accordingly the less patterns are found.
List of buffers:
0: Buy signal
1: Sell signal
2: X point price
3: A point price
4: B point price
5: C point price
6: D point price
7: PRZ lower price
8: PRZ higher price
9: X point index
10: A point index
11: B point index
12: C point index
13: D point index




Great tool for decision making.