• Overview
  • Reviews (11)
  • Comments (9)
  • What's new

Draw and Sync Objects MT4

4.67

Draw and Sync Objects Multiple Charts

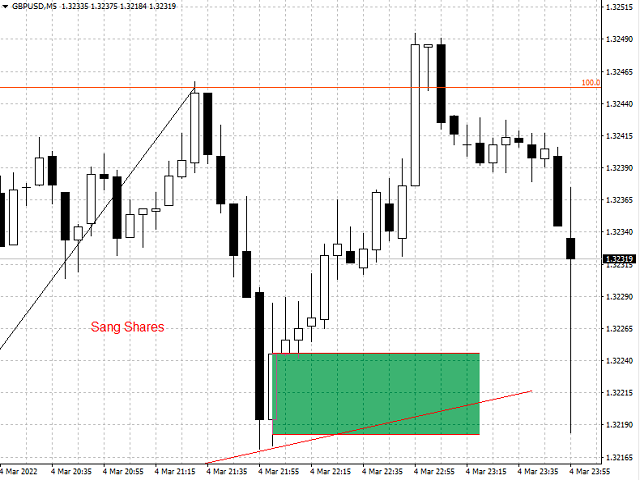
1. Draw objects by key press. (You must: 1. Press Function key => 2. Click where you want to draw => 3. Draw it => 4. Press ESC to complete).

(If you don't want to draw after pressing function key, you must press ESC to cancel).

2. Developing : Sync selected objects to multiple charts by button.

3. Developing: Hide objects that do not belong to the current symbol (Objects drawn with this indicator will belong to the symbol they are plotted on. When your chart changes to a different symbol, they will be in progress. hidden).

Function list of keys:

Ctrl + Shift: draw Rectangle.

D: draw Trend Line.

T: draw Text.

F: draw Fibonacci Retracement

S: Toggle Scale Fix.

Q: Zoom In.

W: Zoom Out.

Version 1.10:  When the rectangle has been deleted, the lines of rectangle will be deleted.

Version 1.20: When the rectangle drawn by indicator has been changed, the lines of it will be changed.

Version 1.30: Add function to key U for extend all Rectangles drawn by this indicator to last bar.

Version 1.40: Add 5 colors input for select the color rectangle after creating it.

Version 1.50:

- Hide objects belong other symbols have been drawn by this indicator.

- Sync selected objects when you click Sync Objects button:

+ Enable sync button in input.

+ Set indexes of chart you want to sync (First chart index is 1. Next chart index is 2, ...)

Version 1.60:

- Add 5 charts to sync objects (now 10 charts). 

- Fix: chart has same index with current chart will be ignored when you sync objects.

- Press U key: now extends rectangles to last bar + 1 (if hourly chart, it will be extended to next hour).

- Fix: sync fill color of rectangle.

Version 1.70: fix sync lines of rectangles

Version 1.80: add some colors and remove fill color buttons when you click rectangles.

Version 1.90: add some input to edit sync objects button properties.

Version 2.0:

- Add 5 charts to sync objects (total:  20 charts).

- ESC Key: deselect all objects.

- G Key: enable select rectangles by clicking their fill (you need press G whenever you want to select rectangle by clicking its fill, one click one rectangle and disable by click anywhere on chart).

- E Key: show colors buttons, remove BG fill button, delete rectangle button, mark new name button for rectangle.

+ Delete rectangle button: when you click it, rectangle will be deleted and the chart shows you a button to sync deleting rectangle. That button named "Sync Rectangle" (the rectangles of other sync charts will be deleted when you click this button).

+ Mark new name button: when you don't want to sync a rectangle, you can mark it as new. This indicator will understand it is a new rectangle. And it will not be synchronized with old rectangles in other charts. (You can click sync objects button with this new rectangle, other charts will create new rectangles).

Version 2.10: add key inputs to draw rectangle, trendline, text and fibonacci retracement.


Reviews 11
Mino Ebasta
18
Mino Ebasta 2023.09.10 01:04 
 

Great! Well done!!! Is it possible to add alerts when the price enters the rectangle? It would be perfect!!! and if you want to exaggerate, the possibility of changing between 2 template.

Romário Costa
45
Romário Costa 2023.06.28 16:02 
 

perfect bro! Can you add erase same object in all chart? thanks

tiennguyen123076
14
tiennguyen123076 2023.01.09 06:04 
 

Yup, just like magic, this is one of the best tools that I've ever seen, cảm ơn b

Recommended products
Percentage Levels MT4
Alexandre Borela
4.67 (3)
If you like this project, leave a 5 star review. Follow on instagram: borelatech As institutionals trade large volumes, it is not uncommon for them to try to defend their position at specific percentage levels. These levels will serve as a natural support and resistance which you can use either to enter a trade or be aware of possible dangers against your position. An example of a common used percentages are 0.25% and 0.50% on EURUSD for the week, you can see this example on the screenshots.
FREE
ATR Bands with Take-Profit Zones for MT4 The ATR Bands indicator for MT4 is designed to assist traders in managing risk and navigating market volatility. By using the Average True Range (ATR), it helps identify key price levels and set realistic stop-loss and take-profit zones. Key Features: ATR-Based Bands : The indicator calculates dynamic upper and lower bands using ATR. These bands adjust based on price volatility, helping to indicate potential support and resistance levels. Customizable Par
FREE
Custom Mapping Tool by Shredderline is an innovative MT4 indicator that simplifies the process of marking and mapping charts. With this tool, you no longer have to waste time rewriting repetitive words, rectangles, and trendline colors every time. New Feature V5.60: Draw path - Same as the TV Path drawing mode, which is very useful for naked chart trader. You can draw zigzag, draw your patterns manually. Change style in indicator setting.  Crop function disabled by default. Can be enabled and s
FREE
Work logic Stop Out utility is a simple but very convenient indicator showing how many points are left to the Stop Out level / Its benefit lies in the fact that many traders deliberately overestimate the risk in trading in pursuit of profit, use the available margin at the maximum, and for this case it is very important to know where the broker can forcibly close your positions. Just place the indicator on the chart and depending on the open position in Buy or Sell, you will see the borde
FREE
Market Ticker Free
John Louis Fernando Diamante
5 (1)
A scrolling Market Ticker that displays price changes from all symbols in the Market Watch list. Provides an easy snapshot of symbol prices, and keeps scrolling automatically while you trade and analyse the chart. Options include: - MTF, eg choose to show price changes of the daily chart, or the hourly - use the live candle or the recently completed - font and background coloring
FREE
Bar Replay MT4 DEM0
Hoang The Manh
5 (1)
NOTE: THIS IS DEMO VERSION  Yoy can only replay in 1 week ago and replay for 20 bars. BUY FULL VERSION :  https://www.mql5.com/en/market/product/73798 __________________________________________________ This EA  - Tool allow you replay bar in Meta Trader 4 for back test. This Tool can back test in multi timeframe in only one chart. This Tool is very useful for Price action trader. It can work with Indicators,  some indicators cannot works. Main feature:  Candlestick forward and backward to Backte
FREE
Chart style
Aleksandr Krokhalev
5 (2)
The indicator works as an extension that recolors the candles and the background in the terminal at the click of a button (Night Theme / Day Theme). The user can also set the display of the watermark of the symbol, and specify its size. The interactive menu allows you to toggle the display of the Ask value. And switch chart scaling from adaptive to fixed with one click. You can add your favorite color to the settings for switching.
FREE
Deal multiplier Mt4
Mikhail Mitin
4.36 (11)
The utility opens copies of open trades. It is very convenient if you use the Signals service and want to increase the volume of transactions. Settings: Symbols: all symbols only current symbol Orders: Buy Sell Magic Any Magic Input Magic Lot size Original - lot size from original order; Fix Lot - fix lot size (input); Lot X Mult - lot size X koef; Stop Loss From sender - Stop Loss from original; Without - without Stop Loss; Plus Fix - Stop Loss from original order + fix points; Fix Point - fi
FREE
Save Template
Dominik Kaczorowski
A very fast way to save your chart template. Set the keyboard shortcut to further speed up the operation. The script allows you to save a template with a specific prefix, with the current date or with the chart timeframe. The symbol is saved automatically. Script parameters: Prefix - prefix for the template name. Can be empty. With date - true = template name will containt current date With timeframe - true = template name will containt timeframe of the current chart
FREE
Market Line Price Color
Rodolfo Leonardo De Morais
Simple Market Line Price Color This indicator allows you to see the market's aggregation by buying or selling on the price line. when it is attacked the sale turns into a color when it is attacked the purchase takes on another color Indicator Parameters indicator_colorUP - Color of UP price  aggregation   indicator_colorDown - Color of Down    price    aggregation   indicator_WIDTH - WIDTH Line in chart Good Trades 
FREE
Auto Stop Trail And Profit
Joaquin Nicolas Metayer
5 (1)
Auto Stop Trail And Profit is an expert advisor that monitors orders, when it detects that one has been placed, on the same chart that has been activated or on all assets, depending on its configuration, it will place its respective stop loss, take profit and perform trail stop loss (in a classic way, keeping a distance or "step by step"). You can see more of my products here: www.mql5.com/en/users/joaquinmetayer/seller
FREE
Regua MT4
Edgar Lima Uggioni
Convenient tool for measuring the number of points between the prices directly on the chart. Displays in the measurement between points in percentage, points (financial) and time (bars ). Compatible with all graphical timeframes. When fixed on the chart is displayed in all timeframes. Press Ctrl, click the first point, move the mouse and will now display the measurement. Click again and fix. Very fast tool that does not occupy much space. Input Parameters Line Color Line Style Text Color Text S
FREE
LT Watermark MT4
Thiago Duarte
5 (3)
This indicator draw a watermark on the chart, with the timeframe and symbol name. You can change everything, including add a aditional watermark. Functions: Symbol watermark: Size -  text size. Font -  text font. Color -  text color. Background text -  watermark at foreground or background mode. Horizontal correction -  x correction in pixels. Vertical correction -  y correction in pixels. Separator period X symbol -  what will separate the period from symbol. Aditional watermark: Enable custom
FREE
Using hotkeys, you can create graphic objects of different drawing styles and different colors on the active chart. You can change the formatting styles for graphics. You can choose default drawing styles, or set them in the advisor properties selection window. Going to the graph, when creating graphic objects, the color, line type and line thickness are selected automatically. Drawing styles for graphical objects will depend on the current timeframe where drawing will be performed. Please watch
FREE
Time Session OPEN-HIGH-LOW-CLOSE This Indicator Will Draw Lines Of OHLC Levels Of Time Session Defined By User. It Will Plot Floating Lines On Current Day Chart. Time Session Can Of Current Day Or Previous Day. You Can Plot Multiple Session Lines By Giving Unique ID To Each Session. It Can Even Show Historical Levels Of Time Session Selected By User On Chart To Do Backdating Test. You Can Write Text To Describe The Lines.
FREE
Alert TIME LINE indicator warns that the price has reached a specified time level. Drag the indicator onto the chart, press the SET TIME LINE button, move the line that appears to the desired time, when the chart reaches the specified time, an alert will be triggered. This indicator is used as an auxiliary tool when trading time zones, using the free TIME LINE Forex System , see the results and screenshots below. You can get the system for free in the technical support chat https://t.me/C
FREE
Round Number By Pips
Nguyen Thanh Sang
5 (2)
Indicator draws Round Number lines by distance of pips. 1. You can enable / disable indicator to show / hide the lines. 2. You can set distance of pips between the lines. 3. You can edit the number of lines.  4. You can edit properties of lines by inputs (style (DASH, DOT, SOLID, ...) , width (1 for DASH, DOT, 2 is not for DASH, DOT, it only SOLID), color). When indicator is deleted from the chart, the lines will be removed.
FREE
Percentage Stop
Vincent Ocasla
5 (1)
A simple risk management tool that closes all open orders if equity drops by a specified percentage. This tool is useful if you are running multiple EAs and multiple charts and pairs in order to control your risk. All orders will close accordingly. Once it hits specified percentage drawdown the closing of all orders cannot be stopped. The EA will reset once all orders are closed, until account equity drops again relative to account balance. Use at your own risk. This is only for MT4. There is o
FREE
List of buttons to switch between symbols on multiple charts 1. Set x, y coordinates (horizontal, vertical) for list of buttons. 2. Show/hide buttons by clicking button or keypress. 3. The number of columns of the button list. 4. The color of the buttons and the color of the current symbol button. 5. The button list is separated by commas. If the list is empty, the indicator takes the list of symbols in the Market Watch. 6. Set the keypress to show and hide the list of buttons. 7. Multiple Char
FREE
NEW :    integration with Ofir Signals to send personalized alerts Ofir Notify is a tool which send alerts on trades to Telegram Alert on any event concerning a position : Opening, Closing, modification (SL, TP) Send alerts to Chats, Groups and Channel Alert on Equity change Display Risk, Reward and progress of profit/lost for each position Customization of alerts Sending charts screenshots with alerts Send signals from your indicators or experts Multi-lingual NEW  : version 2 brings integratio
FREE
LT Clock MT4
Thiago Duarte
4.88 (8)
Simple indicator that draws the market hours on chart (broker, local and GMT). Functions: Horizontal distance -  from border. Vertical distance -  from border. Color -  text color. Font -  text font. Size -  text size. Corner -  which chart corner will be drawn. Show seconds -  show or hide seconds. Draw as background -  candles front or back. Label local -  text before local time. Label broker -  text before broker time. Label GMT -  text before GMT time. Object ID -  identification from object
FREE
Trade simplifier is a trade panel that simplifies trade opening. It is simple and easy to understand, with key features to ease trading. Features include: Order type selection Fixed lot entry from the chart user interface Easy Take profit entry field on the chart user interface Visual take profit selection and adjustment via the line that appears when you click the Take Profit button Easy Stop loss entry field in points on the chart user interface  Visual Stop Loss selection and adjustment  vi
FREE
TPSpro Screenshot is an indicator that screenshots the chart workspace and saves it to a folder you specify on your computer with a specified resolution and at a specified time interval. The following configurable parameters are available: Screenshot Width - Screenshot width Screenshot Height -Screenshot height The name of the folder for screenshots (by pressing "]") - The name of the folder for screenshots Rewritable File Name - Name of the file being rewritten Step in seconds for a photo - Ste
FREE
As traders, we all know that risk management is the most important aspect of profitable trading. So, we need to determine the lot size, every time we need to open a new trade. The FX lot size calculator is a simple tool that will help you to determine your lot size easily without using any third-party service but you will be able to do that by your MetaTrader terminal. LIMITED TIME OFFER: 30$ FOR 10 ACTIVATION. Inputs: Maximum_Risk_Prc: To determine your preferred risk%. For example, if your r
FREE
BE Line by MMD MT4
Mariusz Maciej Drozdowski
Break Even Line by MMD The Break Even line is a useful indicator for people using strategies that allow simultaneous trades in both directions, such as the MMD methodology. This indicator is useful when playing statistical models and averaging positions in accumulation and distribution zones. The indicator draws levels by summing positions in three groups: positions included in BUY, positions included in SELL and all positions included. Functionality description: Show BUY BELine   - shows
FREE
EasyATR BacktestTool
Kim Thanh Nguyen
5 (1)
A tool for backtesting my ATR Trailing Stoploss Helper ( https://www.mql5.com/en/market/product/34103 ) Added on-screen buttons for manual backtesting: - Clicking on button SET, then click on a candle where you want to see how this indicator would draw the ATR trailing stop for that exact time. Parameter: DRAW_ATR_TRAILING_STOP_LEVEL_TIMEFRAME = PERIOD_H4; //timeframe to calculate the value of ATR DRAW_ATR_TRAILING_STOP_LEVEL_PERIOD = 10; //period of the ATR DRAW_ATR_TRAILING_STOP_LEVEL_MULTIPL
FREE
Eraser Express
Adrian Armenta
5 (1)
Delete big amounts of orders, in just a few clicks. Drag the script to any chart to delete open and pending orders, you can delete all the orders from the account or delete a specific order groups, identifying them by magic number. You can modify the parameter MAGICN on the followay way: - Introduce the magic number that was used to place the orders you want to delete, the script will delete all pending and open orders that were placed with that magic number. - Also, introduce 0 (cero) to delete
FREE
Time Range Separator
Chantal Sala
4.83 (6)
Time Range Separator is a useful tool to display a separator period on your platform. You could go in the properties of the indicator, select the desired range and that's ALL. We believe it is a useful and necessary that we wish to share with you for free all our followers. Input Values: TimeFrame Period Separator GMT_Hour (ex. +1 or -1) to move the lines at Period Time +/- tot hours in input Hide_dates to show or hide the datetime on vertical lines VLine_Color = Vertical Color Line VLine_Styl
FREE
Contact me for any queries or custom orders, if you want to use this in an EA. Key Features: Pattern Recognition : Identifies Fair Value Gaps (FVGs) Spots Break of Structure (BOS) points Detects Change of Character (CHoCH) patterns Versatile Application : Optimized for candlestick charts Compatible with any chart type and financial instrument Real-Time and Historical Analysis : Works seamlessly with both real-time and historical data Allows for backtesting strategies and live market analysis V
FREE
Hogvid Chart Scale
David Richard Hinze
Do you want tidy and attractive charts? Let Hogvid Chart Scale help you! Chart Scale automatically scales the height of the chart to a configurable percentage of the total window height. This creates space at the top and bottom of the window for additional visual elements and increases clarity without having to manually adjust the vertical scaling which can be annoying, especially if you change the chart symbol frequently. The function can be activated and deactivated at any time with a simp
FREE
Buyers of this product also purchase
Gann Made Easy
Oleg Rodin
4.85 (82)
Gann Made Easy is a professional and easy to use Forex trading system which is based on the best principles of trading using the theory of mr. W.D. Gann. The indicator provides accurate BUY and SELL signals including Stop Loss and Take Profit Levels. You can trade even on the go using PUSH notifications. PLEASE CONTACT ME AFTER PURCHASE TO GET MY TRADING TIPS PLUS A GREAT BONUS! Probably you heard already many times about Gann trading methods. Usually Gann's theory is very complex thing not only
TPSpro RFI Levels
Roman Podpora
4.82 (22)
Reversal First Impulse levels (RFI)    INSTRUCTIONS        RUS       -       ENG              R ecommended to use with an indicator   -   TPSpro  TREND PRO -  Version MT5 A key element in trading is zones or levels from which decisions to buy or sell a trading instrument are made. Despite attempts by major players to conceal their presence in the market, they inevitably leave traces. Our task was to learn how to identify these traces and interpret them correctly. Main functions: Displaying activ
Atomic Analyst
Issam Kassas
5 (2)
First of all Its worth emphasizing here that this Trading Indicator is   Non-Repainting , Non Redrawing and Non Lagging Indicator   Indicator, Which makes it ideal from both manual and robot trading.  User manual: settings, inputs and strategy . The Atomic Analyst  is a PA Price Action Indicator that uses Strength and Momentum of the price to find a better edge in the market. Equipped with Advanced filters which help remove noises and false signals, and Increase Trading Potential. Using Multipl
Gold Stuff
Vasiliy Strukov
4.89 (238)
Gold Stuff is a trend indicator designed specifically for gold and can also be used on any financial instrument. The indicator does not redraw and does not lag. Recommended time frame H1. At it indicator work full auto  Expert Advisor EA Gold Stuff. You can find it at my profile. Contact me immediately after the purchase to get   personal bonus!  You can get a free copy of our Strong Support and Trend Scanner indicator, please pm. me! Settings  and manual here   SETTINGS Draw Arrow - on off. dra
Trend Punch
Mohamed Hassan
4.95 (19)
This indicator is unstoppable when combined with our other indicator called  Support & Resistance . After purchase, send us a message and you will get it   for  FREE as a BONUS! Introducing Trend Punch , the revolutionary forex trend indicator that will transform the way you trade! Trend Punch is uniquely designed to provide precise buy and sell arrows during strong market trends, making your trading decisions clearer and more confident. Whether you're trading major currency pairs or exotic sym
TPSproTREND PrO
Roman Podpora
4.79 (19)
TPSpro TRENDPRO  - is a trend indicator that automatically analyzes the market and provides information about the trend and each of its changes, as well as giving signals for entering trades without redrawing! The indicator uses each candle, analyzing them separately. referring to different impulses - up or down impulse. Exact entry points into transactions for currencies, crypto, metals, stocks, indices!  Version MT5             DETAILED DESCRIPTION              R ecommended to use with an indi
Scalper Inside PRO
Alexey Minkov
4.73 (56)
An exclusive indicator that utilizes an innovative algorithm to swiftly and accurately determine the market trend. The indicator automatically calculates opening, closing, and profit levels, providing detailed trading statistics. With these features, you can choose the most appropriate trading instrument for the current market conditions. Additionally, you can easily integrate your own arrow indicators into Scalper Inside Pro to quickly evaluate their statistics and profitability. Scalper Inside
FX Power MT4 NG
Daniel Stein
5 (12)
Trading GOLD, and currencies, with the dog walk strategy  - super smart Trading GOLD, and currencies, with the breakout strategy  - super easy Visit our all-new   Stein Investments Welcome Page   to get the latest information, updates and trading strategies. FX Power MT4 NG  is the next generation of our long-time very popular currency strength meter, FX Power.  And what does this next-generation strength meter offer? Everything you have loved about the original FX Power  PLUS GOLD/XAU stre
Trend Screener
STE S.S.COMPANY
4.8 (87)
Unlock the Power of Trends Trading with the Trend Screener Indicator: Your Ultimate Trend Trading Solution powered by Fuzzy Logic and Multi-Currencies System! Elevate your trading game with the Trend Screener, the revolutionary trend indicator designed to transform your Metatrader into a powerful Trend Analyzer. This comprehensive tool leverages fuzzy logic and integrates over 13 premium features and three trading strategies, offering unmatched precision and versatility. LIMITED TIME OFFER : Sup
Currently 20% OFF ! Best Solution for any Newbie or Expert Trader! This dashboard software is working on 28 currency pairs plus one. It is based on 2 of our main indicators (Advanced Currency Strength 28 and Advanced Currency Impulse). It gives a great overview of the entire Forex market plus Gold or 1 indices. It shows Advanced Currency Strength values, currency speed of movement and signals for 28 Forex pairs in all (9) timeframes. Imagine how your trading will improve when you can watch the e
FX Volume
Daniel Stein
4.58 (33)
Visit our all-new   Stein Investments Welcome Page   to get the latest information, updates and trading strategies. FX Volume is the FIRST and ONLY volume indicator that provides a REAL insight into the market sentiment from a broker's point of view. It provides awesome insights into how institutional market participants, like brokers, are positioned in the Forex market, much faster than COT reports. Seeing this information directly on your chart is the real game-changer and breakthrough solut
CURRENTLY 31% OFF !! Best Solution for any Newbie or Expert Trader! This indicator is a unique, high quality and affordable trading tool because we have incorporated a number of proprietary features and a secret formula. With only ONE chart it gives Alerts for all 28 currency pairs. Imagine how your trading will improve because you are able to pinpoint the exact trigger point of a new trend or scalping opportunity! Built on new underlying algorithms it makes it even easier to identify and confir
Enigmera
Ivan Stefanov
5 (3)
ENIGMERA: The core of the market (If the demo of mql5.com doesn't working and you want to try Enigmera please message me.) Introduction This indicator and trading system is a remarkable approach to the financial markets . ENIGMERA uses the fractal cycles to accurately calculate support and resistance levels. It shows the authentic accumulation phase and gives direction and targets.  A system that works whether we are in a trend or a correction.   How does it operate? ENIGMERA comprises of fol
- Real price is 80$ - 40% Discount ( It is 49$ now ) Contact me for instruction, add group and any questions! Related EA Product: Bitcoin Expert Introduction The breakout and retest strategy is traded support and resistance levels. it involves price breaking through a previous level.  The break and retest strategy is designed to help traders do two main things, the first is to avoid false breakouts. Many false breakouts start with a candlestick that breaks out of a level but ends with an immedi
The Chart Patterns All-in-One indicator helps traders visualize various chart patterns commonly used in technical analysis. It supports identifying potential market behaviors, but profitability is not guaranteed. Testing in demo mode is recommended before purchasing. Current Offer : 50% discount on the "Chart Patterns All in One" indicator. Included Patterns : Pattern 1-2-3 : Detects market reversals using three key points (highs or lows). Buy : Two consecutive lows followed by a lower high. Se
CURRENTLY 26% OFF Best Solution for any Newbie or Expert Trader! This Indicator is a unique, high quality and affordable trading tool because we have incorporated a number of proprietary features and a new formula. With only ONE chart you can read Currency Strength for 28 Forex pairs! Imagine how your trading will improve because you are able to pinpoint the exact trigger point of a new trend or scalping opportunity? User manual: click here That's the first one, the original! Don't buy a worthle
Market Reversal Alerts
LEE SAMSON
4.19 (113)
Profit from market structure changes as price reverses and pulls back. The market structure reversal alert indicator identifies when a trend or price move is approaching exhaustion and ready to reverse. It alerts you to changes in market structure which typically occur when a reversal or major pullback are about to happen. The indicator identifies breakouts and price momentum initially, every time a new high or low is formed near a possible exhaustion point. The indicator draws in a rectangle on
Bomb Bank Signal
Igor Pereira Calil
5 (1)
Bomb Bank Signal: Your Trusted Indicator for MetaTrader 4 The Bomb Bank Signal is a powerful indicator for MetaTrader 4, designed to identify the most relevant trends in the financial market. If you are looking for a tool that accurately anticipates movements, Bomb Bank is the ally you need. How it Works: This indicator combines three distinct methods – volume analysis, candle closes and symmetrical trend – to detect and signal buying and selling opportunities. Bomb Bank is like a "bomb"
Trend Cutter
Oleg Rodin
5 (2)
Trend Cutter   is a trend indicator which can be used with any time frame including the lower time frames like M1 and M5. The indicator is ideal for traders who prefer intraday trading and will be helpful to those who prefer long-term trading as well. You can use this indicator as a basis for your trading system or as a standalone trading solution. The indicator provides non-repaint signals on the close of the current candle. When the signal candle is closed, the signal will stay fixed on chart.
TakePropips Donchian Trend Pro
Eric John Pajarillaga Aldana
4.44 (16)
TakePropips Donchian Trend Pro  (MT4) is a powerful and effective tool that automatically detects the direction of the trend using the Donchian Channel and provides you with an entry and exit trading signals! This multi-function indicator includes a trend scanner, trading signals, statistical panel, screener, trading sessions, and alerts history dashboard. It is designed to provide you with trading signals and save you hours analyzing the charts! You can download the user manual and installation
IX Power MT4
Daniel Stein
5 (5)
IX Power finally brings the unbeatable precision of FX Power to all your trading symbols. It accurately determines the intensity of short, medium and long-term trends in your favourite indices, stocks, commodities, ETFs, and even cryptocurrencies. You can analyse everything your terminal has to offer. Try it out and experience how your timing improves significantly when trading. Read about our latest strategic development -  Easy scalping with IX Power Visit our all-new   Stein Investments
Stratos Pali Indicator   is a revolutionary tool designed to enhance your trading strategy by accurately identifying market trends. This sophisticated indicator uses a unique algorithm to generate a complete histogram, which records when the trend is Long or Short. When a trend reversal occurs, an arrow appears, indicating the new direction of the trend. Important Information Revealed Leave a review and contact me via mql5 message to receive My Top 5 set files for Stratos Pali at no cost! D
Gold Channel is a volatility-based indicator, developed with a specific timing algorithm for the XAUUSD pair, which consists of finding possible corrections in the market. This indicator shows two outer lines, an inner line (retracement line) and an arrow sign, where the theory of the channel is to help identify overbought and oversold conditions in the market. The market price will generally fall between the boundaries of the channel. If prices touch or move outside the channel it is a tra
Advanced Supply Demand
Bernhard Schweigert
4.91 (294)
CURRENTLY 26% OFF !! Best Solution for any Newbie or Expert Trader! This indicator is a unique, high quality and affordable trading tool because we have incorporated a number of proprietary features and a new formula. With this update, you will be able to show double timeframe zones. You will not only be able to show a higher TF but to show both, the chart TF, PLUS the higher TF: SHOWING NESTED ZONES. All Supply Demand traders will love it. :) Important Information Revealed Maximize the potenti
Automatically draw support and resistance levels PLUS propulsion candle gaps on your chart, so you can see where price is likely to head next and/or potentially reverse. This indicator is designed to be used as part of the position trading methodology taught on my website (The Market Structure Trader) and displays key information for targeting and potential entries. MT version available here:  https://www.mql5.com/en/market/product/97973 There are 2 CORE features in the indicator and 4 additiona
Currency Strength Wizard is a very powerful indicator that provides you with all-in-one solution for successful trading. The indicator calculates the power of this or that forex pair using the data of all currencies on multiple time frames. This data is represented in a form of easy to use currency index and currency power lines which you can use to see the power of this or that currency. All you need is attach the indicator to the chart you want to trade and the indicator will show you real str
Order Block Hunter
Noha Mohamed Fathy Younes Badr
5 (4)
Order block hunter indicator is the best indicator for  hunt the order blocks that area where there has been a large concentration of limit orders waiting to be executed Order blocks are identified on a chart by observing previous price action and looking for areas where the price experienced significant movement or sudden changes in direction .This indicator does that for you by using very complicated codes and helps you to take the best areas To buy and sell because it make marks at the best a
This dashboard is an alert tool for use with the market structure reversal indicator. It's primary purpose is to alert you to reversal opportunities on specific time frames and also to the re-tests of the alerts (confirmation) as the indicator does. The dashboard is designed to sit on a chart on it's own and work in the background to send you alerts on your chosen pairs and timeframes. It was developed after many people requested a dash to monitor multiple pairs and time frames at once rather th
PRO Renko System
Oleg Rodin
5 (25)
PRO Renko System is a highly accurate trading system specially designed for trading RENKO charts. The ARROWS and Trend Indicators DO NOT REPAINT! The system effectively neutralizes so called market noise giving you access to accurate reversal signals. The indicator is very easy to use and has only one parameter responsible for signal generation. You can easily adapt the tool to any trading instrument of your choice and the size of the renko bar. I am always ready to provide extra support to help
Trend Pulse
Mohamed Hassan
5 (4)
Please contact me after purchase to immediately get your PDF strategy + documentation for Trend Pulse !  Introducing Trend Pulse , a unique and robust indicator capable of detecting bullish, bearish, and even ranging trends! Trend Pulse uses a special algorithm to filter out market noise with real precision. If the current symbol is moving sideways, Trend Pulse will send you a ranging signal, letting you know that it's not a good time to enter a trade. This excellent system makes Trend Pulse
More from author
Draw and Sync Objects
Nguyen Thanh Sang
5 (6)
Draw and Sync Objects Multiple Charts 1. Draw objects by key press. ( You must: 1.  Press Function key => 2. Click where you want to draw => 3. Draw it => 4. Press ESC to complete). (If you don't want to draw after pressing function key, you must press ESC to cancel). 2. Developing  : Sync selected objects to multiple charts by button. 3. Developing: Hide objects that do not belong to the current symbol (Objects drawn with this indicator will belong to the symbol they are plotted on. When your c
FREE
Candle Time Remaining
Nguyen Thanh Sang
5 (2)
This indicator show candle time remaining. The remaining time of the candle is calculated every 200 milliseconds. 1. You can set x (horizontal), y (vertical) of text. 2. You can set font, color, size of text. 3. You can remove the text without having to remove the indicator from the chart. The remaining time of the candle depends on the timeframe of the chart with the indicator.
FREE
Alert System
Nguyen Thanh Sang
5 (1)
Alert System You use function keys to create horizontal lines for alerts. 1. Allow set horizontal line properties (line color, line style, line width, ...) for alerts. 2. Allow add text to horizotanl line. You can hide or show text when you need. You can change text and its price, but time of text will be set in input named "text_time" (0 is current time, you should test this input with -1, -2, -3 or lower). 3. It has 2 types of alert: above and bellow. You can set key to create them. If price i
FREE
Synchronize objects from one chart to multiple charts. Synchronize objects from one chart to multiple charts. 1. Allows automatic synchronization of new and edited objects to other charts. 2. Allows synchronization of all objects on the chart to other charts at the current time. 3. Allows setting the charts to synchronize based on the position of the chart in the MT4 window. Version 1.2: Allow set list of object names that you don't want to sync (Separated by commas ",") Allow set 5 types of
FREE
Tokyo Session Box
Nguyen Thanh Sang
3 (1)
Tokyo Session Box Indicator : Draw a box of Tokyo session. Inputs tutorial: 1. Automatic: true/false. To calculate box automatic base GMT. 2. Broker time zone: if Automatic is False, you have to define broker time zone (ex: 2 ) 3. Button ON/OFF properties: x, y, corner, color, background fill, width, height, font name, font size.   This button will toggle showing or hiding Tokyo session box.
FREE
Round Number By Pips
Nguyen Thanh Sang
5 (2)
Indicator draws Round Number lines by distance of pips. 1. You can enable / disable indicator to show / hide the lines. 2. You can set distance of pips between the lines. 3. You can edit the number of lines.  4. You can edit properties of lines by inputs (style (DASH, DOT, SOLID, ...) , width (1 for DASH, DOT, 2 is not for DASH, DOT, it only SOLID), color). When indicator is deleted from the chart, the lines will be removed.
FREE
List of buttons to switch between symbols on multiple charts 1. Set x, y coordinates (horizontal, vertical) for list of buttons. 2. Show/hide buttons by clicking button or keypress. 3. The number of columns of the button list. 4. The color of the buttons and the color of the current symbol button. 5. The button list is separated by commas. If the list is empty, the indicator takes the list of symbols in the Market Watch. 6. Set the keypress to show and hide the list of buttons. 7. Multiple Char
FREE
Switch symbols and timeframe by arrow buttons 1. You can switch multiple symbols of one or all charts. 2. You can set list of symbols to switch between them or get them from Market Watch. 3. You can change timeframe of one or all charts. List of timeframes here [M1, M5, M15, M30, H1, H4, D1, W1, MN1]. Switch symbol of all charts: indicator check current symbol of the chart to get index of it in list and change for next or previous. Key functions: - Right arrow key: switch to next symbol. - Left
FREE
Filter:
Mino Ebasta
18
Mino Ebasta 2023.09.10 01:04 
 

Great! Well done!!! Is it possible to add alerts when the price enters the rectangle? It would be perfect!!! and if you want to exaggerate, the possibility of changing between 2 template.

Romário Costa
45
Romário Costa 2023.06.28 16:02 
 

perfect bro! Can you add erase same object in all chart? thanks

simonlongster
200
simonlongster 2023.03.15 17:07 
 

User didn't leave any comment to the rating

Nicolas Dobrovsky
789
Nicolas Dobrovsky 2023.01.31 10:16 
 

User didn't leave any comment to the rating

tiennguyen123076
14
tiennguyen123076 2023.01.09 06:04 
 

Yup, just like magic, this is one of the best tools that I've ever seen, cảm ơn b

tinhkhong
27
tinhkhong 2022.10.19 04:46 
 

có cách nào tải vesion cũ k bạn ơi

fxcommentary
1893
fxcommentary 2022.05.21 01:13 
 

User didn't leave any comment to the rating

Mon_P0l131
83
Mon_P0l131 2022.03.26 03:59 
 

Like I said in the comments section, it's a great drawing tool. I like the sync feature which sets this apart from the other drawing tools out there. Hoping the author will continue to improve the tool. Thanks!

youngweijun
36
youngweijun 2022.03.24 17:18 
 

Great tool. Very handy. I like the shortcut keys functions to allow quicker execution to draw fibo / rectangle, etc. It's better than the author's first sync chart indicator, which is very similar. But no bugs founds on this (yet), almost perfect because this indicator is unable to draw horizontal lines yet. Maybe the next update?

pkartaaa85
133
pkartaaa85 2022.03.18 05:07 
 

User didn't leave any comment to the rating

Mary Gomes
277
Mary Gomes 2022.03.12 04:40 
 

User didn't leave any comment to the rating

Reply to review
Version 2.10 2022.03.19
Version 2.10: add key inputs to draw rectangle, trendline, text and fibonacci retracement.
Version 1.50 2022.03.07
Version 1.50:

- Hide objects belong other symbols have been drawn by this indicator.

- Sync selected objects when you click Sync Objects button:

+ Enable sync button in input.

+ Set indexes of chart you want to sync (First chart index is 1. Next chart index is 2, ...)
Version 1.40 2022.03.07
Version 1.40: Add 5 colors input for select the color rectangle after creating it.
Version 1.30 2022.03.05
Add function to key U for extend all Rectangles drawn by this indicator to last bar
Version 1.20 2022.03.05
When the rectangle drawn by indicator has been changed, the lines of it will be changed
Version 1.10 2022.03.05
When the rectangle has been deleted, the lines of rectangle will be deleted.