BBMA V1 Toggle Show Hide MT4
- Indicators
- Khairul Ammar Izzuddin Bin Mohd Khairul Nizam
- Version: 1.27
- Updated: 3 April 2022
- Activations: 10
Intro
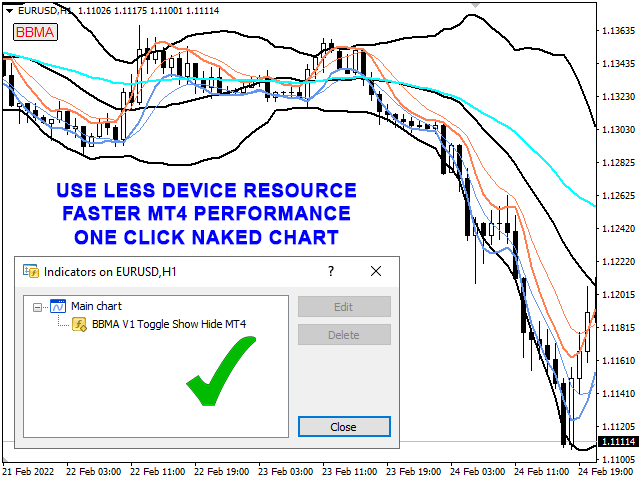
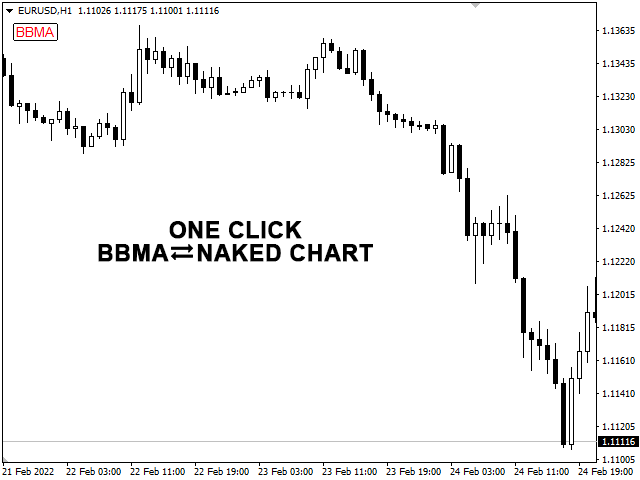
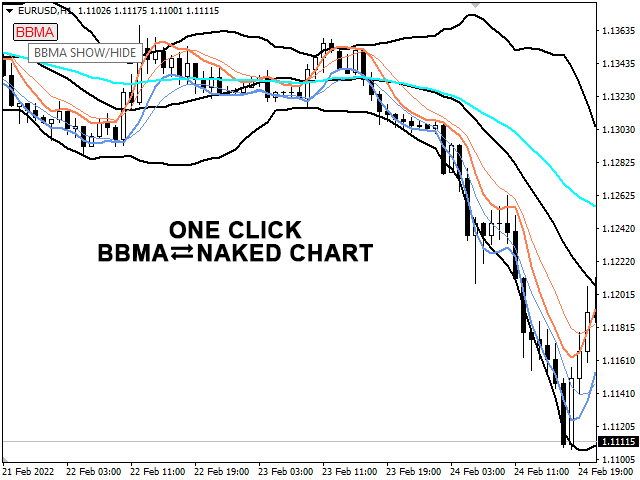
A customizable toggle indicator based on BBMA (Bollinger Bands & Moving Averages) trading system which allows traders to switch between BBMA & Naked Chart in one click, without having the need to change the chart template.
Main Features
One Click Toggle Show/Hide : Switch to naked chart in just one click! Combine it with other trading strategy as you prefer to give more confluence on your trading. All drawn objects will not be affected by the indicator toggle show/hide function.
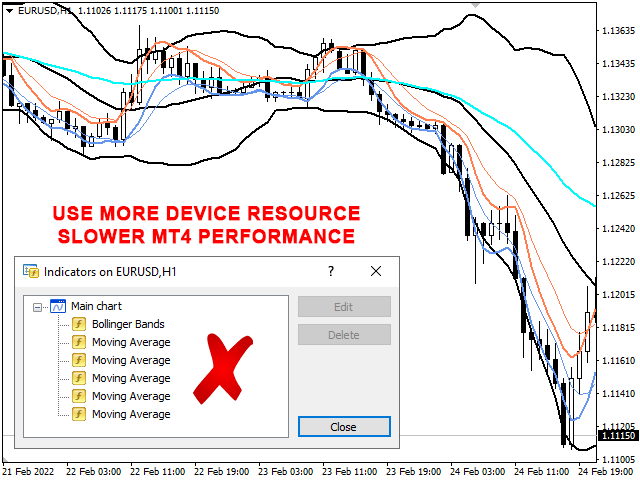
Customizable Indicator Parameter : Customizable toggle button (unique ID, position & style), 1 Bollinger Bands (parameter & style) & 5 Moving Averages (parameter & style). Set Color parameter to 'None' to disable any specific indicator.
Maxbars Function : Limit the visibility of the indicator to your preferred number of bars. Helps in reducing device resources used for a smooth & faster trading chart functions.
Multi-Currency & Multi-Timeframe : Attach it to your desirable currency or timeframe (standard & custom).
Other Features
Online & Offline Chart Compatability : Compatible with both online (live) chart & offline chart. Also compatible in strategy tester & Soft4FX Simulator.
Keep Calm & Happy Trading!