• Overview
  • Reviews
  • Comments
  • What's new

Auto Trend Line Channel with Alert

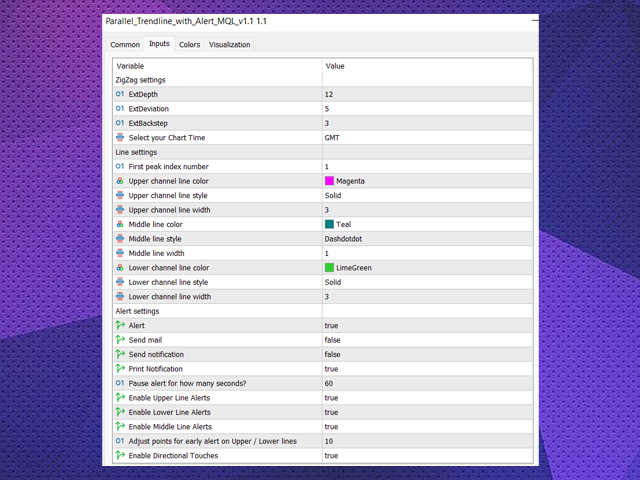
Add this indicator to chart and set the ExtDepth Setting of ZigZag 

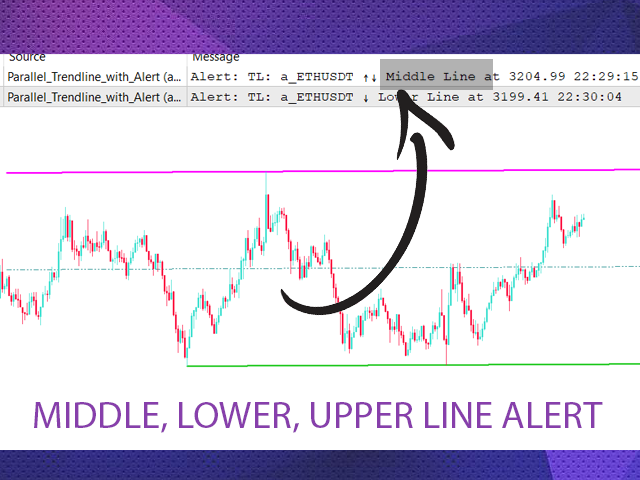
It gives instant alert when Price touches trendline Upper, Lower or Middle channel

Features :

-Enable / Disable alerts on upper, lower or middle line
- Add pause after a alert in seconds
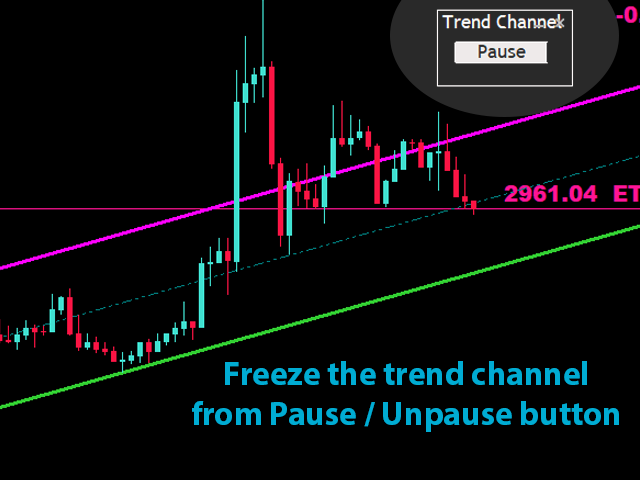
- Pause or Unpause Trend channel with button on chart
- Add early alerts by adding points in input field, for example ETH price is 2900.25 here the digits 25 is "point", so if you add 25 in input field in points and if the value of lower line at trend channel is 2900.25 then you will get early alert at 2900.50 (adding 25 points from settings)

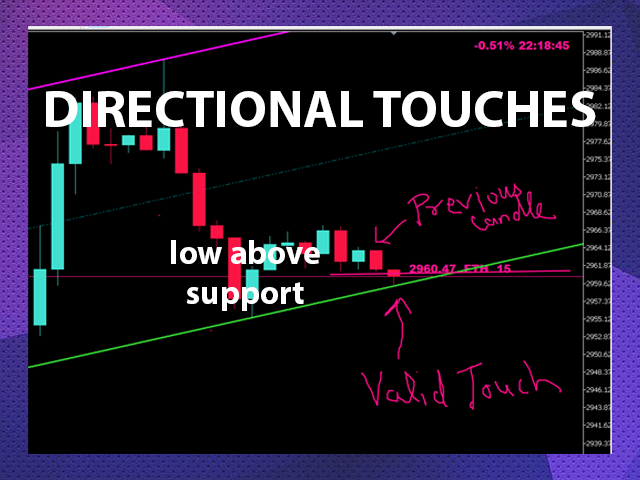
- Enable / Disable Directional touches, see screenshot for more info, A directional touch is considered when price touch a resistance from bottom and support from top, this feature is added to avoid noise from multiple alerts

If you trade in 1minute to 5 minute chart, recommended setting to the Extdepth is 55

If you trade 1 hour to 4 hour chart, recommended setting to the Extdepth is 21

You can adjust any other Extdepth as you find comfortable on chart, find the best trend channel and pause it and wait for alert to buy or sell,

Additionally you can use price action info or candle patterns to verify reversal.

You can add this to many chart and get alert on multi symbols

Please set the timezone of chart, If its in GMT, set it to GMT else set it to Localtime (IMPORTANT)

You can also customize the color, style and width of trendline

You can set terminal alert, Push notification, Email or Print notification


Recommended products
TrendDetect
Pavel Gotkevitch
The Trend Detect indicator combines the features of both trend indicators and oscillators. This indicator is a convenient tool for detecting short-term market cycles and identifying overbought and oversold levels. A long position can be opened when the indicator starts leaving the oversold area and breaks the zero level from below. A short position can be opened when the indicator starts leaving the overbought area and breaks the zero level from above. An opposite signal of the indicator can
Indicator and Expert Adviser  EA Available in the comments section of this product. Download with Indicator must have indicator installed for EA to work. Mt5 indicator alerts for bollinger band and envelope extremes occurring at the same time. Buy signal alerts occur when A bullish candle has formed below both the lower bollinger band and the lower envelope  Bar must open and close below both these indicators. Sell signal occur when A bear bar is formed above the upper bollinger band and upp
Supply and Demand Monster
Tsog Erdene Borjigon Enkhkhudulmur
Supply and demand zones are at the heart of   supply and demand trading . These zones are areas that show  liquidity at a specific price.  The supply zone is also called the distribution zone, while the demand zone is called the accumulation zone.   Our indicator automatically draw supply and demand zones in Metatrader 5. It give opportunity to understand trading zone and avoiding risk.
ATrend
Zaha Feiz
4.75 (4)
ATREND: How It Works and How to Use It How It Works The " ATREND " indicator for the MT5 platform is designed to provide traders with robust buy and sell signals by utilizing a combination of technical analysis methodologies. This indicator primarily leverages the Average True Range (ATR) for volatility measurement, alongside trend detection algorithms to identify potential market movements. Leave a massage after purchase and receive a special bonus gift. 8 copies left for 30$ price  Key Fe
Owl Smart Levels MT5
Sergey Ermolov
4.07 (28)
MT4 version  |   FAQ The Owl Smart Levels Indicator is a complete trading system within the one indicator that includes such popular market analysis tools as Bill Williams' advanced fractals , Valable ZigZag which builds the correct wave structure of the market, and Fibonacci levels which mark the exact levels of entry into the market and places to take profits. Detailed description of the strategy Instructions for working with the indicator Advisor-assistant in trading Owl Helper Private User
Premium level is a unique indicator with more than 80% accuracy of correct predictions! This indicator has been tested for more than two months by the best Trading Specialists! The author's indicator you will not find anywhere else! From the screenshots you can see for yourself the accuracy of this tool! 1 is great for trading binary options with an expiration time of 1 candle. 2 works on all currency pairs, stocks, commodities, cryptocurrencies Instructions: As soon as the red ar
Gioteen Volatility Index (GVI) - your ultimate solution to overcoming market unpredictability and maximizing trading opportunities. This revolutionary indicator helps you in lowering your losing trades due to choppy market movements. The GVI is designed to measure market volatility, providing you with valuable insights to identify the most favorable trading prospects. Its intuitive interface consists of a dynamic red line representing the volatility index, accompanied by blue line that indicate
Noize Absorption Index - is the manual trading system that measures the difference of pressure between bears forces and bulls forces. Green line - is a noize free index that showing curent situation. Zero value of index shows totally choppy/flat market.Values above zero level shows how powerfull bullish wave is and values below zero measures bearish forces.Up arrow appears on bearish market when it's ready to reverse, dn arrow appears on weak bullish market, as a result of reverse expectation.
Automated Trendlines MT5
Georgios Kalomoiropoulos
Trendlines  are the most essential tool of technical analysis in forex trading.  Unfortunately, most  traders don’t draw them correctly. Automated Trendlines indicator is a professional tool for serious traders that help you visualize the trending movement of the markets . AMAZING OFFER --> Activations from 5 to 20 for "MTF Supply Demand Zones" and "Automated Trendlines" There are two types of Trendlines Bullish Trendlines and Bearish Trendlines. In the uptrend, Forex trend line is drawn th
Terra Infinity is a flat indicator. This improved version of the CalcFlat indicator has three additional lines that significantly increase its effectiveness. Unlike its predecessor with two static levels, Terra Infinity adds three dynamic lines above the main histogram, which are interpreted as follows: base signal line, minimum signal line, maximum signal line. These lines are formed using the additional parameter Avg, which is the average value of the histogram. Averaging produces a line
Double HMA MTF for MT5
Pavel Zamoshnikov
3.67 (3)
This is an advanced multi-timeframe version of the popular Hull Moving Average (HMA) Features Two lines of the Hull indicator of different timeframes on the same chart. The HMA line of the higher timeframe defines the trend, and the HMA line of the current timeframe defines the short-term price movements. A graphical panel with HMA indicator data from all timeframes at the same time . If the HMA switched its direction on any timeframe, the panel displays a question or exclamation mark with a tex
Atomic Analyst MT5
Issam Kassas
4.56 (18)
First of all Its worth emphasizing here that this Trading Indicator is   Non-Repainting   , Non Redrawing and Non Lagging Indicator   Indicator, Which makes it ideal from both manual and robot trading.  User manual: settings, inputs and strategy . The Atomic Analyst  is a PA Price Action Indicator that uses Strength and Momentum of the price to find a better edge in the market. Equipped with Advanced filters which help remove noises and false signals, and Increase Trading Potential. Using Mult
Ichimoku Aiko MTF
Michael Jonah Randriamampionontsoa
Ichimoku Aiko MTF is a collection of technical indicators that show support and resistance levels, as well as momentum and trend direction. It is a multi-timeframe indicator so you don't need to change the chart timeframe when you want to see the ichimoku clouds on a higher timeframe.  eg. The chart timeframe is M15 and you want to see on the M15 timeframe chart the H1 ichimoku indicators (the ichimoku in Metatrader can't do that) that's why you need to use Ichimoku Aiko MTF.
Indicator for determining flat and trend. If the price is below any of the two histograms and two lines (red and blue), this is a sell zone. When purchasing this version of the indicator, MT4 version for one real and one demo account - as a gift (to receive, write me a private message)! If the price is above any of the two histograms and two lines (red and blue), this is a buy zone. MT4 version:  https://www.mql5.com/ru/market/product/3793 If the price is between two lines or in the zone
The standard Bollinger Bands indicator has been improved by integrating additional indications from the Standard Deviation indicator (StdDev), which gives an additional filter for confirming trading signals. In addition, the color of the indicator's lines shows the beginning of a trend, its development and exhaustion. This indicator has a signal block that notifies the trader of the beginning of the trend on any time frame to which it is attached. Settings Type of messages - select the type of
The Penta-O is a 6-point retracement harmonacci pattern which usually precedes big market movements. Penta-O patterns can expand and repaint quite a bit. To make things easier this indicator implements a twist: it waits for a donchian breakout in the right direction before signaling the trade. The end result is an otherwise repainting indicator with a very reliable trading signal. The donchian breakout period is entered as an input. [ Installation Guide | Update Guide | Troubleshooting | FAQ | A
This indicator finds Three Drives patterns. The Three Drives pattern is a 6-point reversal pattern characterised by a series of higher highs or lower lows that complete at a 127% or 161.8% Fibonacci extension. It signals that the market is exhausted and a reversal can happen. [ Installation Guide | Update Guide | Troubleshooting | FAQ | All Products ] Customizable pattern sizes Customizable colors and sizes Customizable breakout periods Customizable 1-2-3 and 0-A-B ratios It implements visua
PipFinite Exit EDGE MT5
Karlo Wilson Vendiola
4.86 (29)
Did You Have A Profitable Trade But Suddenly Reversed? In a solid strategy, exiting a trade is equally important as entering. Exit EDGE helps maximize your current trade profit and avoid turning winning trades to losers. Never Miss An Exit Signal Again Monitor all pairs and timeframes in just 1 chart www.mql5.com/en/blogs/post/726558 How To Trade You can close your open trades as soon as you receive a signal Close your Buy orders if you receive an Exit Buy Signal. Close your Sell orde
Point Black
Ignacio Agustin Mene Franco
Black Card Pack indicator 5/1 point black It has the strategy of professional bollingers where each arrow gives you a different entry signal. It is used to operate in m1 and in d1 It is used for scalping and intraday, modified for forex markets ! suitable for all pairs modified for synthetic index markets suitable for all pairs! Ideal for volatility and jumps!
The new update makes this indicator a complete tool for studying, analyzing and operating probabilistic patterns. It includes: On-chart Multi-asset percentage monitor. Configurable martingales. Twenty-one pre-configured patterns, including Mhi patterns and C3. An advanced pattern editor to store up to 5 custom patterns. Backtest mode to test results with loss reports. Trend filter. Hit operational filter. Martingale Cycles option. Various types of strategies and alerts. Confluence between patter
The Supernova Momentums indicator simplifies the visual perception of the price chart and reduces the time for analysis: if there is no signal, the deal is not opened, and if an opposite signal appears, it is recommended to close the current position. This arrow indicator is designed to determine the trend. Supernova Momentums implements a trend trading strategy, filters out market noise, and includes all the necessary features in one tool. Its work is based on automatically determining the c
Trade history
Andriy Konovalov
5 (2)
The indicator plots charts of profit taken at the Close of candles for closed (or partially closed) long and short positions individually. The indicator allows to filter deals by the current symbol, specified expert ID (magic number) and the presence (absence) of a substring in a deal comment, to set the start time and the periodicity of profit reset (daily, weekly or monthly) to calculate the profit chart. The indicator also displays the floating (not fixed) profit of the opened positions at th
LT Rainbow Trend
Thiago Duarte
5 (1)
Do you, like me, like to trade with the trend? Then this indicator will help you! Rainbow Trend is a trend indicator, which uses several Moving Averages on the chart. It measures different trend strenght zones for different periods: very long term, long term, mid term, short term and very short term. Each zone has its color, and it is possible to have sound alert when the prices leaves a zone and enters another. Its configuration is very simple. If you find any bug or have any suggestions, co
KT Renko Patterns MT5
KEENBASE SOFTWARE SOLUTIONS
KT Renko Patterns scans the Renko chart brick by brick to find some famous chart patterns that are frequently used by traders across the various financial markets. Compared to the time-based charts, patterns based trading is easier and more evident on Renko charts due to their uncluttered appearance. KT Renko Patterns features multiple Renko patterns, and many of these patterns are extensively explained in the book titled Profitable Trading with Renko Charts by Prashant Shah. A 100% automate
SolarTrade Suite Financial Indicator: Jupiter Market Indicator - Your Reliable Guide in the World of Financial Markets! This is a trend indicator that uses special innovative and advanced algorithms to calculate its value, and also has an eye-pleasing design. It is very easy to understand the readings of this indicator: blue color - buy, red - sell. Check out our other products from the SolarTrade Suite series at the bottom of the description. Do you want to confidently navigate the wor
Features All Ichimoku Signals (Selectable) : Display all reliable signals generated by the Ichimoku indicator. You can choose which signals to view based on your preferences. Filter by Signal Strength : Sort signals by their strength—whether they are weak, neutral, or strong. Live Notifications : Receive real-time notifications for Ichimoku signals. Transparent Cloud : Visualize the Ichimoku cloud in a transparent manner. Available Signals Tenkensen-Kijunsen Cross Price-Kijunsen Cross Pri
PZ Fibonacci MT5
PZ TRADING SLU
5 (1)
Are you tired of plotting Fibonacci retracements or extensions manually? This indicator displays Fibo retracements or extensions automatically, calculated from two different price points, without human intervention or manual object anchoring. [ Installation Guide | Update Guide | Troubleshooting | FAQ | All Products ] Easy to use Manual anchoring is not needed Perfect for price confluence studies The indicator evaluates if retracements or extensions are needed Once drawn, you can manually edit t
This is Gekko's Cutomized Relative Strength Index (RSI), a customized version of the famous RSI indicator. Use the regular RSI and take advantage two entry signals calculations and different ways of being alerted whenever there is potential entry or exit point. Inputs Period: Period for the RSI calculation; How will the indicator calculate entry (swing) signals: 1- Produces Exit Signals for Swings based on RSI entering and leaving Upper and Lower Levels Zones; 2- Produces Entry/Exit Signals fo
DYJ SuperTrendWave is a highly accurate peak and trough trading system. This indicator looks for the highest and lowest points of candles as entering and leaving the market. The entrance price is near the highest or lowest point. The notification type of signal has been added to the dyj supertrend. When a multi-space signal is generated, The following types of notification signals are available:  Alert  mailSend, MobilePush. Input InpSignalPeriod   =  10; BarDistance       =  24; InpIsAlert 
Your Trend Friend
Luigi Nunes Labigalini
5 (1)
The trend is your friend! Look at the color of the indicator and trade on that direction. It does not  repaint. After each candle is closed, that's the color of the trend. You can focus on shorter faster trends or major trends, just test what's most suitable for the symbol and timeframe you trade. Simply change the "Length" parameter and the indicator will automatically adapt. You can also change the color, thickness and style of the lines. Download and give it a try! There are big movements
Buyers of this product also purchase
TPSproTREND PrO MT5
Roman Podpora
4.89 (9)
TPSpro TREND PRO  - is a trend indicator that automatically analyzes the market and provides information about the trend and each of its changes, as well as giving signals for entering trades without redrawing! The indicator uses each candle, analyzing them separately. referring to different impulses - up or down impulse. Exact entry points into transactions for currencies, crypto, metals, stocks, indices!  Version MT4               DETAILED DESCRIPTION               R ecommended to use with an
TPSpro RFI Levels MT5
Roman Podpora
4.7 (10)
Reversal First Impulse levels (RFI)      INSTRUCTIONS        RUS       -       ENG              R ecommended to use with an indicator   -   TPSpro  TREND PRO -  Version MT4                 A key element in trading is zones or levels from which decisions to buy or sell a trading instrument are made. Despite attempts by major players to conceal their presence in the market, they inevitably leave traces. Our task was to learn how to identify these traces and interpret them correctly. Main functi
Atbot
Zaha Feiz
4.97 (34)
ATbot : How It Works and How to Use It How It Works The "AtBot" indicator for the MT5 platform generates buy and sell signals using a combination of technical analysis tools. It integrates Simple Moving Average (SMA), Exponential Moving Average (EMA), and the Average True Range (ATR) index to identify trading opportunities. Additionally, it can utilize Heikin Ashi candles to enhance signal accuracy. MQL Channel    Leave a massage after purchase and receive a special bonus gift. 9 copies left for
Gold Stuff mt5
Vasiliy Strukov
4.92 (163)
Gold Stuff mt5 is a trend indicator designed specifically for gold and can also be used on any financial instrument. The indicator does not redraw and does not lag. Recommended time frame H1. Contact me immediately after the purchase to get   personal bonus!  You can get a free copy of our Strong Support and Trend Scanner indicator, please pm. me! Settings  and manual   here   SETTINGS Draw Arrow - on off. drawing arrows on the chart. Alerts -   on off audible alerts. E-mail notification - on of
First of all Its worth emphasizing here that this Trading System is Non-Repainting   , Non Redrawing and Non Lagging Indicator Which makes it ideal from both manual and robot trading .  Online course, manual and download presets. The Smart Trend Trading System MT5 is a comprehensive trading solution tailored for new and experienced traders . It combines over 10 premium indicators and features more than 7 robust trading strategies , making it a versatile choice for diverse market conditions . Tre
Quantum Trend Sniper
Bogdan Ion Puscasu
4.79 (48)
Introducing   Quantum Trend Sniper Indicator , the groundbreaking MQL5 Indicator that's transforming the way you identify and trade trend reversals! Developed by a team of experienced traders with trading experience of over 13 years,   Quantum Trend Sniper Indicator   is designed to propel your trading journey to new heights with its innovative way of identifying trend reversals with extremely high accuracy. ***Buy Quantum Trend Sniper Indicator and you could get Quantum Breakout Indicator fo
Trend Screener Pro MT5
STE S.S.COMPANY
4.87 (62)
Unlock the Power of Trends Trading with the Trend Screener Indicator: Your Ultimate Trend Trading Solution powered by Fuzzy Logic and Multi-Currencies System! Elevate your trading game with the Trend Screener, the revolutionary trend indicator designed to transform your Metatrader into a powerful Trend Analyzer. This comprehensive tool leverages fuzzy logic and integrates over 13 premium features and three trading strategies, offering unmatched precision and versatility. LIMITED TIME OFFER : Tre
FX Power MT5 NG
Daniel Stein
5 (5)
Trading GOLD, and currencies, with the dog walk strategy  - super smart Trading GOLD, and currencies, with the breakout strategy  - super easy Visit our all-new   Stein Investments Welcome Page   to get the latest information, updates and trading strategies. FX Power MT5 NG  is the next generation of our long-time very popular currency strength meter, FX Power.  And what does this next-generation strength meter offer? Everything you have loved about the original FX Power  PLUS GOLD/XAU st
Top indicator for MT5   providing accurate signals to enter a trade without repainting! It can be applied to any financial assets:   forex, cryptocurrencies, metals, stocks, indices .  Watch  the video  (6:22) with an example of processing only one signal that paid off the indicator! MT4 version is here It will provide pretty accurate trading signals and tell you when it's best to open a trade and close it. Most traders improve their trading results during the first trading week with the help of
FX Volume MT5
Daniel Stein
4.93 (14)
Visit our all-new   Stein Investments Welcome Page   to get the latest information, updates and trading strategies. FX Volume is the FIRST and ONLY volume indicator that provides a REAL insight into the market sentiment from a broker's point of view. It provides awesome insights into how institutional market participants, like brokers, are positioned in the Forex market, much faster than COT reports. Seeing this information directly on your chart is the real game-changer and breakthrough solut
IX Power MT5
Daniel Stein
4.17 (6)
IX Power   finally brings the unbeatable precision of FX Power to all your trading symbols. It accurately determines the intensity of short, medium and long-term trends in your favourite indices, stocks, commodities, ETFs, and even cryptocurrencies. You can   analyse everything   your terminal has to offer. Try it out and experience how   your timing improves significantly   when trading. Read about our latest strategic development -  Easy scalping with IX Power Visit our all-new   Stein Inve
Advanced Supply Demand MT5
Bernhard Schweigert
4.5 (14)
Best Solution for any Newbie or Expert Trader! This indicator is a unique, high quality and affordable trading tool because we have incorporated a number of proprietary features and a new formula. With this update, you will be able to show double timeframe zones. You will not only be able to show a higher TF but to show both, the chart TF, PLUS the higher TF: SHOWING NESTED ZONES. All Supply Demand traders will love it. :) Important Information Revealed Maximize the potential of Advanced Suppl
** All Symbols x All Timeframes scan just by pressing scanner button ** *** Contact me  to send you instruction and add you in "123 scanner group" for sharing or seeing experiences with other users. After 17 years of experience in the markets and programming, Winner indicator is ready. I would like to share with you! Introduction The 123 Pattern Scanner indicator with a special enhanced algorithm is a very repetitive common pattern finder with a high success rate . Interestingly, this Winner in
Auto Order Block with break of structure based on ICT and Smart Money Concepts (SMC) Futures Break of Structure ( BoS )             Order block ( OB )            Higher time frame Order block / Point of Interest ( POI )    shown on current chart           Fair value Gap ( FVG ) / Imbalance   -  MTF      ( Multi Time Frame )    HH/LL/HL/LH  -  MTF      ( Multi Time Frame )  Choch  MTF      ( Multi Time Frame )  Volume Imbalance     ,  MTF          vIMB Gap’s Power of 3 Equal High
ICT, SMC, SMART MONEY CONCEPTS, SMART MONEY, Smart Money Concept, Support and Resistance, Trend Analysis, Price Action, Market Structure, Order Blocks, BOS/CHoCH,   Breaker Blocks ,  Momentum Shift,   Supply&Demand Zone/Order Blocks , Strong Imbalance, HH/LL/HL/LH,    Fair Value Gap, FVG, Invert FVG, IFVG,  Premium  &   Discount   Zones, Fibonacci Retracement, OTE, Buy Side Liquidity, Sell Side Liquidity, BSL/SSL Taken, Equal Highs & Lows, MTF Dashboard, Multiple Time Frame, BigBar, HTF OB, HTF
FxaccurateLS
Shiv Raj Kumawat
WHY IS OUR FXACCCURATE LS MT5 THE PROFITABLE ? PROTECT YOUR CAPITAL WITH RISK MANAGEMENT Gives entry, stop and target levels from time to time. It finds Trading opportunities by analyzing what the price is doing during established trends. POWERFUL INDICATOR FOR A RELIABLE STRATEGIES We have made these indicators with a lot of years of hard work. It is made at a very advanced level. Established trends provide dozens of trading opportunities, but most trend indicators completely ignore them!
Matrix Arrow Indicator MT5
Juvenille Emperor Limited
5 (12)
Matrix Arrow Indicator MT5  is a unique 10 in 1 trend following   100% non-repainting  multi-timeframe indicator that can be used on all symbols/instruments:   forex,   commodities,   cryptocurrencies,   indices,   stocks .  Matrix Arrow Indicator MT5  will determine the current trend at its early stages, gathering information and data from up to 10 standard indicators, which are: Average Directional Movement Index (ADX) Commodity Channel Index (CCI) Classic Heiken Ashi candles Moving Aver
How many times have you bought a trading indicator with great back-tests, live account performance proof with fantastic numbers and stats all over the place but after using it, you end up blowing your account? You shouldn't trust a signal by itself, you need to know why it appeared in the first place, and that's what RelicusRoad Pro does best! User Manual + Strategies + Training Videos + Private Group with VIP Access + Mobile Version Available A New Way To Look At The Market RelicusRoad is
Was: $249  Now: $99   Market Profile defines a number of day types that can help the trader to determine market behaviour. A key feature is the Value Area, representing the range of price action where 70% of trading took place. Understanding the Value Area can give traders valuable insight into market direction and establish the higher odds trade. It is an excellent addition to any system you may be using. Inspired by Jim Dalton’s book “Mind Over Markets”, this indicator is designed to suit the
This dashboard shows the latest available   harmonic patterns   for the selected symbols, so you will save time and be more efficient /   MT4 version . Free Indicator:   Basic Harmonic Pattern Comparison of "Basic Harmonic Pattern" vs. "Basic Harmonic Patterns Dashboard" Indicators Feature Basic Harmonic Pattern Basic Harmonic Patterns Dashboard Functionality Detects and displays harmonic patterns on a single chart Searches multiple symbols and timeframes for harmonic patterns, displays
AW Trend Predictor MT5
AW Trading Software Limited
4.75 (51)
The combination of trend and breakdown levels in one system. An advanced indicator algorithm filters market noise, determines the trend, entry points, as well as possible exit levels. Indicator signals are recorded in a statistical module, which allows you to select the most suitable tools, showing the effectiveness of the signal history. The indicator calculates Take Profit and Stop Loss marks. Manual and instruction ->  HERE  / MT4 version ->  HERE How to trade with the indicator:  Trading wit
Profit from market structure changes as price reverses and pulls back. The market structure reversal alert indicator identifies when a trend or price move is approaching exhaustion and ready to reverse. It alerts you to changes in market structure which typically occur when a reversal or major pullback are about to happen. The indicator identifies breakouts and price momentum initially, every time a new high or low is formed near a possible exhaustion point. The indicator draws in a rectangle on
First of all Its worth emphasizing here that this Trading Tool is Non Repainting , Non Redrawing and Non Lagging Indicator , Which makes it ideal for professional trading . Online course, user manual and demo. The Smart Price Action Concepts Indicator is a very powerful tool for both new and experienced traders . It packs more than 20 useful indicators into one , combining advanced trading ideas like Inner Circle Trader Analysis and Smart Money Concepts Trading Strategies . This indicator focus
TPA True Price Action indicator reveals the true price action of the market makers through 100% non-repainting signals strictly at the close of a candle! TPA shows entries and re-entries, every time the bulls are definitely stronger than the bears and vice versa. Not to confuse with red/green candles. The shift of power gets confirmed at the earliest stage and is ONE exit strategy of several. There are available now two free parts of the TPA User Guide for our customers. The first "The Basics"
Unlock hidden profits: accurate divergence trading for all markets Special Offer: Purchase now to receive free bonuses worth $90! (Read more for details) Tricky to find and scarce in frequency, divergences are one of the most reliable trading scenarios. This indicator finds and scans for regular and hidden divergences automatically using your favourite oscillator. [ Installation Guide | Update Guide | Troubleshooting | FAQ | All Products ] Easy to trade Finds regular and hidden divergences S
Easy By Sell is a market indicator for opening and closing positions. It becomes easy to track market entries with alerts. It indicates trend reversal points when a price reaches extreme values ​​and the most favorable time to enter the market. it is as effective as a Fibonacci to find a level but it uses different tools such as an algorithm based on ATR indicators and Stochastic Oscillator. You can modify these two parameters as you wish to adapt the settings to the desired period. My othe
Volume Order Blocks MT5
Suvashish Halder
5 (6)
Introducing the Volume Order Blocks indicator, a game-changing tool designed for traders who demand precision and clarity in their market analysis. This advanced indicator not only identifies order blocks but also integrates crucial volumetric data, allowing you to gauge the strength of these blocks with unparalleled accuracy. MT4 version -  https://www.mql5.com/en/market/product/121237/ Key Features of the Volume Order Blocks: Bullish & Bearish Order Blocks: Easily visualize and differentiat
FX Trend MT5
Daniel Stein
4.63 (32)
Visit our all-new   Stein Investments Welcome Page   to get the latest information, updates and trading strategies. Do you want to become a constantly profitable 5-star forex trader? Then  get our Stein Investments trading tools  and send us a screenshot to get your personal invitation to our exclusive trading chat with 500+ members. FX Trend displays the trend direction, duration, intensity and the resulting trend rating for all time frames in real time. You'll see at a glance at which dire
The Price Action Finder Multi indicator is an indicator of entry points that searches for and displays Price Action system patterns on dozens of trading instruments and on all standard time frames: (m1, m5, m15, m30, H1, H4, D1, Wk, Mn). The indicator places the found patterns in a table at the bottom of the screen. By clicking on the pattern names in the table, you can move to the chart where this pattern is located. Manual (Be sure to read before purchasing) | Version for MT4 Advantages 1. Pa
Blahtech Supply Demand MT5
Blahtech Limited
4.54 (13)
Was: $299  Now: $99   Supply Demand uses previous price action to identify potential imbalances between buyers and sellers. The key is to identify the better odds zones, not just the untouched ones. Blahtech Supply Demand indicator delivers functionality previously unavailable on any trading platform. This 4-in-1 indicator not only highlights the higher probability zones using a multi-criteria strength engine, but also combines it with multi-timeframe trend analysis, previously confirmed swings
More from author
This library will allow you to manage trades using any of your EA and its very easy to integrate on any EA which you can do yourself with the script code which is mentioned in description and also demo examples on video which shows the complete process. This product allows trading operations via API For chart : Renting Crypto Charting for OHLC data or Crypto Ticks with Order Book Depth is optional If your EA is HFT and operations on seconds chart, You may be interested in converting charts to se
This indicator finds Double Top and Double bottom Example : What is Double Top When price establishes a new high and then falls, then reverse to the same candle area of High then its considered a valid double top and vice versa for double bottom. 1. It plots and high and low on visible chart if ChartChange is set to true else it searches on new bar opening 2. If there is double top and double bottom found in visible chart window then it plots a line 3. It has options to customize text color, te
FREE
Binance Trading Tool for MT5 1. This product include live chart from websocket, historical chart, automatic updates on restart of mt5 terminal to make it run smooth with zero manual intervention that makes you experience to trade Binance smoothly. Trading, Live chart & Historical Data available for Spot and Futures How to use : 1. You need to add your API key and secret in Input field of this utility. When you create your API, make sure you enable Futures to trade Futures 3.  You
This indicator plots upto 6 levels which can be enable / disable to make chart cleaner as per trader's requirement These 6 levels are in 2 sets : High and Low For each sets, different timeframe can be selected It is based on strategy of Previous High Low reversal, as its considered that price usually show rejection in smaller timeframe like 5min when price reach Daily, Weekly or Monthly High Low Features : - Track upto 6 Timeframe High Lows in single chart - Set alerts on these levels, Mail, Pus
Real Spinning Top Indicator  It detects accurate spinning top on chart with balanced body and wick height ratio which is the true meaning of spinning top which differs it from Hammers and Doji or Null Candlestick. This indicator plots an wingdings icon at number of spinning tops found on the chart. Settings include Number of Bars : To adjust search on number of bars Color of Icon :change color of icon Icon code : change code of wingdings for icon
FREE
Higher Time Frame Bars
Rajesh Kumar Nait
5 (1)
This indicator efficiently tracks any other timeframe candlesticks which you want to track on same chart 1. Select any higher time frame to load bars on same chart 2. Customize colors, width, background and style of candlesticks and wick width 3. Choose number of bars to draw candlesticks 4. Track higher timeframe complete candles along with wick and body 5. Easy and convenient for those who dont want to switch chart. 6. See candle range { high - low } and change color, font, size 7. Enable / D
Perfect Seconds chart indicator allows you to convert minute candles of live data into seconds 1. Choose any number of seconds to close a bar 100% with accurate time. 2. This is Live OHLC rates based data, It works even if ticks are not available. 3. No external DLL required, it works smoothly on VPS 4. Fast and optimized code 5. Supports Crypto Pairs such as BInance, Kucoin and all other exchanges where Futures live chart can be converted into seconds easily. 6. Support all type of symbols such
Crypto Ticks and Depth
Rajesh Kumar Nait
5 (1)
Cryptocurrency Live Tick Data Bid and Ask and Book Depth for EA Available Exchange : 1. Binance Spot (Supports Order Book Depth on active chart window) realtime Tick Data and Futures (Supports multiple Order Book Depth ) realtime Tick Data 2. Kucoin Spot and Futures, Supports Order Book depth on active chart window 3. Bybit Futures and Inverse Futures Tick Data Bid Ask Last Upcoming Exchange : OKX, MEXC and more.. Features : 1. Live Tick Data with Bid and Ask info 2.  Best Bid ask and quantit
Crypto Charting
Rajesh Kumar Nait
5 (2)
Cryptocurrency Charts for MT5. Features : 1. Live OHLC Chart via Websocket (wss) 2. Update History of Bars from API. Available Mark Price, Index Price and Last price options in Binance Exchange 3. Auto Update history on charts when MT5 is restarted to make sure there is no missing data in Bars and is always kept up to dated like native chart 4. Scheduled History update from API : In case of there is internet disconnection for a millisecond, bar ohlc value may be incorrect as websocket is strea
Multi Symbol Double Click anywhere on chart to set price alert for MT4 and get notified from Terminal Alert or Push Notification 1. Add the EA Utility on chart 2. Browse chart by <- left or -> right arrow keys 3. Double click anywhere on chart and it will add a line, drag this line to set your desired price and voila, alert is set! When price will reach to the line it will notify you with either terminal or push notification as per utility's settings.  This alert will keep working even if you r
This indicator plots upto 6 levels which can be enable / disable to make chart cleaner as per trader's requirement You can get alerts on Previous Week Previous Day, Previous Month or high low of any period previous candle available in MT4 These 6 levels are in 2 sets : High and Low For each sets, different time frame can be selected It is based on strategy of Previous High Low reversal, as its considered that price usually show rejection in smaller timeframe like 5min when price reach Daily, W
Cobra Pivot Points is an indicator for plotting best optimized pivot points support and resistance levels which you can backtest yourself by downloading the DEMO. 1. Select 7 type of Pivot Mode : Cobra, Camarilla 1, Camarilla 2, Floor, Woodie, Demark and Fibonacci pivots 2. You can use any time frame to find pivot points support and resistance 3. You can play with Previous day High Low Close value with Shift parameter. 1 = Previous Bar, 2 = Bar before Previous bar and so on.. These parameter w
Multi Currency Previous Candle or Previous Bar Scanner helps you scan multi symbol charts with any custom timeframe which you select from indicator settings. Based on product : https://www.mql5.com/en/market/product/110229 It can be used to scan multi symbols for Previous Day high low, Previous week high low, Previous month High low or any custom timeframe e.g. Previous 4 hour chart high low It filters noise and gives directional alerts when price touches High or low line  The strategy is sim
Pivot Points Multi Symbol Scanner scans all symbols available in marketwatch for Floor, Woodie, Camarilla, Demark or Fibonacci Pivot Points. You can select any timeframe to calculate pivot points and get alerts when price touch these levels of support and resistance. For visual Pivot Points You may be interested in this product : https://www.mql5.com/en/market/product/110231 It has options for choosing various alerts type You can choose and set frequency to scan in milliseconds 1000 me
This library will allow you to manage trades using any of your EA and its very easy to integrate on any EA which you can do yourself with the script code which is mentioned in description and also demo examples on video which shows the complete process. This product allows trading operations via API and does not include charts. Users may use charts from brokers who provides Crypto and send orders to binance - Supports One way and Hedge Mode - Place Limit, SL Limit and Take Profit Limit Orders -
Crypto to MT5
Rajesh Kumar Nait
Crypto.com to MT5 Live Candlestick Stream to Metatrader 5 from Crypto.com websocket Its a OHCLV (Open High Low Close Real Volume ) Live Rates Data you can check my other crypto product on my profile  https://www.mql5.com/en/users/rajeshnait/seller 1. OHLCV Data 2. Supports and Creates Multiple Symbols 3. You need to add Crypto.com websocket and api URL as mentioned at Tools > Options > Allow Webrequest from URL tab and also tick Allow Webrequest checkbox - Websocket URL : stream.crypto.com - API
Patterns Explorer for Triangle pattern such as symmetrical triangle, asymmetrical triangle or right angle triangle , Wedge pattern such as Rising wedge or Falling wedge, Expansion pattern and Trend Channel This indicator explores historical pattern as well as current patterns, It is the best indicator for those who are trying to save time from manually drawing trendline or triangle and want to use this for automated analysis of plotting best patterns on chart Features : - Panel for changing ZigZ
Kraken Crypto Exchange Futures History Update Panel Features : 1.  It will create symbol based on setting and update history fully which is available from Kraken API for the symbol. This panel updates history on Kraken Futures symbols with Open High Low Close data, It also Prints message when History Update is complete. Please note this is not LIVE Data.   3.  You need to add Kraken API URL as mentioned at Tools > Options > Allow Webrequest from URL tab and also tick Allow Webrequest checkbox
5 EMA Scalping Strategy Multi Symbol Scanner This EA utility will scan all symbols which are selected in marketwatch and alert when such condition is formed in chart when Candle low is above EMA 5 for Sell alert and Candle high is lower from EMA5 so you can be ready before selling or buying for scalping purpose on 5min chart For more details watch attached video Logic : When a candle closes above 5 EMA in 5 mins chart, Wait for its low to break and Sell when low is broken by wick, Your SL sh
Multi Symbol ZigZag Breakout Scanner scans all symbols selected in marketwatch. It will help finding double top, double bottom or any fibonacci extension level easily when price is about to reach those levels. You can select Timeframe, and multiple Extdepths (up to 3) of Zigzag. Recommended ZigZag are 21,34 and 55 which covers all types of Zigzag and filter noise You can set to receive either terminal alert or push notification or both Use cases : 1. To find Break of structure of order blocks
Market structures are the one which when breakout in higher timeframe may help clears a trend to a trader. 1. This indicator will draw ZigZag to only last 2 structures (previous high and low of ZigZag ) and a new bar of ZigZag will be only formed when break of structure happens 2. It gives Terminal and Push notificationon break of structure 3. Increase and Decrease Extdepth of ZigZag from "[" and "]" keys to adjust swing 4. Change colors of Line AB BC and CD 5. Add to many charts and get alerts
Fibo Musang FMBCR CB1 breakout multi symbol scanner for MT5 scans all symbols selected in marketwatch for dominan break Fibo Musang CB1 or Candle Break 1 is a strategy that works very well on Gold XAUUSD and other forex symbols. This scanner will help you scan mulltisymbol currencies very fast and get alerts on FMCBR CB1 breakout Please see video for more details as its completely customizable as per trader's preference: 1. You can select timeframe and History of Bars 2. You can modify your
Multi Symbol Double Click anywhere on chart to set price alert and get notified from Terminal Alert or Push Notification 1. Add the EA Utility on chart 2. Browse chart by <- left or -> right arrow keys 3. Double click anywhere on chart and it will add a line, drag this line to set your desired price and voila, alert is set! When price will reach to the line it will notify you with either terminal or push notification as per utility's settings.  This alert will keep working even if you restart te
Control Candle is the candlestick which holds multiple inside bars and are in control until its high low range is broken by close of any candlestick. When control candle is broken, price may act on these control candle as support and resistance. This indicator create rectangles on chart which will help you find control candles fast. Control candle indicator box is customizable by color, style, width and other options in indicator settings.
Cobra Levels
Rajesh Kumar Nait
Introducing Cobra Levels Watch the Tutorial video of backtest and accuracy : here This strategy is based on the concept that prices will revert to their mean or average value over time. Identify the mean price : Calculate the levels e.g. U4 U5 or D4 D5 Wait for the price to move away from the mean (Middle Line) before taking action. Buy and sell signals : Buy : When the price falls below the lower threshold. Sell : When the price rises above the upper threshold. These are 6 sets of lev
This indicator allows you to show fibonacci levels labels with big font size . It supports up to 25 fibonacci levels - As soon as you draw fibonacci it shows the levels you added as input parameter with big font size with the color and font you choose. Customizable options : 1. Fibo Text Font 2. Fibo Text Size 3. Fibo Text Color 3. Add description to each level 4. Other options such as Anchors and Degrees
Cobra Pivot Points is an indicator for plotting best optimized pivot points support and resistance levels which you can backtest yourself by downloading the DEMO. 1. Select 7 type of Pivot Mode : Cobra, Camarilla 1, Camarilla 2, Floor, Woodie, Demark and Fibonacci pivots 2. You can use any time frame to find pivot points support and resistance 3. You can play with Previous day High Low Close value with Shift parameter. 1 = Previous Bar, 2 = Bar before Previous bar and so on.. These parameter w
Multi Currency Previous Candle or Previous Bar Scanner helps you scan multi symbol charts with any custom timeframe which you select from indicator settings. Based on product : https://www.mql5.com/en/market/product/78657 It can be used to scan multi symbols for Previous Day high low, Previous week high low, Previous month High low or any custom timeframe e.g. Previous 4 hour chart high low It filters noise and gives directional alerts when price touches High or low line  The strategy is simp
Pivot Points Multi Symbol Scanner scans all symbols available in marketwatch for Floor, Woodie, Camarilla, Demark or Fibonacci Pivot Points. You can select any timeframe to calculate pivot points and get alerts when price touch these levels of support and resistance. For visual Pivot Points You may be interested in this product : https://www.mql5.com/en/market/product/110072 It has options for choosing various alerts type You can choose and set frequency to scan in milliseconds 1000 me
Easy Fibonacci
Rajesh Kumar Nait
Easy Fibonacci is an indicator for MT5 which allows you to plot fibonacci retracement easily Features 1. up to 10 fibo levels can be set from indicator settings 2. Each level may have different line style, line color, line width and other settings customizable 3. You can use Mouse with Extra buttons to map V and B keys and conveniently plot fibonacci Button Actiions : B and V : Plot Top / Bottom fibonacci on visible area of chart N and M : Next and Previous Candles swing extensions R : Reset
Filter:
No reviews
Reply to review
Version 1.1 2022.03.03
Added new features :
- Enable / Disable alerts on upper, lower or middle line
- Add pause after a alert
- Pause Trend channel with button on chart
- Add early alerts by adding points in input field
- Enable / Disable Directional touches