• Overview
  • Reviews
  • Comments

Range Exhaustion

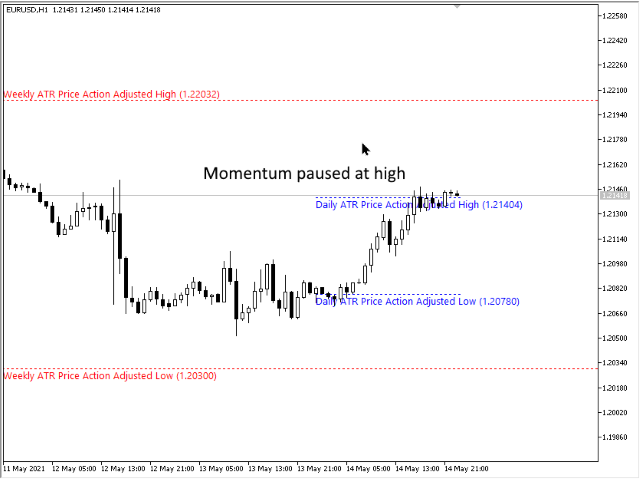
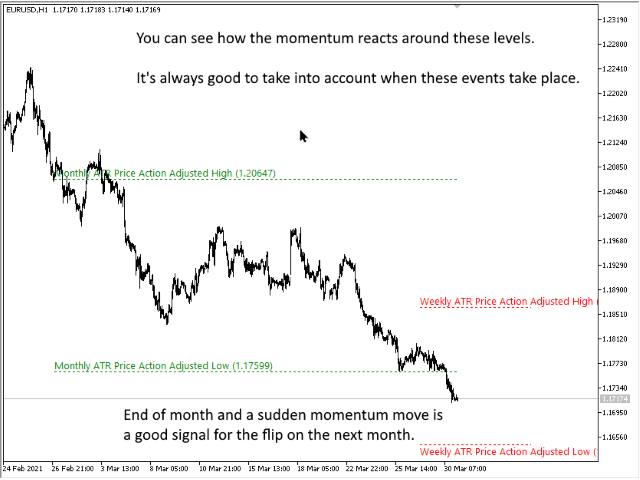
Range Exhaustion occurs when price meets or exceeds the expected range for the current period. At these levels, price starts to lose its momentum relative to earlier in the period, so its a good point to make sure you are not taking new positions.

This indicator will show you where this is likely to happen on your chart, showing levels for Daily, Weekly and Monthly periods.

When you see price exceeding these exhaustion levels, it's telling you that the momentum behind the move is very strong and likely heading for the higher timeframe level.

The indicator can use the Average True Range (ATR) or the Average Range (ADR) calculation, depending on your preferences. By default we use ATR as we find it works better on Forex charts, but ADR does have the edge on Stock based indices and symbols.

The indicator has a number of drawing modes, described below, that allow you to tailor it to your needs.


SETTINGS

CalculationMode

Choose from AverageTrueRange (ATR) or AverageDailyRange (ADR) for calculating the levels.

DrawingMode

The indicator can display in different ways.

 - Draw Price Adjusted Line - The level adjusts through the period, based on Highs and Lows reached. This is the default and most commonly used method.

 - Draw Expected Maximum - The level is a fixed value, being the last period close plus or minus the ATR or ADR value.

 - Draw Both Lines - Shows both the above lines.

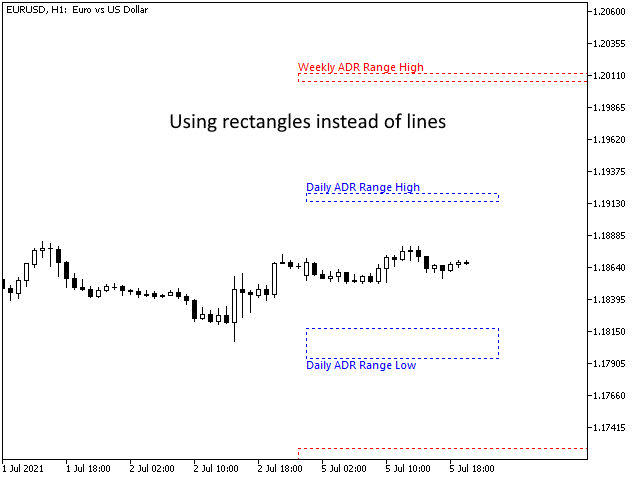
 - Draw Rectangles - Shows a single rectangle where the top and bottom lines are the Price Adjusted and Expected Max/Min


ReviewPeriod

The period to use when calculating the ATR/ADR values.


ShowDailyLimits

When true, draws the Daily exhaustion levels.

ShowWeeklyLimits

When true, draws the Weekly exhaustion levels.

ShowMonthlyLimits

When true, draws the Monthly exhaustion levels.


ShowDescriptions

When true, draws descriptive labels for the levels. If false, just the line is drawn, but the lines have tooltips should you need to know what they represent.

ShowPriceInDescription

When true, the level value will be added to the description and tooltip.

DescriptionFontSize

Font size to use when drawing descriptions


ExtendLines

When true, instead of drawing the lines to the end of the period, the lines extend to the right of the chart indefinately.


The following settings appear for each time period, D1, W1 and MN1

XX_Colour

The colour to use when drawing the lines and description

XX_LineWidth

The width of line to draw. If the LineStyle is anything but Solid, this value is ignored. Only solid lines can have a width on MetaTrader.

XX_LineStyle

The type of line to draw from the standard selection.


Recommended products
This indicator is stand alone version from  MP Pivot Levels  (All in one) containing Demark's Pivots. Calculations:     PP = X / 4     R1 = X / 2 - LOWprev     S1 = X / 2 - HIGHprev Uses: When the pair currency price may change the direction of movement. Possible constraints of support and resistance that creates plateaus for the currency pair prices. Tendency identification by comparing the present prices according to current day's pivot point and also the prior day's pivot points. ___________
FREE
High Volume Turns
Nesimeye Oswald
4.7 (10)
Most of the time, market reversals / pull backs usually follow volume and price spikes thus  these spikes could be the first indication of an exhaustion and possible reversal/pullback. High volume Turns is an indicator that scans the market for price and volume spikes around over-bought/over-sold market conditions. These spikes when spotted serves as the first indication of reversal/pullback. Note :  Though it seems ok now but this is a system that is still under development. We have made it p
FREE
This indicator is based on Mr. Mark Fisher's ACD strategy, based on the book "The Logical Trader." - OR lines - A lines - C lines - Daily pivot range - N days pivot range - Customizable trading session - Drawing OR with the desired time Drawing levels A and C based on daily ATR or constant number - Possibility to display daily and last day pivots in color zone - Displaying the status of daily PMAs (layer 4) in the corner of the chart - Show the order of daily pivot placement with multi-day
FREE
Jerk Indicator
Safwan Rushdi Khalil Arekat
In physics, "Jerk" is the third time-derivative of position, with acceleration being the second derivative and velocity the first derivative. In technical analysis, the first derivative of price is the price momentum, with the second derivative,acceleration, being seldom used and the third derivative virtually unknown. The magnitude frequency response of a digital differentiator is a positive-slope straight line passing through zero frequency. Therefore, every instance of a digital signal differ
FREE
Индикатор реализован для определения классического канала движения цены, который используется на крупных биржевых площадках. Не перерисовывается Синий уровень - это уровень поддержки  Красный уровень - это уровень сопротивления  Белый уровень - является Pivot-уровнем  Настройки Period_SEC  - ввод  значения периода . Примечание:  Индикатор определяет уровни только на пятизначных котировках! Метод торговли:  Открытие позиций осуществляется от уровней , именно на их значениях происходит отскок цены
FREE
Rainbow MT4
Jamal El Alama
Rainbow MT4 is a technical indicator based on Moving average with period 34 and very easy to use. When price crosses above MA and MA changes color to green, it’s a signal to buy. When price crosses below MA and MA changes color to red, it’s a signal to sell. The Expert advisor ( Rainbow EA MT4) based on Rainbow MT4 indicator, as you can see in the short video below is now available here .
FREE
Email Drawdown Alert
Roman Starostin
5 (14)
Free informative Indicator-helper. It'll be usefull for traders who trade many symbols or using grid systems (Averaging or Martingale). Indicator counts drawdown as percent and currency separate. It has a number of settings: Count deposite drawdown according equity value and send e-mail or notifications to user if DD more than set; Sending e-mail when max open orders reached; Shows price and remaining pips amount before MarginCall on current chart and Account generally; Display summary trade lot
FREE
This free version can only be used for GBPUSD M15 chart . To use on all time frames and pairs , Get Pro Version The swing continuation pattern happens in a trend direction after a short reversal / pull back . As the name suggests , these patterns occurs along the swing high and swing lows of a trend , this makes the patterns very low risk patterns with potential high rewards . The swing continuation indicator also combines Currency Meter as a filter for its execution. The idea is to go with
FREE
BeST_ Classic Pivot Points is an MT4 Indicator that is based on the widely known and definitely classic Pivot Point of a market prices activity. A pivot point is calculated as an average of significant prices (high,low,close) from the performance of a market in the prior trading period. If the market in the following period trades above the pivot point it is usually evaluated as a bullish sentiment, whereas trading below the pivot point is seen as bearish. A pivot point and the associated suppo
FREE
Pivot Points MT4
KEENBASE SOFTWARE SOLUTIONS
KT Pivot Points automatically plots the daily, weekly, and monthly pivot levels on a chart with the precise calculation based on the latest data. Pivot points is a widely used indicator in technical analysis, particularly in the Forex market. Features Send alerts when the price touches the pivot level.  It offers complete customization for each kind of pivot level.   Shows daily, weekly, and monthly pivot levels without any fuss. It uses minimum CPU resources for faster calculation. Compati
30 USD
Trend arrow Indicator
NGUYEN NGHIEM DUY
3.29 (14)
Trend arrow Indicator is an arrow Indicator used as an assistant tool for your trading strategy. The indicator analyzes the standard deviation of bar close for a given period and generates a buy or sell signals if the deviation increases. It good to combo with Martingale EA to follow Trend and Sellect Buy Only/Sell Only for EA work Semi-Automatic. You can use this  Indicator with any EAs in my Products.
FREE
The indicator allows you to trade binary options. The recommended time frame is М1 and the expiration time is 1 minutes. The indicator suitable for auto and manual trading. A possible signal is specified as a arrows above/under a candle. You should wait until the candle closes! Arrows are not re-painted Trade sessions: London and New York section Currency pairs: AUD/CAD Working time frame: M1 Expiration time: 1 minute The indicator also shows good results when using the martingale strategy - "Ma
FREE
Free and limited version (   only one alert ) of the popular X-Lines indicator. X-Lines 2.0 Pro I want to present for your attention a new and completely updated and expanded version of X-Lines indicator. Version 2.0 Pro has many new features and can make your analysis more productive. Please read full instructions   here . Purchasing full version   here . 1)   Multi-timeframe settings and user-friendly control panel. You can dynamically select and save indicator settings not only for each c
FREE
Here is the most unpretentious indicator to use, but one of the most useful. It signals the near reversal of the growing volatility. It is volatility that gives income to the trader. The indicator is especially useful for those who do not want to wait for the right moment in front of the monitor. The indicator is installed on the charts M15 and M30. According to the observations on these timeframes, it best fixes the approach of wide price waves. Well-established on the USDZAR currency pair (Att
FREE
Indicator support for only: Entry Point to Trend Pro Link indicator  support   :   https://www.mql5.com/en/market/product/70867 Supports all currency pairs declared in the definition. Help investors do not need to open many charts. Notice the DEAL:  multiple time frames confluence   M15, H1, H4. Entry Point to Trend Pro The indicator helps investors to identify the earliest and perfect reversal point. Easy to make decision to trade with the trend   Price action trading. support resistance
FREE
MT Scanner
Nirav Patel
4 (3)
This indicator helps you to Scan symbols which are in the Market Watch Window  and filter out trends with alerts. It works based on the effective indicator "SUPERTREND" which is used by many traders for trading: When box color changes to " Green " or " Red " color, it indicates you for trend change for long and short entry. And also you will get alerted on screen. When it changes to " Green ", it indicates you that trend is going upwards, and you can take the long entry. If the color changes to
FREE
Forex trading support timer: - This is an indicator that supports a trader's trading process. - Before placing a BUY or SELL order, it is advisable to observe what the current time is like, to get the best position when trading. Function of indicator: - Display information about candle closing time of different timeframes (M1,M5,M15,H1), best used when Scalping. - Show market spreads. - Show TimeZone Trading. - Displays the remaining time of a session.
FREE
This indicator is stand alone version from  MP Pivot Levels  (All in one) containing Woodie Pivots. Woodie’s pivot points are made up of multiple key levels, calculated from past price points, in order to frame trades in a simplistic manner. The key levels include the ‘pivot’ itself, and multiple support and resistance levels (usually up to three each). Traders use these levels as a guide for future price movements when setting up trades. The pivot : (Previous high + previous low + 2 x previou
FREE
Sweet VWAP
Francisco Gomes Da Silva
Discover where large institutions are trading and optimize your investments with the Free Anchored VWAP Indicator for MetaTrader 4. Find out the price where large institutions are making trades with our Free Anchored VWAP Indicator for MetaTrader 4! Now you can save your valuable time by automating the plotting of your anchored VWAPs at market tops and bottoms. Our free version allows you to easily view the VWAP in real-time by following the mouse pointer on the chart. With this, you can instant
FREE
Harmonic Pattern Limited
Reza Aghajanpour
4.75 (4)
You can download the Full version with more features  here . Introduction Harmonic Patterns are best used to predict turning point. Harmonic Patterns give you high win rate and high opportunities for trade in during one day. This indicator detects the best and successful patterns base on Harmonic Trading books by Mr. Scott M.. Main Features Detect the best and   most successful patterns : Gartley, Bat, Crab, Butterfly, Cypher, Shark, Alt_Bat, Deep_Crab Easy-to-use and user friendly indicator Sc
FREE
SR indicator
Alexander Chertnik
SR is a support and resistance indicator, it shows major highs and lows by different colors. The color of a level is changing if the last high or low are touching it. After the closing of a bar above or below level, it will delete it. extern inputs: loop for candles / colors / drawing time *This indicator signal is not perfect and have to be used with other market analysis and confirmations.
FREE
Ska ZigZag Line
NKATEKO VUKOSI LEROY MASANGO
Ska ZigZag Line indicator determines the overbought and oversold regions within a trend. The indicator determines the overbought region by the candlestick high and the oversold region by the candlestick low in a form of a line. To utilize the full strategy i recommend using "Ska ZigZag Line" together with "Ska ZigZag BuySell". NOTE: This indicator is a line based indicator. HOW TO USE: Sell Signal; Place a sell trade when the Ska ZigZag BuySell indicator arrow appear on top of the Ska ZigZag Lin
FREE
Are you tired of drawing trendlines every time you're analyzing charts? Or perhaps you would like more consistency in your technical analysis. Then this is for you. This indicator will draw trend lines automatically when dropped on a chart. How it works Works similar to standard deviation channel found on mt4 and mt5. It has 2 parameters: 1. Starting Bar 2. Number of bars for calculation The   starting bar   is the bar which drawing of the trend lines will begin, while the   number of bars for c
FREE
EZ Binary GBUS
Tuan Anh Dao
4 (1)
The indicator allows you to trade binary options. The recommended time frame is М1 and the expiration time is 1 minute. The indicator suitable for auto and manual trading. A possible signal is specified as a arrows above/under a candle. You should wait until the candle closes! Arrows are not re-painted Trade sessions: LONDON and NEWYORK section Currency pairs: GRB/USD Working time frame: M1 Expiration time: 1 minute. The indicator also shows good results when using the martingale strategy - "Mar
FREE
High Pass Filter Trading Signal
Safwan Rushdi Khalil Arekat
Latest Changes in 1.5 :  Added Signal Modes input. Mode 1 : HPF positive go long blue, HPF negative go short red. Mode 2 : slow envelope only, HPF above upper envelope go long blue, HPF below lower envelope go short red. Mode 3 : HPF above both upper envelopes - go long blue, HPF below both lower envelopes go short red. Mode 4 : Go long blue if HPF crosses above upper slow, but fast upper should be below slow upper at the time, exit when HPF crosses below upper fast, reverse logic for short re
FREE
Awesome Oscillator by Bill Williams with the ability to fine-tune and replace the averaging algorithms of the indicator, which significantly expands the possibilities of using this oscillator in algorithmic trading and brings it closer in its properties to such an indicator as the MACD. To reduce price noise, the final indicator is processed with an additional Smooth averaging. The indicator has the ability to give alerts, send mail messages and push signals when the direction of movement of th
40 USD
This indicator scans for you up to 30 trading instruments and up to 8 timeframes for occurrences of the high probability reversal patterns: Double Tops/Bottoms with fake breakouts . Please read also the blog post " Professional Trading With Double Tops/Bottoms And Divergences! " which explains the concepts behind the ULTIMATE Double Top/Bottom indicator and how you can use a professional top-down approach. This FREE Version of the Scanner scans only EURUSD and GBPUSD. The full version of the sca
FREE
The Icarus Reversals(TM) FREE Indicator is a powerful tool to identify high-probability reversal points, across all instruments.  The Reversals Indicator provides traders and investors with a simple-to-use and highly dynamic insight into points of likely price-action reversals.  Generated by a unique proprietary code-set, the Reversals Indicator (FREE version) generates long and short trade signals, which can be customised for key inputs and colourisation. Settings of the Icarus Reversals FREE h
FREE
Long Waiting MT4
Aleksandr Davydov
5 (1)
Expert description Algorithm optimized for Nasdaq trading The Expert Advisor is based on the constant maintenance of long positions with daily profit taking, if there is any, and temporary interruption of work during the implementation of prolonged corrections The Expert Advisor's trading principle is based on the historical volatility of the traded asset. The values of the Correction Size (InpMaxMinusForMarginCallShort) and Maximum Fall (InpMaxMinusForMarginCallLong) are set manually. Recom
FREE
You can download the Full version   here . Introduction: Head and Shoulders   Pattern  is a very repetitive common type of price reversal patterns.   The pattern appears on all time frames and can be used by all types of traders and investors.   The Head & Shoulders Scanner indicator  has stop loss, take profits and entry point levels  with   using Fibonacci levels and candlestick checking  to find the best entry point and exit of trading. It finds signals immediately with alarm and notification
FREE
Buyers of this product also purchase
RelicusRoad Pro
Relicus LLC
4.94 (100)
How many times have you bought a trading indicator with great back-tests, live account performance proof with fantastic numbers and stats all over the place but after using it on your account, you end up blowing your account? You shouldn't trust a signal by itself, you need to know why it appeared in the first place, and that's where RelicusRoad Indicator comes in to save the day. NOW $147 ($602 DISCOUNT) - UNLIMITED ACCOUNTS (5 PCs LICENSE) - PRICE WILL INCREASE TO $749 SOON User Manual + Str
147 USD
CURRENTLY 26% OFF Best Solution for any Newbie or Expert Trader! This Indicator is a unique, high quality and affordable trading tool because we have incorporated a number of proprietary features and a new formula. With only ONE chart you can read Currency Strength for 28 Forex pairs! Imagine how your trading will improve because you are able to pinpoint the exact trigger point of a new trend or scalping opportunity? User manual: click here That's the first one, the original! Don't buy a worthle
148 USD
Advanced Supply Demand
Bernhard Schweigert
4.93 (293)
CURRENTLY 26% OFF !! Best Solution for any Newbie or Expert Trader! This indicator is a unique, high quality and affordable trading tool because we have incorporated a number of proprietary features and a new formula. With this update, you will be able to show double timeframe zones. You will not only be able to show a higher TF but to show both, the chart TF, PLUS the higher TF: SHOWING NESTED ZONES. All Supply Demand traders will love it. :) Important Information Revealed Maximize the potenti
148 USD
ICT, SMC, SMART MONEY CONCEPTS, SMART MONEY, Smart Money Concept, Support and Resistance, Trend Analysis, Price Action, Market Structure, Order Blocks, BOS/CHoCH,   Breaker Blocks ,  Momentum Shift, Supply&Demand Zone/Order Blocks , Strong Imbalance, HH/LL/HL/LH,    Fair Value Gap, FVG,  Premium  &   Discount   Zones, Fibonacci Retracement, OTE, Buy Side Liquidity, Sell Side Liquidity, BSL/SSL Taken, Equal Highs & Lows, MTF Dashboard, Multiple Time Frame, BigBar, HTF OB, HTF Market Structure,  L
63 USD
Currently 20% OFF ! Best Solution for any Newbie or Expert Trader! This dashboard software is working on 28 currency pairs plus one. It is based on 2 of our main indicators (Advanced Currency Strength 28 and Advanced Currency Impulse). It gives a great overview of the entire Forex market plus Gold or 1 indices. It shows Advanced Currency Strength values, currency speed of movement and signals for 28 Forex pairs in all (9) timeframes. Imagine how your trading will improve when you can watch the e
199 USD
Entry Points Pro
Yury Orlov
4.72 (218)
Top indicator for MT4 providing accurate signals to enter a trade without repainting! It can be applied to any financial assets:  forex, cryptocurrencies, metals, stocks, indices.  MT5 version is here   It will provide pretty accurate trading signals and tell you when it's best to open a trade and close it. Watch  the video  (6:22) with an example of processing only one signal that paid off the indicator! Most traders improve their trading results during the first trading week with the help of
125 USD
Advanced Currency IMPULSE with ALERT
Bernhard Schweigert
4.92 (470)
CURRENTLY 31% OFF !! Best Solution for any Newbie or Expert Trader! This indicator is a unique, high quality and affordable trading tool because we have incorporated a number of proprietary features and a secret formula. With only ONE chart it gives Alerts for all 28 currency pairs. Imagine how your trading will improve because you are able to pinpoint the exact trigger point of a new trend or scalping opportunity! Built on new underlying algorithms it makes it even easier to identify and confir
88 USD
Ultimate Sniper Dashboard
Hispraise Chinedum Abraham
4.82 (22)
Discounted at $299! Prices may increase in the future! Read description below! Once you purchase, send a message to my inbox for manual and starter kit. Best Entry System for Ultimate Sniper Dashboard: ULTIMATE DYNAMIC LEVELS. (Please Check my products) The Ultimate Sniper Dashboard ONLY works on live markets due to MT4 multicurrency testing limits. Introducing the Ultimate-Sniper Dashboard! Our very best which contains both HA-Sniper, MA-Sniper. and many special modes. The Ultimate Sniper D
299 USD
TakePropips Donchian Trend Pro
Eric John Pajarillaga Aldana
4.75 (12)
TakePropips Donchian Trend Pro  (MT4) is a powerful and effective tool that automatically detects the direction of the trend using the Donchian Channel and provides you with an entry and exit trading signals! This multi-function indicator includes a trend scanner, trading signals, statistical panel, screener, trading sessions, and alerts history dashboard. It is designed to provide you with trading signals and save you hours analyzing the charts! You can download the user manual and installation
99 USD
Owl smart levels
Sergey Ermolov
4.78 (18)
Indicator Guide   |  Owl Smart Levels Strategy  |  MT5 version  |  How to install?  | FAQ The Owl Smart Levels Indicator  is a complete trading system within the one indicator that includes such popular market analysis tools as  Bill Williams' advanced fractals , Valable ZigZag which builds  the correct wave structure  of the market, and  Fibonacci levels  which mark the exact levels of entry into the market and places to take profits. For a detailed description of the trading system, see the a
97 USD
A. What is A2SR ?   * It's a leading technical indicator (no repaint, no lagging). -- Guidance : -- at   https://www.mql5.com/en/blogs/post/734748/page4#comment_16532516 -- and  https://www.mql5.com/en/users/yohana/blog A2SR has a special technique in determining the levels of Support ( demand ) and Resistance ( supply ) . Unlike the ordinary way that we seen on the net, A2SR has a original concept in determining actual SR levels. The original technique was not taken from the internet, an
386 USD
A top and bottom indicator that can intuitively identify the trend of the band. It is the best choice for manual trading, without redrawing or drifting. How to get this indicator for free: Learn more For any novice and programming trading friend, you can write the signal into the EA to play freely. Array 3 and array 4, for example, 3>4 turns green, 3<4 turns red. If you don't understand, please contact me. ====================Parameter introduction:============== KQuantity                // Disp
79 USD
Scalper Vault
Oleg Rodin
5 (12)
Scalper Vault is a professional scalping system which provides you with everything you need for successful scalping. This indicator is a complete trading system which can be used by forex and binary options traders. The recommended time frame is M5. The system provides you with accurate arrow signals in the direction of the trend. It also provides you with top and bottom signals and Gann market levels. The indicators provides all types of alerts including PUSH notifications. Please contact me af
65 USD
GOLD Impulse with Alert
Bernhard Schweigert
3.67 (3)
This indicator is a super combination of our 2 products  Advanced Currency IMPULSE with ALERT  and  Currency Strength Exotics . It works for all time frames and shows graphically impulse of strength or weakness for the 8 main currencies plus one Symbol! This Indicator is specialized to show currency strength acceleration for any symbols like Gold, Exotic Pairs, Commodities, Indexes or Futures. Is first of its kind, any symbol can be added to the 9th line to show  true currency strength accelerat
149 USD
PRO Renko System
Oleg Rodin
5 (16)
PRO Renko System is a highly accurate trading system specially designed for trading RENKO charts. The ARROWS and Trend Indicators DO NOT REPAINT! The system effectively neutralizes so called market noise giving you access to accurate reversal signals. The indicator is very easy to use and has only one parameter responsible for signal generation. You can easily adapt the tool to any trading instrument of your choice and the size of the renko bar. I am always ready to provide extra support to help
75 USD
PZ Trend Trading
PZ TRADING SLU
4.75 (4)
Trend Trading is an indicator designed to profit as much as possible from trends taking place in the market, by timing pullbacks and breakouts. It finds trading opportunities by analyzing what the price is doing during established trends. [ Installation Guide | Update Guide | Troubleshooting | FAQ | All Products ] Trade financial markets with confidence and efficiency Profit from established trends without getting whipsawed Recognize profitable pullbacks, breakouts and early reversals The ind
175 USD
Moonwalker
Cengiz Erkoyuncu
5 (6)
The Moonwalker MT4 Indicator is a powerful tool that can revolutionize your trend trading strategy on Renko charts by tracking market trends, filtering out sudden fluctuations and market noise with advanced algorithms, and providing unique reliability. This enables you to trade with ease and confidence without the stress of constantly monitoring the markets. Moonwalker and Blitz Scalper are built on the same core strategy. While Moonwalker is specialized for Renko charts, Blitz Scalper is custo
250 USD
Ultimate Dynamic Levels
Hispraise Chinedum Abraham
4.88 (8)
Discounted at $199 for early birds! Prices may increase in the future. Read description below. Once you purchase, send a message to my inbox for manual. Introducing Ultimate Dynamic Levels - the BEST Entry Indicator for the Ultimate Sniper Dashboard! Extremely Low-Risk timely entries and high RR! Find the Ultimate Sniper Dashboard Here The most important ability for both beginner and pro traders is to tell exactly where and when a market is most likely to turn, and how to get in safely and
199 USD
FX Power
Daniel Stein
4.84 (108)
Get your daily market update with details and screenshots via our Morning Briefing  here on mql5  and  on Telegram ! Do you want to become a constantly profitable 5-star forex trader? Then  get our Stein Investments trading tools  and send us a screenshot to get your personal invitation to our exclusive trading chat with 500+ members. FX Power   is the first currency strength meter with a complete history across all time frames. It analyzes the momentum and strength of all major currencies
66 USD
Italo Trend Indicator
Italo Santana Gomes
4.76 (29)
BUY INDICATOR AND GET EA FOR FREE AS A BONUS + SOME OTHER GIFTS! ITALO TREND INDICATOR  is the best trend indicator on the market, the Indicator works on all time-frames and assets, indicator built after 6 years of experience on forex and many other markets. You know many trend indicators around the internet are not complete, does not help, and it's difficult to trade, but the Italo Trend Indicator is different , the Italo Trend Indicator shows the signal to buy or sell, to confirm the signal t
65 USD
Royal Scalping Indicator M4
Vahidreza Heidar Gholami
4.2 (5)
Royal Scalping Indicator is an advanced price adaptive indicator designed to generate high-quality trading signals. Built-in multi-timeframe and multi-currency capabilities make it even more powerful to have configurations based on different symbols and timeframes. This indicator is perfect for scalp trades as well as swing trades. Royal Scalping is not just an indicator, but a trading strategy itself. Features Price Adaptive Trend Detector Algorithm Multi-Timeframe and Multi-Currency Trend Low
149 USD
Shepherd Harmonic Pattern
Abdullah Alrai
4.67 (58)
This indicator will detect harmonic patterns that are drawn on the chart by manual and automatic methods. You can see user manual from this link: Add Your review And contact us to get it There is a free version to try this product on mt4. You can use it to detect Gartley and Nenstar patterns: https://www.mql5.com/en/market/product/30181 You can buy the full MT4 version from: https://www.mql5.com/en/market/product/15212 Notes Indicator has control panel and it will save every (chart & timeframe
125 USD
Italo Volume Indicator
Italo Santana Gomes
4.96 (74)
BUY INDICATOR AND GET EA FOR FREE AS A BONUS + SOME OTHER GIFTS! ITALO VOLUME INDICATOR  is the best volume indicator ever created, and why is that? The Indicator works on all time-frames and assets, indicator built after 6 years of experience on forex and many other markets. You know many volume indicators around the internet are not complete, does not help, and it's difficult to trade, but the Italo Volume Indicator is different , the Italo Volume Indicator shows the wave volume, when market
65 USD
M1 Arrow
Oleg Rodin
5 (7)
M1 Arrow is an indicator which is based on natural trading principles of the market which include volatility and volume analysis. The indicator can be used with any time frame and forex pair. One easy to use parameter in the indicator will allow you to adapt the signals to any forex pair and time frame you want to trade. The Arrows DO NOT REPAINT and DO NOT LAG! The algorithm is based on the analysis of volumes and price waves using additional filters. The intelligent algorithm of the indicato
65 USD
Italo Pivots Indicator
Italo Santana Gomes
5 (3)
BUY INDICATOR AND GET A PIVOT POINT EA FOR FREE AS A BONUS + SOME OTHER GIFTS! ITALO PIVOTS INDICATOR  is the best pivot point indicator for  strong   price   reversals and continuations of price movements  ever created , and why is that? You will have for the first time inside a pivot point indicator the pivots above the monthly, so, you will have the 3-month pivot lines, 6 months, 1 year, 2 years, 3 years, 5 years and 10 years. Not only that but for the first time you will be able to put ever
65 USD
PZ Harmonacci Patterns
PZ TRADING SLU
3.43 (7)
This is arguably the most complete harmonic price formation auto-recognition indicator you can find for the MetaTrader Platform. It detects 19 different patterns, takes fibonacci projections as seriously as you do, displays the Potential Reversal Zone (PRZ) and finds suitable stop-loss and take-profit levels. [ Installation Guide | Update Guide | Troubleshooting | FAQ | All Products ] It detects 19 different harmonic price formations It plots primary, derived and complementary Fibonacci pro
249 USD
Blahtech Market Profile
Blahtech Limited
4.63 (19)
Market Profile defines a number of day types that can help the trader to determine market behaviour. A key feature is the Value Area, representing the range of price action where 70% of trading took place. Understanding the Value Area can give traders valuable insight into market direction and establish the higher odds trade. It is an excellent addition to any system you may be using. Blahtech Limited presents their Market Profile indicator for the MetaTrader community. Inspired by Jim Dalton’s
142 USD
Pips Generator
Oleg Rodin
5 (3)
Apollo Pips Generator  is a channel based indicator which provides entry signals in the direction of the trend. The indicator provides multiple entry points so you can always find a trading opportunity to profit on. The tool also provides you with clear exit signals in a form of stars. ALL SIGNALS DO NOT REPAINT! The indicator can be used with any forex pair and time frame. The indicator provides all types of alerts including PUSH notifications. PLEASE CONTACT ME AFTER PURCHASE AND GET TRADING I
65 USD
SR Imbalance Scalping
Rudy Tanureja
4.79 (39)
Smart Money Concept, which we believe originated from Inner Circle Trader program founded by Michael J. Huddleston and ever since has been widely used and we also see that many new findings and variations from other traders as well. This indicator has been evolving since 2021 to keep up and adopt the good ones from Smart Money Concept together with our own findings. For example, what we learn before that Order Block is the last bullish candle before bearish movement (vice versa), has been refine
75 USD
Supply and Demand Dashboard PRO
Bernhard Schweigert
4.8 (20)
Currently 20% OFF ! This dashboard is a very powerful piece of software working on multiple symbols and up to 9 timeframes. It is based on our main indicator (Best reviews:   Advanced Supply Demand ). The dashboard gives a great overview. It shows: Filtered Supply and Demand values including zone strength rating, Pips distances to/and within zones, It highlights nested zones, It gives 4 kind of alerts for the chosen symbols in all (9) time-frames. It is highly configurable for your personal
199 USD
More from author
Multi Chart Crosshairs MT5
Robert Gerald Wood
5 (5)
This indicator is designed to make reviews of many charts on different timescales quicker, and easier to do. Track Time and Price across multiple charts Change Symbol on one chart and all other charts of the same symbol will be changed too. Easy to use, quick to master The indicator allows you to identify the price and time where the mouse pointer is on the current chart, across all other charts open on the same Symbol. This allows you to quickly see information on multiple charts whereas norma
30 USD
TheStrat Levels
Robert Gerald Wood
This indicator draws the prior Highs and Lows for multiple timeframes, and can display potential Take Profit and Stop Loss levels. In Rob Smith's # The Strat   terms,   these are potential entry points, or alternatively potential targets for open positions. I like to use them in both ways. On a lower timeframe, say 5 minutes to get a good entry on a daily or weekly level, and then as a potential target. Very small stops required giving an excellent risk/reward ratio. Please watch the DEMO video
90 USD
TheStrat Monitor
Robert Gerald Wood
5 (1)
If you've not already learnt about The Strat trading strategy , go google it now. I promise it won't be a waste of your time, and you will likely learn some new tricks whether you use it or not. OK, so now you know what TheStrat is, you will be able to understand what this indicator can do for you. Key Features In short, the Indicator will: Show Timeframe Continuity for all supported timeframes Supports two timeset views, Day trader and Swing trader Show when Full Timeframe Continuity is in pl
150 USD
TheStrat Patterns
Robert Gerald Wood
This indicator will draw patterns based on Rob Smith's The Strat as they emerge in real time on your chart. As price evolves, TheStrat offers 18 distinct price action patterns that can help you get good entries in the market. Each pattern involves two or three candles, and this indicator will draw a bounding box around the candles and name the pattern. The indicator also shows when a potential setup is forming, known by stratters as an Actionable signal. Candles Each candle is defined by i
90 USD
This indicator draws the prior Highs and Lows for multiple timeframes, and can display potential Take Profit and Stop Loss levels. In Rob Smith's # The Strat  terms, these are potential entry points, or alternatively potential targets for open positions. I like to use them in both ways. On a lower timeframe, say 5 minutes to get a good entry on a daily or weekly level, and then as a potential target. Very small stops required giving an excellent risk/reward ratio. Key Features  - Levels from Ho
90 USD
Multi Chart Crosshairs
Robert Gerald Wood
5 (1)
This indicator is designed to make reviews of many charts on different timescales quicker, and easier to do. Track Time and Price across multiple charts Change Symbol on one chart and all other charts of the same symbol will be changed too. Easy to use, quick to master The indicator allows you to identify the price and time where the mouse pointer is on the current chart, across all other charts open on the same Symbol. This allows you to quickly see information on multiple charts whereas normal
30 USD
This indicator will draw patterns based on   Rob Smith's   The Strat   as they emerge in real time on your chart. As price evolves,   TheStrat   offers 18 distinct price action patterns that can help you get good entries in the market. Each pattern involves two or three candles, and this indicator will draw a bounding box around the candles and name the pattern. The indicator also shows when a potential setup is forming, known by stratters as an Actionable signal. Candles Each candle is de
90 USD
I created this simple indicator while I was learning about Rob Smith's TheStrat and find it so helpful, I thought I would share it with you. If you find it useful, please look at the other indicators I have published on MQL5. The indicator simply draws a single line on the chart showing the price level you select from a higher timeframe. Using the settings you have full control over the timeframe it displays but b y default, it calculates the higher timeframe itself, just moving up the scale by
FREE
This indicator will draw a label above or below each candle based on   Rob Smith's   The Strat   as they develop over time on your chart. As price evolves, a candle can switch between three states. When the candle first opens, if it sits completely within the previous candles high and low, then it will start as a Type 1. As time moves on, if it breaks either the high or low of the previous candle, it will be come a type 2, and should the price action be volatile and directionless, it may then
30 USD
Markets really love round numbers and they often act as support in a falling market, or resistance as price rises. This indicator is designed to draw price levels at Round values. It does this automatically, but you also have the option to override that and determine the levels you wish to see. A round level can be as simple as steps of 10, so 10, 20, 30 etc or if you are working with Forex, maybe you want to see changes at 0.1 or 0.01. The indicator draws two classes of line, Major and Minor,
40 USD
Chart Drawing Cloner
Robert Gerald Wood
5 (4)
This Script allows you to copy drawing objects of any type, like trend lines, Fibonachi Retracements etc, to one or more other charts. By default, the script will copy all the objects on the current chart, that is the chart the script was applied to, to any other chart of the same Symbol currently loaded. Settings DestinationTimeframe When set to anything other than PERIOD_CURRENT, then it will copy the objects to any open chart of the same Symbol as the chart the script was applied to. If
FREE
When trading using The Strat , it is important to keep an eye on multiple timeframes. This indicator will show the Daily, Weekly, Monthly and Quarterly state of the current candle for each timeframe. A Circle icon shows that the candle on that timeframe is currently an Inside, or Type 1 in TheStrat terminology. An Inside Day candle is consolidating price action, and we are looking for a breakout of the range. A Triangle icon, pointing up or down, is a trending candle, or Type 2 in TheStrat termi
30 USD
When trading using  The Strat , it is important to keep an eye on multiple timeframes. This indicator will show the Daily, Weekly, Monthly and Quarterly state of the current candle for each timeframe. A Circle icon shows that the candle on that timeframe is currently an Inside, or Type 1 in TheStrat terminology. An Inside Day candle is consolidating price action, and we are looking for a breakout of the range. A Triangle icon, pointing up or down, is a trending candle, or Type 2 in TheStrat term
30 USD
A simple script that can delete all the drawing objects on a chart, or just the objects of a specific type. Settings: DeleteObjectsOfType By default the value will be blank which means ALL drawing objects on the chart will be deleted. If you only wish to delete specific types of drawing object, change this setting to the type of object to delete. For example, Fibonacci Retracement, Text, Label or Trend Line. Please see the demonstration video for more information.
FREE
This script allows you to toggle the "Show Trade Levels" option, but for the current chart only. Normally, you can only change the setting using the Options -> Chart menu for ALL charts, but this script allows you to do it for a SINGLE chart. I'm using it when I take screenshots, because most of the time I'm not trying to show the trades, just some functionality of one of my other tools. Iif you need that functionality, then this script is very helpful! If the script helps you, please let me
FREE
TheStrat Candles
Robert Gerald Wood
4 (1)
This indicator will draw a label above or below each candle based on   Rob Smith's   The Strat   as they develop over time on your chart. As price evolves, a candle can switch between three states. When the candle first opens, if it sits completely within the previous candles high and low, then it will start as a Type 1. As time moves on, if it breaks either the high or low of the previous candle, it will be come a type 2, and should the price action be volatile and directionless, it may then
30 USD
TheStrat FTFC
Robert Gerald Wood
FTFC refers to Full Timeframe Continuity as defined by Rob Smith's The Strat . This indicator draws two lines on the chart, one of the highest of the Quarterly, Monthly, Weekly, Daily or Hourly opening levels, and the second of the lowest of those values. This gives you a channel above or below which trading is more likely to be very strongly in one direction. Between the lines, price action will be choppier and you may with to use wider stops. A third dashed line is also drawn to show the mid p
50 USD
Round Price Levels
Robert Gerald Wood
Markets really love round numbers and they often act as support in a falling market, or resistance as price rises. This indicator is designed to draw price levels at Round values. It does this automatically, but you also have the option to override that and determine the levels you wish to see. A round level can be as simple as steps of 10, so 10, 20, 30 etc or if you are working with Forex, maybe you want to see changes at 0.1 or 0.01. The indicator draws two classes of line, Major and Minor, e
40 USD
Active Pivot Levels
Robert Gerald Wood
5 (1)
Pivot levels are a well established technical level that's recognised in every market. This indicator will draw the current Quarterly, Monthly, Weekly, Daily and four-hourly pivots on the chart, for any symbol. You can also show the Suppport and Resistance levels for each period and choose which to display from levels 1 to 4.   Choose the type of Pivot from: Standard Camarilla DeMark Woodie Fibonacci Please note, DeMark pivots have a single Support and Resistance level as per the original speci
50 USD
ATR Extremes
Robert Gerald Wood
Average True Range (ATR) is a commonly used indicator that measures the amount of movement in price over a set duration. However the value it gives is not defined within any sort of boundary, which makes using it for anything other than stop loss or take profit calculations, almost impossible. This indicator is your standard ATR indicator, but we have introduced percentile demarcations so you can see the extremes. You can choose between Percentiles and something we call Split Medians Percentile
30 USD
TheStrat FTFC MT5
Robert Gerald Wood
FTFC refers to Full Timeframe Continuity as defined by Rob Smith's  The Strat  . This indicator draws two lines on the chart, one of the highest of the Quarterly, Monthly, Weekly, Daily or Hourly opening levels, and the second of the lowest of those values. This gives you a channel above or below which trading is more likely to be very strongly in one direction. Between the lines, price action will be choppier and you may with to use wider stops. A third dashed line is also drawn to show the mid
50 USD
If you've not already learnt about The Strat trading strategy , go google it now. I promise it won't be a waste of your time, and you will likely learn some new tricks whether you use it or not. OK, so now you know what TheStrat is, you will be able to understand what this indicator can do for you. Key Features In short, the Indicator will: Show Timeframe Continuity for all supported timeframes Supports two timeset views, Day trader and Swing trader Show when Full Timeframe Continuity is in pl
150 USD
Pivot levels are a well established technical level that's recognised in every market. This indicator will draw the current Quarterly, Monthly, Weekly, Daily and four-hourly pivots on the chart, for any symbol. You can also show the Suppport and Resistance levels for each period and choose which to display from levels 1 to 4.   Choose the type of Pivot from: Standard Camarilla DeMark Woodie Fibonacci Please note, DeMark pivots have a single Support and Resistance level as per the original specif
50 USD
ATR Extremes MT5
Robert Gerald Wood
Average True Range (ATR) is a commonly used indicator that measures the amount of movement in price over a set duration. However the value it gives is not defined within any sort of boundary, which makes using it for anything other than stop loss or take profit calculations, almost impossible. This indicator is your standard ATR indicator, but we have introduced percentile demarcations so you can see the extremes. You can choose between Percentiles and something we call Split Medians Percentile
30 USD
Range Exhaustion occurs when price meets or exceeds the expected range for the current period. At these levels, price starts to lose its momentum relative to earlier in the period, so its a good point to make sure you are not taking new positions. This indicator will show you where this is likely to happen on your chart, showing levels for Daily, Weekly and Monthly periods. When you see price exceeding these exhaustion levels, it's telling you that the momentum behind the move is very strong an
60 USD
Filter:
No reviews
Reply to review