• Overview
  • Reviews
  • Comments
  • What's new

Higher Timeframe Price Line

I created this simple indicator while I was learning about Rob Smith's TheStrat and find it so helpful, I thought I would share it with you. If you find it useful, please look at the other indicators I have published on MQL5.

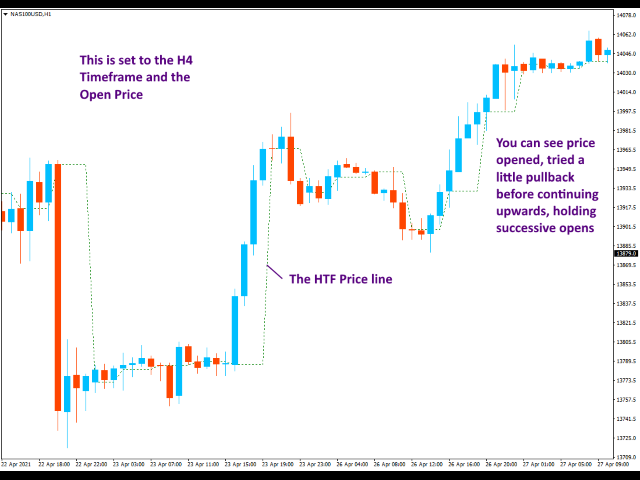
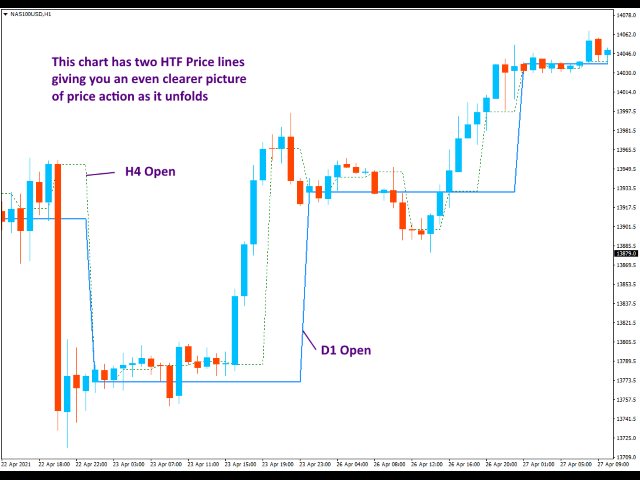
The indicator simply draws a single line on the chart showing the price level you select from a higher timeframe.

Using the settings you have full control over the timeframe it displays but by default, it calculates the higher timeframe itself, just moving up the scale by one step. For example, if you open a H1 chart, it will show data from the H4 chart.


Settings

TrackTimeframe

Choose the timeframe from which the price level will be drawn. If you leave it at the default setting of Current, it will choose the appropriate timeframe for you. This is very helpful if you are reviewing a chart and changing between timeframes as the line will always adjust itself upwards.

TrackValue

You can choose one from the standard price values below. The default is the Open price.

PRICE_CLOSE

Close price

PRICE_OPEN

Open price

PRICE_HIGH

The maximum price for the period

PRICE_LOW

The minimum price for the period

PRICE_MEDIAN

Median price, (high + low)/2

PRICE_TYPICAL

Typical price, (high + low + close)/3

PRICE_WEIGHTED

Weighted close price, (high + low + close + close)/4


Recommended products
Necessary for traders: tools and indicators Waves automatically calculate indicators, channel trend trading Perfect trend-wave automatic calculation channel calculation , MT4 Perfect trend-wave automatic calculation channel calculation , MT5 Local Trading copying Easy And Fast Copy , MT4 Easy And Fast Copy , MT5 Local Trading copying For DEMO Easy And Fast Copy , MT4 DEMO Easy And Fast Copy , MT5 DEMO The homeopathic indicator is also called the CCI indicator. The CCI indicator was propos
FREE
Free automatic Fibonacci is an indicator that automatically plots a Fibonacci retracement based on the number of bars you select on the BarsToScan setting in the indicator. The Fibonacci is automatically updated in real time as new highest and lowest values appears amongst the selected bars. You can select which level values to be displayed in the indicator settings. You can also select the color of the levels thus enabling the trader to be able to attach the indicator several times with differe
FREE
PZ Penta O MT4
PZ TRADING SLU
2 (2)
The Penta-O is a 6-point retracement harmonacci pattern which usually precedes big market movements. Penta-O patterns can expand and repaint quite a bit. To make things easier this indicator implements a twist: it waits for a donchian breakout in the right direction before signaling the trade. The end result is an otherwise repainting indicator with a very reliable trading signal. The donchian breakout period is entered as an input. [ Installation Guide | Update Guide | Troubleshooting | FAQ | A
FREE
DECEMBER OFFER 80% OFF next price for unlimited version will be 17000$. This is the only time you can get this institutional and professional indicator at this price for unlimited version. Don't dare to miss this. The tool I am about to introduce to you you can't compare it with other tools due to its strategy and accuracy level in predicting the next price directional movement . This tool is designed for serious traders who have decided to make a difference through trading. Be the next person t
13 500 USD
Virtual Targets
Hoang Van Dien
3.6 (5)
This indicator is very useful for day traders or short term traders. No need to calculate the number of pips manually, just look at the chart and you will see the Virtual Take Profit / Virtual Stop Loss target line and evaluate whether the entry point is feasible to reach the intended target or not. Enter the intended Take Profit / Stop Loss pips for your trade. The indicator will display Virtual Take Profit / Virtual Stop Loss lines for you to easily see if the target is feasible or not.
FREE
Free and limited version (   only one alert ) of the popular X-Lines indicator. X-Lines 2.0 Pro I want to present for your attention a new and completely updated and expanded version of X-Lines indicator. Version 2.0 Pro has many new features and can make your analysis more productive. Please read full instructions   here . Purchasing full version   here . 1)   Multi-timeframe settings and user-friendly control panel. You can dynamically select and save indicator settings not only for each c
FREE
Triple RSI
Pablo Leonardo Spata
2.5 (2)
LOOK AT THE FOLLOWING STRATEGY WITH THIS INDICATOR. Triple RSI is a tool that uses the classic Relative Strength Indicator, but in several timeframes to find market reversals.    1.  ️ Idea behind the indicator and its strategy: In Trading, be it Forex or any other asset, the ideal is to keep it simple, the simpler the better . The triple RSI strategy is one of the simple strategies that seek market returns. In our experience, where there is more money to always be won, is in the marke
FREE
Custom ZigZag MT4
Evgeniy Chumakov
5 (1)
The ZigZag indicator is a popular signal indicator, with the help of which trend lines are formed connecting the main peaks and bases on the price chart. It clearly displays the most significant reversals and pullbacks of the market. Input parameters of the indicator:     Step In Points - the levels are drawn if the price deviates from the last extreme by a specified number of points.     Step In Percentage - the levels are drawn if the price deviates as a percentage from the last extreme. (
FREE
Follow The Line
Oliver Gideon Amofa Appiah
4.3 (10)
FOLLOW THE LINE GET THE FULL VERSION HERE: https://www.mql5.com/en/market/product/36024 This indicator obeys the popular maxim that: "THE TREND IS YOUR FRIEND" It paints a GREEN line for BUY and also paints a RED line for SELL.  It gives alarms and alerts of all kinds. IT DOES NOT REPAINT and can be used for all currency pairs and timeframes. Yes, as easy and simple as that. Even a newbie can use it to make great and reliable trades. NB: For best results, get my other premium indicators for more
FREE
Email Drawdown Alert
Roman Starostin
5 (14)
Free informative Indicator-helper. It'll be usefull for traders who trade many symbols or using grid systems (Averaging or Martingale). Indicator counts drawdown as percent and currency separate. It has a number of settings: Count deposite drawdown according equity value and send e-mail or notifications to user if DD more than set; Sending e-mail when max open orders reached; Shows price and remaining pips amount before MarginCall on current chart and Account generally; Display summary trade lot
FREE
OrderBlock TS Roman
Vladislav Vlastovskii
3.5 (4)
Индикатор строит блоки заказов (БЗ) по торговой системе (ТС) Романа. Поиск блоков осуществляется одновременно на двух таймфремах: текущем и старшем (определяемым в настройках). Для оптимизации и игнорирования устаревших блоков в настройках задается ограничение количества дней в пределах которых осуществляется поиск блоков. Блоки строятся по правилам ТС состоящем из трех шагов: какую свечу вынесли (что?); какой свечой вынесли (чем?); правило отрисовки (как?).
FREE
Trend arrow Indicator
NGUYEN NGHIEM DUY
3.29 (14)
Trend arrow Indicator is an arrow Indicator used as an assistant tool for your trading strategy. The indicator analyzes the standard deviation of bar close for a given period and generates a buy or sell signals if the deviation increases. It good to combo with Martingale EA to follow Trend and Sellect Buy Only/Sell Only for EA work Semi-Automatic. You can use this  Indicator with any EAs in my Products.
FREE
Pivot Point Fibo RSJ is an indicator that traces the support and resistance lines of the day using Fibonacci rates. This spectacular indicator creates up to 7 levels of support and resistance through Pivot Point using Fibonacci rates. It is fantastic how the prices respect each level of this support and resistance, where it is possible to perceive possible entry/exit points of an operation. Features Up to 7 levels of support and 7 levels of resistance Set the colors of the levels individual
FREE
TrendPlus
Sivakumar Subbaiya
4.67 (12)
Trend Plus   Trendplus  Indicator   Time Frame: Suitable for any time frame.  Purpose: Trend Prediction. Blue and red candle indicate the buy and sell call respectively. Buy: When the blue candle is formed buy call is initiated. close the buy trades when the next red candle will formed.   Sell: When the Red candle is formed Sell call is initiated. close the Sell trades when the next blue candle will formed.   Happy trade!! Subscribe our MT4 trading signal copier https://www.mql5.com/en/sig
FREE
Индикатор "Buy Sell zones x2" основан на принципе "остановка/разворот после сильного движения". Поэтому, как только обнаруживается сильное безоткатное движение, сразу после остановки - рисуется зона покупок/продаж. Зоны отрабатывают красиво. Или цена ретестит зону и улетает в космос, или пробивает зону насквозь и зона отрабатывается с другой стороны так же красиво.  Работает на всех таймфреймах. Лучше всего выглядит и отрабатывает на Н1.    Может использоваться как: индикатор зон, где лучше
FREE
Harmonic Pattern Limited
Reza Aghajanpour
4.75 (4)
You can download the Full version with more features  here . Introduction Harmonic Patterns are best used to predict turning point. Harmonic Patterns give you high win rate and high opportunities for trade in during one day. This indicator detects the best and successful patterns base on Harmonic Trading books by Mr. Scott M.. Main Features Detect the best and   most successful patterns : Gartley, Bat, Crab, Butterfly, Cypher, Shark, Alt_Bat, Deep_Crab Easy-to-use and user friendly indicator Sc
FREE
RSX Signal 2 AM
Andriy Matviyevs'kyy
The indicator displays the signals of the RSX oscillator on the price chart. (To display these signals in a separate window, along with the oscillator, another indicator is used -  RSX Osc 4 AM ). It is optimal to use the indicator signals as signals to open a trade when the price overcomes the maximum or minimum of the bar at which the signal was given. An opposite signal cancels the previous signal. Settings: Data period for indicator calculation - data period for indicator calculation; Data
FREE
Market Profile 3
Hussien Abdeltwab Hussien Ryad
5 (1)
Market Profile 3 MetaTrader 4 indicator  — is a classic Market Profile implementation that can show the price density over time, outlining the most important price levels, value area, and control value of a given trading session. This indicator can be attached to timeframes between M1 and D1 and will show the Market Profile for daily, weekly, monthly, or even intraday sessions. Lower timeframes offer higher precision. Higher timeframes are recommended for better visibility. It is also possible t
FREE
Just another Auto Fibonacci Retracement indicator . However, this is the most Flexible & Reliable one you can find for FREE. If you use this indicator and you like it, please leave a review/comment. If you are looking for a more advanced Fibo indicator, check this  Free  Trend-Based Fibo indicator . ### FEATURES ### Auto-calculate up to 7 Fibonacci levels on your customized frame. Adjust levels as your need. Use   High/Low price or  Open/Close price to calculate. Freeze the levels and don't re
FREE
Traditional MACD MT4
Daniel Lewis
4.62 (63)
MACD indicator in MetaTrader 4/5 looks different than MACD does in most other charting software. That is because the MetaTrader 4/5 version of MACD displays the MACD line as a histogram when it is traditionally displayed as a line. Additionally, the MetaTrader 4/5 version computes the Signal line using an SMA, while according to MACD definition it is supposed to be an EMA. The MetaTrader 4/5 version also does not compute a true MACD Histogram (the difference between the MACD/Signal lines). This
FREE
Extremum Reverse Bar
Yurij Izyumov
3.55 (11)
This indicator has been created for finding the probable reversal points of the symbol price. A small candlestick reversal pattern is used it its operation in conjunction with a filter of extremums. The indicator is not redrawn! If the extremum filter is disabled, the indicator shows all points that have a pattern. If the extremum filter is enabled, the condition works – if the history Previous bars 1 candles back contains higher candles and they are farther than the Previous bars 2 candle, such
FREE
Simple RSI Forex Trading Strategy
Victor Manuel Valderrama Zamora
2.5 (2)
Diversify the risk in your trading account by combining our Expert Advisors. Build your own custom trading system here:   Simple Forex Trading Strategies The expert advisor opens trades when RSI indicator enter in oversold or overbought areas. The Stop Loss, Take Profit, and Trailing Stop are calculated based on the ATR indicator. The recommended currency pair is EURGBP and the recommended timeframe to operate and to do backtests is H4. This Expert Advisor can be profitable in any TimeFrame a
FREE
UPD1 Murrey Math Levels
Vitaliy Kuznetsov
5 (6)
Murray's mathematical levels are based on observations by Gann and his theory of the squareness of prices. According to Gann, the price moves in 1/8 of the range. These 1/8 allow us to get different resistance and support levels for a given chart, which have their own characteristics. After a breakout of -2 or +2 levels, or with a decrease in volatility, they are rebuilt. You can choose which period to display (current or entire history). All lines are drawn through buffers. Blog-Link -   Murrey
FREE
Wise Men Indicator demo
Bohdan Kasyanenko
3.67 (3)
The indicator displays signals according to the strategy of Bill Williams on the chart. Demo version of the indicator has the same features as the paid, except that it can work only on a demo account . Signal "First Wise Man" is formed when there is a divergent bar with angulation.  Bullish divergent bar - with lower minimum and closing price in the upper half. Bearish divergent bar - higher maximum and the closing price at the bottom half. Angulation is formed when all three lines of Alligat
FREE
Rainbow MT4
Jamal El Alama
Rainbow MT4 is a technical indicator based on Moving average with period 34 and very easy to use. When price crosses above MA and MA changes color to green, it’s a signal to buy. When price crosses below MA and MA changes color to red, it’s a signal to sell. The Expert advisor ( Rainbow EA MT4) based on Rainbow MT4 indicator, as you can see in the short video below is now available here .
FREE
Forex trading support timer: - This is an indicator that supports a trader's trading process. - Before placing a BUY or SELL order, it is advisable to observe what the current time is like, to get the best position when trading. Function of indicator: - Display information about candle closing time of different timeframes (M1,M5,M15,H1), best used when Scalping. - Show market spreads. - Show TimeZone Trading. - Displays the remaining time of a session.
FREE
UPD1 X00 Levels
Vitaliy Kuznetsov
4.9 (10)
The indicator shows round levels on the chart. They are also called psychological , banking, or levels of major players. At these levels, there is a real fight between bulls and bears, the accumulation of many orders, which leads to increased volatility . The indicator automatically adjusts to any instrument and timeframe. When the level 80 is broken through and then tested, we buy . When level 20 is broken through and then tested, we sell . The target is 00. Attention. Due to strong support and
FREE
This indicator draws regular bullish and bearish divergences in real-time onto the charts. The algorithm to detect those divergences is based on my 10+ years experience of detecting divergences visually. The divergences are drawn as green and red rectangles on the charts. You can even do forward testing in the visual mode of the strategy tester. This FREE Version is restricted to EURUSD and GBPUSD. The full version without restrictions is here: https://www.mql5.com/en/market/product/42732 Para
FREE
RSI Candle Signal
Jonathan Destailleur
4.67 (3)
RSI Candle Signal Indicator will change bars’ color when set overbought or oversold levels reach. How to Use RSI Candle Signal Uptrend/Downtrends  - RSI may be used to detect trending markets. For example, the RSI may stay above the mid line 50 in an uptrend. Top and Buttoms  - RSI may help in identifying the tops around the overbought readings (usually above 70), and the bottoms around the oversold area (usually below 30). Divergence  - divergence occurs when RSI directional movement is not c
FREE
This pointer is supplied of a double smoothing in such way to succeed to be more reactive of a blunt Moving Average but without tracing the noises of bottom of the market. Its use will have to be exclusively turned to the search and to the identification of the trend in action (even if graphically it could seem an indicator that indicates an inversion of the prices) because   the first useful signal is had to the opening of the successive bar to that one that has made to invert the sense of the
FREE
Buyers of this product also purchase
RelicusRoad Pro
Relicus LLC
4.94 (100)
How many times have you bought a trading indicator with great back-tests, live account performance proof with fantastic numbers and stats all over the place but after using it on your account, you end up blowing your account? You shouldn't trust a signal by itself, you need to know why it appeared in the first place, and that's where RelicusRoad Indicator comes in to save the day. NOW $147 ($602 DISCOUNT) - UNLIMITED ACCOUNTS (5 PCs LICENSE) - PRICE WILL INCREASE TO $749 SOON User Manual + Str
147 USD
CURRENTLY 26% OFF Best Solution for any Newbie or Expert Trader! This Indicator is a unique, high quality and affordable trading tool because we have incorporated a number of proprietary features and a new formula. With only ONE chart you can read Currency Strength for 28 Forex pairs! Imagine how your trading will improve because you are able to pinpoint the exact trigger point of a new trend or scalping opportunity? User manual: click here That's the first one, the original! Don't buy a worthle
148 USD
Advanced Supply Demand
Bernhard Schweigert
4.93 (293)
CURRENTLY 26% OFF !! Best Solution for any Newbie or Expert Trader! This indicator is a unique, high quality and affordable trading tool because we have incorporated a number of proprietary features and a new formula. With this update, you will be able to show double timeframe zones. You will not only be able to show a higher TF but to show both, the chart TF, PLUS the higher TF: SHOWING NESTED ZONES. All Supply Demand traders will love it. :) Important Information Revealed Maximize the potenti
148 USD
Gold Stuff
Vasiliy Strukov
4.87 (166)
Gold Stuff is a trend indicator designed specifically for gold and can also be used on any financial instrument. The indicator does not redraw and does not lag. Recommended time frame H1. At it indicator work full auto  Expert Advisor EA Gold Stuff. You can find it at my profile. Contact me immediately after the purchase to get the settings and a personal bonus!  SETTINGS Draw Arrow - on off. drawing arrows on the chart. Alerts -   on off audible alerts. E-mail notification - on off. email notif
50 USD
ICT, SMC, SMART MONEY CONCEPTS, SMART MONEY, Smart Money Concept, Support and Resistance, Trend Analysis, Price Action, Market Structure, Order Blocks, BOS/CHoCH,   Breaker Blocks ,  Momentum Shift, Supply&Demand Zone/Order Blocks , Strong Imbalance, HH/LL/HL/LH,    Fair Value Gap, FVG,  Premium  &   Discount   Zones, Fibonacci Retracement, OTE, Buy Side Liquidity, Sell Side Liquidity, BSL/SSL Taken, Equal Highs & Lows, MTF Dashboard, Multiple Time Frame, BigBar, HTF OB, HTF Market Structure,  L
63 USD
Currently 20% OFF ! Best Solution for any Newbie or Expert Trader! This dashboard software is working on 28 currency pairs plus one. It is based on 2 of our main indicators (Advanced Currency Strength 28 and Advanced Currency Impulse). It gives a great overview of the entire Forex market plus Gold or 1 indices. It shows Advanced Currency Strength values, currency speed of movement and signals for 28 Forex pairs in all (9) timeframes. Imagine how your trading will improve when you can watch the e
199 USD
Entry Points Pro
Yury Orlov
4.72 (218)
Top indicator for MT4 providing accurate signals to enter a trade without repainting! It can be applied to any financial assets:  forex, cryptocurrencies, metals, stocks, indices.  MT5 version is here   It will provide pretty accurate trading signals and tell you when it's best to open a trade and close it. Watch  the video  (6:22) with an example of processing only one signal that paid off the indicator! Most traders improve their trading results during the first trading week with the help of
125 USD
Advanced Currency IMPULSE with ALERT
Bernhard Schweigert
4.92 (470)
CURRENTLY 31% OFF !! Best Solution for any Newbie or Expert Trader! This indicator is a unique, high quality and affordable trading tool because we have incorporated a number of proprietary features and a secret formula. With only ONE chart it gives Alerts for all 28 currency pairs. Imagine how your trading will improve because you are able to pinpoint the exact trigger point of a new trend or scalping opportunity! Built on new underlying algorithms it makes it even easier to identify and confir
88 USD
Ultimate Sniper Dashboard
Hispraise Chinedum Abraham
4.82 (22)
Discounted at $299! Prices may increase in the future! Read description below! Once you purchase, send a message to my inbox for manual and starter kit. Best Entry System for Ultimate Sniper Dashboard: ULTIMATE DYNAMIC LEVELS. (Please Check my products) The Ultimate Sniper Dashboard ONLY works on live markets due to MT4 multicurrency testing limits. Introducing the Ultimate-Sniper Dashboard! Our very best which contains both HA-Sniper, MA-Sniper. and many special modes. The Ultimate Sniper D
299 USD
TakePropips Donchian Trend Pro
Eric John Pajarillaga Aldana
4.75 (12)
TakePropips Donchian Trend Pro  (MT4) is a powerful and effective tool that automatically detects the direction of the trend using the Donchian Channel and provides you with an entry and exit trading signals! This multi-function indicator includes a trend scanner, trading signals, statistical panel, screener, trading sessions, and alerts history dashboard. It is designed to provide you with trading signals and save you hours analyzing the charts! You can download the user manual and installation
99 USD
Market Reversal Alerts
LEE SAMSON
4.18 (117)
Profit from market structure changes as price reverses and pulls back. The market structure reversal alert indicator identifies when a trend or price move is approaching exhaustion and ready to reverse. It alerts you to changes in market structure which typically occur when a reversal or major pullback are about to happen. The indicator identifies breakouts and price momentum initially, every time a new high or low is formed near a possible exhaustion point. The indicator draws in a rectangle on
49 USD
Owl smart levels
Sergey Ermolov
4.78 (18)
Indicator Guide   |  Owl Smart Levels Strategy  |  MT5 version  |  How to install?  | FAQ The Owl Smart Levels Indicator  is a complete trading system within the one indicator that includes such popular market analysis tools as  Bill Williams' advanced fractals , Valable ZigZag which builds  the correct wave structure  of the market, and  Fibonacci levels  which mark the exact levels of entry into the market and places to take profits. For a detailed description of the trading system, see the a
97 USD
A. What is A2SR ?   * It's a leading technical indicator (no repaint, no lagging). -- Guidance : -- at   https://www.mql5.com/en/blogs/post/734748/page4#comment_16532516 -- and  https://www.mql5.com/en/users/yohana/blog A2SR has a special technique in determining the levels of Support ( demand ) and Resistance ( supply ) . Unlike the ordinary way that we seen on the net, A2SR has a original concept in determining actual SR levels. The original technique was not taken from the internet, an
386 USD
Automatically draw support and resistance levels PLUS propulsion candle gaps on your chart, so you can see where price is likely to head next and/or potentially reverse. This indicator is designed to be used as part of the position trading methodology taught on my website (The Market Structure Trader) and displays key information for targeting and potential entries. MT version available here:  https://www.mql5.com/en/market/product/97973 There are 2 CORE features in the indicator and 4 additiona
49 USD
A top and bottom indicator that can intuitively identify the trend of the band. It is the best choice for manual trading, without redrawing or drifting. How to get this indicator for free: Learn more For any novice and programming trading friend, you can write the signal into the EA to play freely. Array 3 and array 4, for example, 3>4 turns green, 3<4 turns red. If you don't understand, please contact me. ====================Parameter introduction:============== KQuantity                // Disp
79 USD
Scalper Vault
Oleg Rodin
5 (12)
Scalper Vault is a professional scalping system which provides you with everything you need for successful scalping. This indicator is a complete trading system which can be used by forex and binary options traders. The recommended time frame is M5. The system provides you with accurate arrow signals in the direction of the trend. It also provides you with top and bottom signals and Gann market levels. The indicators provides all types of alerts including PUSH notifications. Please contact me af
65 USD
Trend Screener
STE S.S.COMPANY
4.76 (59)
Trend Indicator, Breakthrough  unique Solution For Trend Trading And Filtering With All Important trend Features Built   Inside One Tool!   It's   100% non-repainting multi-timeframe and Multi-currencies   indicator that can be used on all symbols/instruments: forex, commodities, cryptocurrencies, indices and stocks. LIMITED TIME OFFER : Trend Screener Indicator is available for only 50 $ and lifetime. ( Original price 125$ ) Trend Screener   is efficient indicator trend following indicator ta
50 USD
GOLD Impulse with Alert
Bernhard Schweigert
3.67 (3)
This indicator is a super combination of our 2 products  Advanced Currency IMPULSE with ALERT  and  Currency Strength Exotics . It works for all time frames and shows graphically impulse of strength or weakness for the 8 main currencies plus one Symbol! This Indicator is specialized to show currency strength acceleration for any symbols like Gold, Exotic Pairs, Commodities, Indexes or Futures. Is first of its kind, any symbol can be added to the 9th line to show  true currency strength accelerat
149 USD
PRO Renko System
Oleg Rodin
5 (16)
PRO Renko System is a highly accurate trading system specially designed for trading RENKO charts. The ARROWS and Trend Indicators DO NOT REPAINT! The system effectively neutralizes so called market noise giving you access to accurate reversal signals. The indicator is very easy to use and has only one parameter responsible for signal generation. You can easily adapt the tool to any trading instrument of your choice and the size of the renko bar. I am always ready to provide extra support to help
75 USD
PZ Trend Trading
PZ TRADING SLU
4.75 (4)
Trend Trading is an indicator designed to profit as much as possible from trends taking place in the market, by timing pullbacks and breakouts. It finds trading opportunities by analyzing what the price is doing during established trends. [ Installation Guide | Update Guide | Troubleshooting | FAQ | All Products ] Trade financial markets with confidence and efficiency Profit from established trends without getting whipsawed Recognize profitable pullbacks, breakouts and early reversals The ind
175 USD
Moonwalker
Cengiz Erkoyuncu
5 (6)
The Moonwalker MT4 Indicator is a powerful tool that can revolutionize your trend trading strategy on Renko charts by tracking market trends, filtering out sudden fluctuations and market noise with advanced algorithms, and providing unique reliability. This enables you to trade with ease and confidence without the stress of constantly monitoring the markets. Moonwalker and Blitz Scalper are built on the same core strategy. While Moonwalker is specialized for Renko charts, Blitz Scalper is custo
250 USD
Ultimate Dynamic Levels
Hispraise Chinedum Abraham
4.88 (8)
Discounted at $199 for early birds! Prices may increase in the future. Read description below. Once you purchase, send a message to my inbox for manual. Introducing Ultimate Dynamic Levels - the BEST Entry Indicator for the Ultimate Sniper Dashboard! Extremely Low-Risk timely entries and high RR! Find the Ultimate Sniper Dashboard Here The most important ability for both beginner and pro traders is to tell exactly where and when a market is most likely to turn, and how to get in safely and
199 USD
The RSI / TDI alert dashboard allows you to monitor RSIs at once (selectable by you) on every major pair you trade. You can use it in two ways: 1. Select multiple time frames and the dash will show you when there are multiple time frames extended beyond normal trading conditions. A great indicator that price has pushed hard recently as it has achieved an overbought or oversold level across multiple time frames so a pullback or reversal is due soon. 2. Use one time frame (your favourite to trade)
49 USD
The ADR Reversal Indicator shows you at a glance where price is currently trading in relation to it's normal average daily range. You will get instant alerts via pop-up, email or push when price exceeds it's average range and levels above it of your choosing so you can jump into pullbacks and reversals quickly. The indicator draws horizontal lines on the chart at the average daily range extremes and also extensions above those levels which have mathematical probabilities attached to them of pric
49 USD
AW Trend Predictor
Alexander Nechaev
4.69 (32)
The combination of trend and breakdown levels in one system. An advanced indicator algorithm filters market noise, determines the trend, entry points, as well as possible exit levels. Indicator signals are recorded in a statistical module, which allows you to select the most suitable tools, showing the effectiveness of the signal history. The indicator calculates Take Profit and Stop Loss marks. Manual and instruction -> Here / MT5 version -> Here How to trade with the indicator:  Trading with T
55 USD
Forex Master Pattern MT4
Alberto Gauer Borrego
4.74 (19)
The Forex Master Pattern  is an alternative form of technical analysis that provides a framework which will help you to find and follow the hidden price pattern that reveals the true intentions of financial markets. This algorithm here does a good job detecting the Phase 1 of the Forex Master Pattern cycle, which is the contraction point (or Value).  On Phase 2 we get higher timeframe activation (also called Expansion), which is where price oscillates above and below the average price defined
49 USD
Trend Chief
Vladimir Stepanov
5 (4)
Trend Chief is an advanced indicator algorithm that filters out market noise, determines the trend, entry points as well as possible exit levels. Use shorter time frames for scalping and higher time frames for swing trading. Trend Chief is perfect for all Metatrader symbols: currencies, metals, crypto currencies, stocks and indices * How to use the Trend Chief indicator: - Get the main trend by looking at Daily and H4 charts - If the trend is up, go to smaller time frames like m15 and w
45 USD
FX Volume
Daniel Stein
4.67 (33)
Get your daily market update with details and screenshots via our Morning Briefing  here on mql5  and  on Telegram ! Do you want to become a constantly profitable 5-star forex trader? Then  get our Stein Investments trading tools  and send us a screenshot to get your personal invitation to our exclusive trading chat with 500+ members. FX Volume is the FIRST and ONLY volume indicator that provides a REAL insight into the market sentiment from a broker's point of view. It provides awesome insig
33 USD
ADR Alert Dashboard
LEE SAMSON
3.73 (11)
The ADR Alert Dashboard shows you at a glance where price is currently trading in relation to it's normal average daily range. You will get instant alerts via pop-up, email or push when price exceeds it's average range and levels above it of your choosing so you can jump into pullbacks and reversals quickly. The dash is designed to be placed on a blank chart and just sit in the background and alert you when levels are hit so you do not need to sit and watch it or even look at all! MT5 VERSION AV
49 USD
This dashboard is an alert tool for use with the market structure reversal indicator. It's primary purpose is to alert you to reversal opportunities on specific time frames and also to the re-tests of the alerts (confirmation) as the indicator does. The dashboard is designed to sit on a chart on it's own and work in the background to send you alerts on your chosen pairs and timeframes. It was developed after many people requested a dash to monitor multiple pairs and time frames at once rather th
49 USD
More from author
Multi Chart Crosshairs MT5
Robert Gerald Wood
5 (5)
This indicator is designed to make reviews of many charts on different timescales quicker, and easier to do. Track Time and Price across multiple charts Change Symbol on one chart and all other charts of the same symbol will be changed too. Easy to use, quick to master The indicator allows you to identify the price and time where the mouse pointer is on the current chart, across all other charts open on the same Symbol. This allows you to quickly see information on multiple charts whereas norma
30 USD
TheStrat Levels
Robert Gerald Wood
This indicator draws the prior Highs and Lows for multiple timeframes, and can display potential Take Profit and Stop Loss levels. In Rob Smith's # The Strat   terms,   these are potential entry points, or alternatively potential targets for open positions. I like to use them in both ways. On a lower timeframe, say 5 minutes to get a good entry on a daily or weekly level, and then as a potential target. Very small stops required giving an excellent risk/reward ratio. Please watch the DEMO video
90 USD
TheStrat Monitor
Robert Gerald Wood
5 (1)
If you've not already learnt about The Strat trading strategy , go google it now. I promise it won't be a waste of your time, and you will likely learn some new tricks whether you use it or not. OK, so now you know what TheStrat is, you will be able to understand what this indicator can do for you. Key Features In short, the Indicator will: Show Timeframe Continuity for all supported timeframes Supports two timeset views, Day trader and Swing trader Show when Full Timeframe Continuity is in pl
150 USD
TheStrat Patterns
Robert Gerald Wood
This indicator will draw patterns based on Rob Smith's The Strat as they emerge in real time on your chart. As price evolves, TheStrat offers 18 distinct price action patterns that can help you get good entries in the market. Each pattern involves two or three candles, and this indicator will draw a bounding box around the candles and name the pattern. The indicator also shows when a potential setup is forming, known by stratters as an Actionable signal. Candles Each candle is defined by i
90 USD
Range Exhaustion
Robert Gerald Wood
Range Exhaustion occurs when price meets or exceeds the expected range for the current period. At these levels, price starts to lose its momentum relative to earlier in the period, so its a good point to make sure you are not taking new positions. This indicator will show you where this is likely to happen on your chart, showing levels for Daily, Weekly and Monthly periods. When you see price exceeding these exhaustion levels, it's telling you that the momentum behind the move is very strong an
60 USD
This indicator draws the prior Highs and Lows for multiple timeframes, and can display potential Take Profit and Stop Loss levels. In Rob Smith's # The Strat  terms, these are potential entry points, or alternatively potential targets for open positions. I like to use them in both ways. On a lower timeframe, say 5 minutes to get a good entry on a daily or weekly level, and then as a potential target. Very small stops required giving an excellent risk/reward ratio. Key Features  - Levels from Ho
90 USD
Multi Chart Crosshairs
Robert Gerald Wood
5 (1)
This indicator is designed to make reviews of many charts on different timescales quicker, and easier to do. Track Time and Price across multiple charts Change Symbol on one chart and all other charts of the same symbol will be changed too. Easy to use, quick to master The indicator allows you to identify the price and time where the mouse pointer is on the current chart, across all other charts open on the same Symbol. This allows you to quickly see information on multiple charts whereas normal
30 USD
This indicator will draw patterns based on   Rob Smith's   The Strat   as they emerge in real time on your chart. As price evolves,   TheStrat   offers 18 distinct price action patterns that can help you get good entries in the market. Each pattern involves two or three candles, and this indicator will draw a bounding box around the candles and name the pattern. The indicator also shows when a potential setup is forming, known by stratters as an Actionable signal. Candles Each candle is de
90 USD
This indicator will draw a label above or below each candle based on   Rob Smith's   The Strat   as they develop over time on your chart. As price evolves, a candle can switch between three states. When the candle first opens, if it sits completely within the previous candles high and low, then it will start as a Type 1. As time moves on, if it breaks either the high or low of the previous candle, it will be come a type 2, and should the price action be volatile and directionless, it may then
30 USD
Markets really love round numbers and they often act as support in a falling market, or resistance as price rises. This indicator is designed to draw price levels at Round values. It does this automatically, but you also have the option to override that and determine the levels you wish to see. A round level can be as simple as steps of 10, so 10, 20, 30 etc or if you are working with Forex, maybe you want to see changes at 0.1 or 0.01. The indicator draws two classes of line, Major and Minor,
40 USD
Chart Drawing Cloner
Robert Gerald Wood
5 (4)
This Script allows you to copy drawing objects of any type, like trend lines, Fibonachi Retracements etc, to one or more other charts. By default, the script will copy all the objects on the current chart, that is the chart the script was applied to, to any other chart of the same Symbol currently loaded. Settings DestinationTimeframe When set to anything other than PERIOD_CURRENT, then it will copy the objects to any open chart of the same Symbol as the chart the script was applied to. If
FREE
When trading using The Strat , it is important to keep an eye on multiple timeframes. This indicator will show the Daily, Weekly, Monthly and Quarterly state of the current candle for each timeframe. A Circle icon shows that the candle on that timeframe is currently an Inside, or Type 1 in TheStrat terminology. An Inside Day candle is consolidating price action, and we are looking for a breakout of the range. A Triangle icon, pointing up or down, is a trending candle, or Type 2 in TheStrat termi
30 USD
When trading using  The Strat , it is important to keep an eye on multiple timeframes. This indicator will show the Daily, Weekly, Monthly and Quarterly state of the current candle for each timeframe. A Circle icon shows that the candle on that timeframe is currently an Inside, or Type 1 in TheStrat terminology. An Inside Day candle is consolidating price action, and we are looking for a breakout of the range. A Triangle icon, pointing up or down, is a trending candle, or Type 2 in TheStrat term
30 USD
A simple script that can delete all the drawing objects on a chart, or just the objects of a specific type. Settings: DeleteObjectsOfType By default the value will be blank which means ALL drawing objects on the chart will be deleted. If you only wish to delete specific types of drawing object, change this setting to the type of object to delete. For example, Fibonacci Retracement, Text, Label or Trend Line. Please see the demonstration video for more information.
FREE
This script allows you to toggle the "Show Trade Levels" option, but for the current chart only. Normally, you can only change the setting using the Options -> Chart menu for ALL charts, but this script allows you to do it for a SINGLE chart. I'm using it when I take screenshots, because most of the time I'm not trying to show the trades, just some functionality of one of my other tools. Iif you need that functionality, then this script is very helpful! If the script helps you, please let me
FREE
TheStrat Candles
Robert Gerald Wood
4 (1)
This indicator will draw a label above or below each candle based on   Rob Smith's   The Strat   as they develop over time on your chart. As price evolves, a candle can switch between three states. When the candle first opens, if it sits completely within the previous candles high and low, then it will start as a Type 1. As time moves on, if it breaks either the high or low of the previous candle, it will be come a type 2, and should the price action be volatile and directionless, it may then
30 USD
TheStrat FTFC
Robert Gerald Wood
FTFC refers to Full Timeframe Continuity as defined by Rob Smith's The Strat . This indicator draws two lines on the chart, one of the highest of the Quarterly, Monthly, Weekly, Daily or Hourly opening levels, and the second of the lowest of those values. This gives you a channel above or below which trading is more likely to be very strongly in one direction. Between the lines, price action will be choppier and you may with to use wider stops. A third dashed line is also drawn to show the mid p
50 USD
Round Price Levels
Robert Gerald Wood
Markets really love round numbers and they often act as support in a falling market, or resistance as price rises. This indicator is designed to draw price levels at Round values. It does this automatically, but you also have the option to override that and determine the levels you wish to see. A round level can be as simple as steps of 10, so 10, 20, 30 etc or if you are working with Forex, maybe you want to see changes at 0.1 or 0.01. The indicator draws two classes of line, Major and Minor, e
40 USD
Active Pivot Levels
Robert Gerald Wood
5 (1)
Pivot levels are a well established technical level that's recognised in every market. This indicator will draw the current Quarterly, Monthly, Weekly, Daily and four-hourly pivots on the chart, for any symbol. You can also show the Suppport and Resistance levels for each period and choose which to display from levels 1 to 4.   Choose the type of Pivot from: Standard Camarilla DeMark Woodie Fibonacci Please note, DeMark pivots have a single Support and Resistance level as per the original speci
50 USD
ATR Extremes
Robert Gerald Wood
Average True Range (ATR) is a commonly used indicator that measures the amount of movement in price over a set duration. However the value it gives is not defined within any sort of boundary, which makes using it for anything other than stop loss or take profit calculations, almost impossible. This indicator is your standard ATR indicator, but we have introduced percentile demarcations so you can see the extremes. You can choose between Percentiles and something we call Split Medians Percentile
30 USD
TheStrat FTFC MT5
Robert Gerald Wood
FTFC refers to Full Timeframe Continuity as defined by Rob Smith's  The Strat  . This indicator draws two lines on the chart, one of the highest of the Quarterly, Monthly, Weekly, Daily or Hourly opening levels, and the second of the lowest of those values. This gives you a channel above or below which trading is more likely to be very strongly in one direction. Between the lines, price action will be choppier and you may with to use wider stops. A third dashed line is also drawn to show the mid
50 USD
If you've not already learnt about The Strat trading strategy , go google it now. I promise it won't be a waste of your time, and you will likely learn some new tricks whether you use it or not. OK, so now you know what TheStrat is, you will be able to understand what this indicator can do for you. Key Features In short, the Indicator will: Show Timeframe Continuity for all supported timeframes Supports two timeset views, Day trader and Swing trader Show when Full Timeframe Continuity is in pl
150 USD
Pivot levels are a well established technical level that's recognised in every market. This indicator will draw the current Quarterly, Monthly, Weekly, Daily and four-hourly pivots on the chart, for any symbol. You can also show the Suppport and Resistance levels for each period and choose which to display from levels 1 to 4.   Choose the type of Pivot from: Standard Camarilla DeMark Woodie Fibonacci Please note, DeMark pivots have a single Support and Resistance level as per the original specif
50 USD
ATR Extremes MT5
Robert Gerald Wood
Average True Range (ATR) is a commonly used indicator that measures the amount of movement in price over a set duration. However the value it gives is not defined within any sort of boundary, which makes using it for anything other than stop loss or take profit calculations, almost impossible. This indicator is your standard ATR indicator, but we have introduced percentile demarcations so you can see the extremes. You can choose between Percentiles and something we call Split Medians Percentile
30 USD
Range Exhaustion occurs when price meets or exceeds the expected range for the current period. At these levels, price starts to lose its momentum relative to earlier in the period, so its a good point to make sure you are not taking new positions. This indicator will show you where this is likely to happen on your chart, showing levels for Daily, Weekly and Monthly periods. When you see price exceeding these exhaustion levels, it's telling you that the momentum behind the move is very strong an
60 USD
Filter:
No reviews
Reply to review
Version 1.20 2022.08.09
Fixed bug in calculation of Quarterly start where sometimes it failed to find an accurate start bar.
Version 1.10 2021.07.14
Fix for issues when changing the type of price to track.