Winshots ADX Trend Scanner
- Indicators
- Pawel Michalowski
- Version: 1.5
- Updated: 18 March 2024
- Activations: 5
Trading in the direction of a strong trend reduces risk and increases profit potential. In general the average directional index (ADX) is used to determine when the price is trending strongly. In many cases, it is the ultimate trend indicator! After all, the trend may be your friend, but it sure helps to know who your friends are.
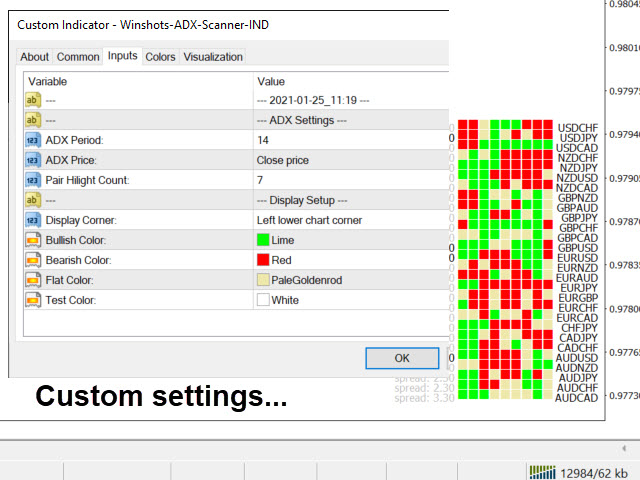
ADX is used to quantify trend strength. ADX calculations are based on a moving average of price range expansion over a given period of time. The default setting is 14 bars, although other time periods can be used. ADX can be used on any trading instrument such as forex pairs, stocks, mutual funds, exchange-traded funds, futures and crypto.
ADX is plotted as a single line with values ranging from a low of zero to a high of 100. ADX is non-directional; it registers trend strength whether price is trending up or down. The standard ADX indicator is usually plotted in the same window as the two directional movement indicator (DMI) lines, from which ADX is derived.
However when you use the standard ADX indicator it can get a little confusing with all the lines zigzagging and criss-crossing. Not only that, when you switch between different instruments and different time frames the ADX lines could be crossing in the opposite directions confusing you even more!
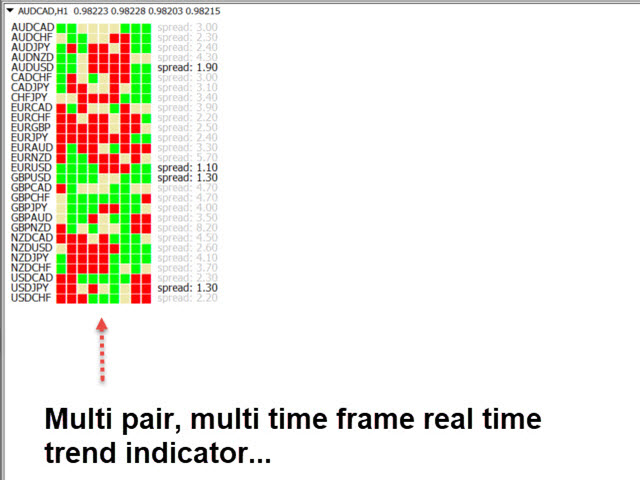
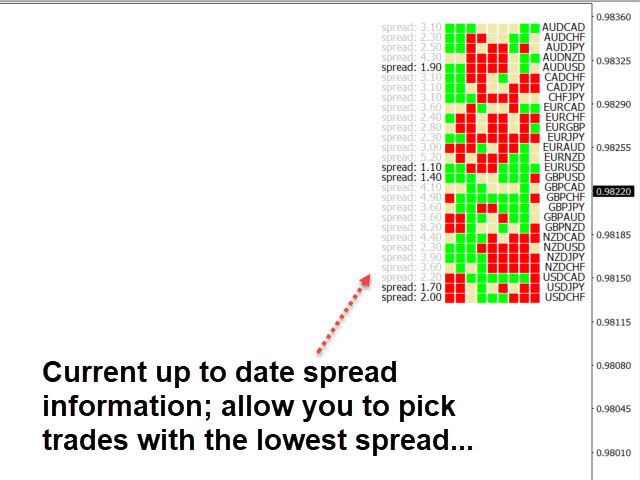
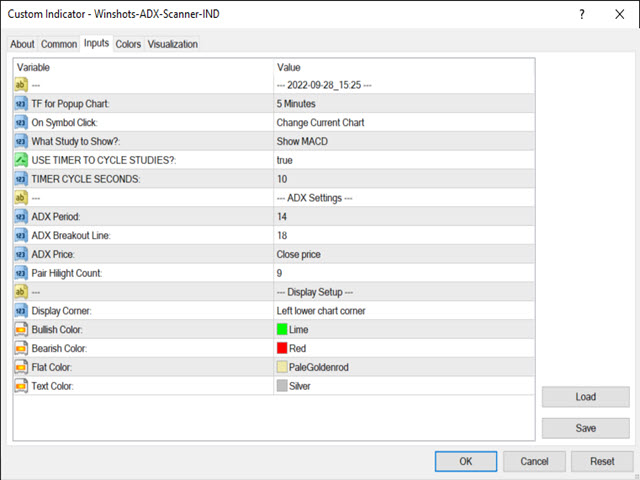
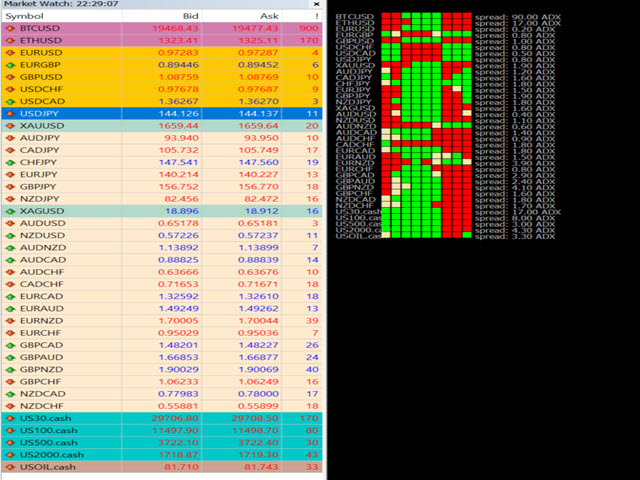
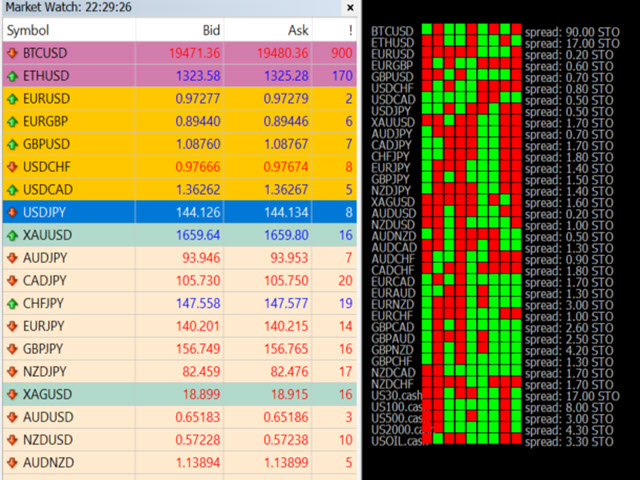
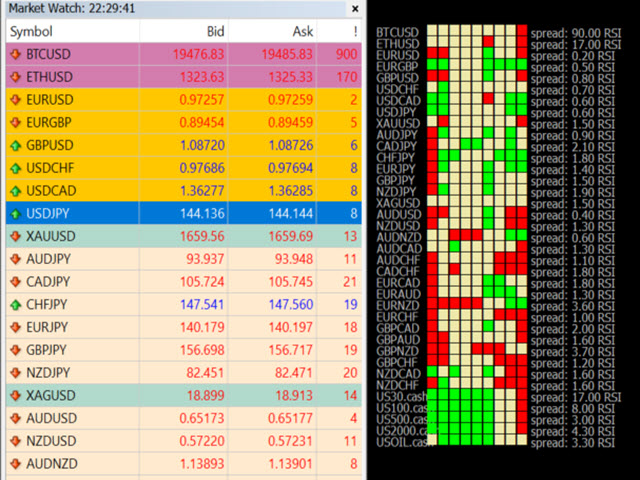
Winshots ADX Trend Scanner indicator takes care of this problem. In one simple view you can quickly determine the state of ADX trend on all time frames, on many different FX currency pairs!!! Yes you read that correctly. No more clicking through different time frames of different Forex pairs looking at ADX lines criss-crossing every which way like hot spaghetti. In addition to showing you exactly what the trend is on every FX pair and every time frame the Winshots ADX Trend Scanner indicator also highlights the FX pair that is strongly trending on ALL time frames. This additional feature allows you to quickly determine if there is a strong momentum in the market and if it's worth trading during your chosen time.

Purchased both adx trend indicators five stars