• Overview
  • Reviews
  • Comments (1)

MT4 high accuracy indicators5

It will be the best tool for you to make a profit!

Through unique algorithms

You're going to see an amazing amount of right trading signals

Make huge profits every day and realize more possibilities!


Like the car no money to buy it, the love of the girls dare not to pursue?Or the credit card bill is not paid, the rent does not have the extra money to settle?Or are you fed up with being bossed around by your boss and Hope to get more people's respect?Can't afford to buy the things you want ? wait....

If you face this, great, I'll tell you, the only way to solve this problem is to have enough money in your wallet

Can only professional traders and institutions be rich?absolutely wrong

Now let's solve this problem


Our view

This indicator is safe, reliable, reliable, easy to use and effective

Suitable for novice and professional traders

No more losses

Data does not lie, technology does not lie

Our metrics have the most objective analysis, the most logical intelligent machine and the most advanced algorithms

Help you filter the hot brain time to profit the most stable, make the most money

Entering a complex and unpredictable market

Our indicators are indispensable

From this precise investment, you will get anything you want

Conduct comprehensive data analysis for high-speed market to easily capture market changes

Fast access to investment ideas, let you in the market without any concerns

Become rich as soon as possible!


Indicator advantages

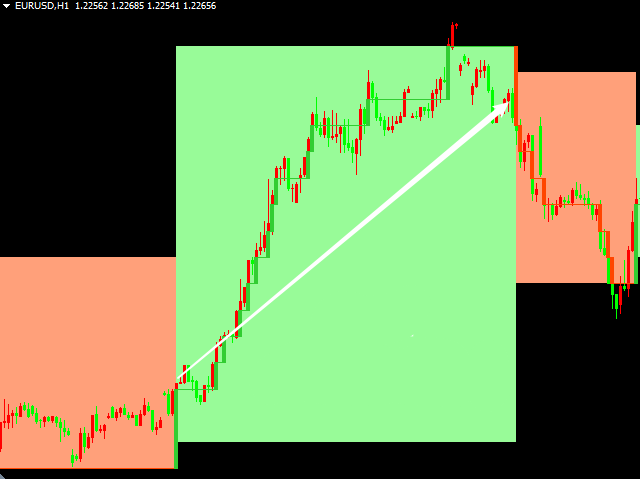
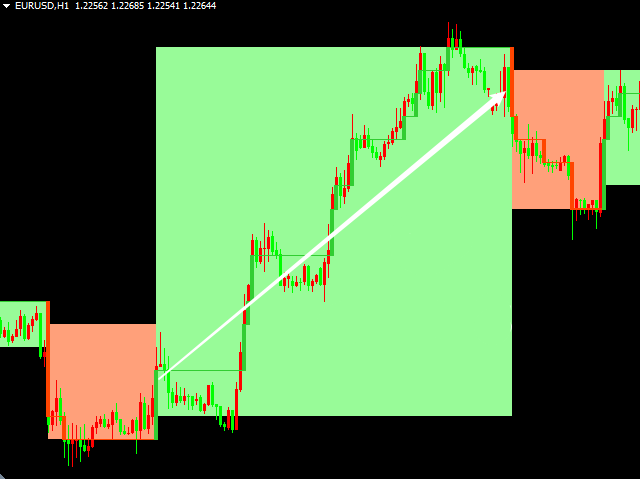
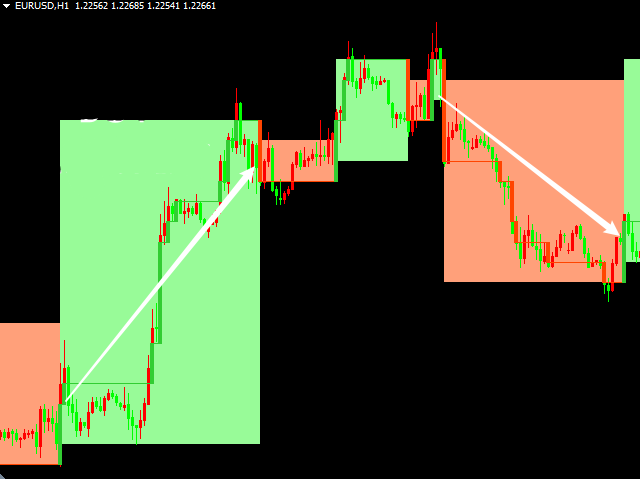
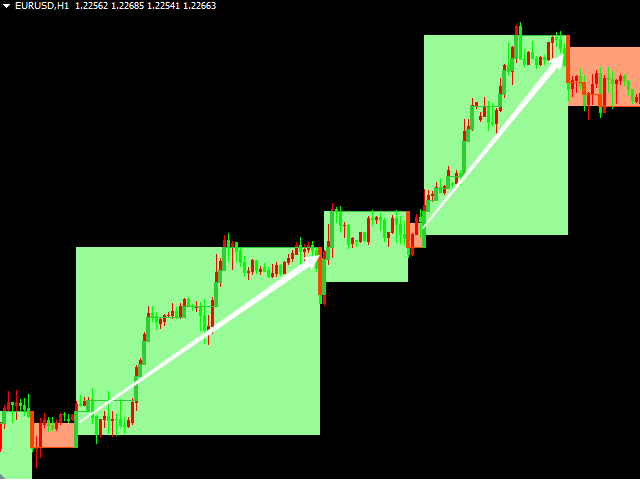
Amazing accuracy of over 90%

Quick start and identification of advantages and disadvantages

Filter and further improve your trading strategy

Simple and intuitive signal

Sensitive signal

Never redraw

Never recalculate

Give you the upper hand in the market


Product cycle and trading time applicable to indicators

Applicable mainstream currency pair

EUR/USD GBP/USD NZD/USD AUD/USD USD/JPY USD/CAD USD/CHF

Applicable mainstream cross currency pair

EUR/JPY EUR/GBP EUR/CHF EUR/CAD EUR/NZD

AUD/CAD AUD/NZD AUD/CHF AUD/JPY

GBP/JPY GBP/CHF

NZD/JPY

Applicable precious metal XAUUSD

Applicable crude oil XTIUSD XBRUSD


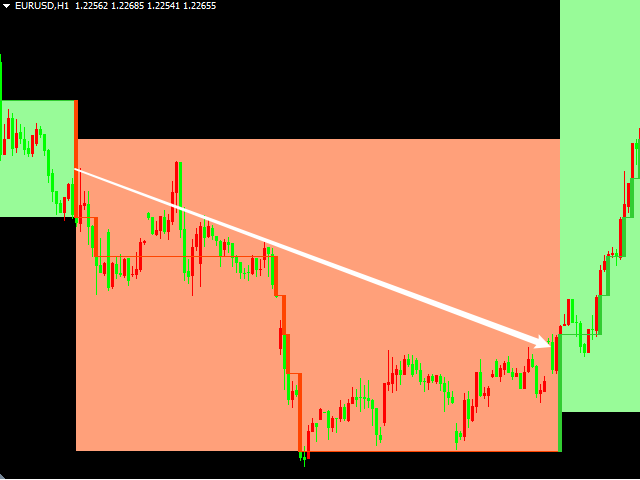
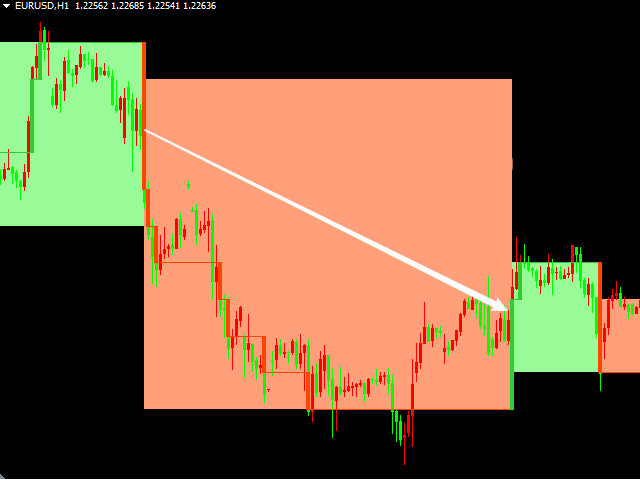
This indicator applies to transactions in any cycle and at any time


About after sales services

The millionaires foreign exchange development co., LTD., the company was established in 2002, is a global financial derivatives investment services and investment consulting services provider, the service coverage is widespread, has the first-class credit rating, with the mature financial management and experienced technical team, to provide convenient, safe and reliable financial derivatives investment services, to provide customers with perfect professional foreign exchange services.

We have been adhering to the simple and effective concept, and is committed to seeking benefits for global foreign exchange traders!


What you see in our company's metrics is the wisdom of a lot of experienced technicians and professional traders who have been evaluating them for a long time

If you have any questions about using our products, you can contact us at any time through MQL5 or by email,e-mail address:573300702@qq.com

Working hours: 2:00-10:00 in Greenwich, during working hours, we will solve your problem quickly and unconditionally


Important information display

Are you still suffering from headache and loss?

Then it can be stopped now

After a large amount of market research, we have developed this unique professional indicator, which is simple to use and only presents reasonable trading signals. It is applicable to any cycle, any time of trading, as well as any new or professional trader

This will be the best way for you to profit!


And you have to do is very simple, is to pick up the battleax, start to profit!


Other products

This product is only available on the MQL5 website

For more product experience, please visit our MQL5 home page

https://www.mql5.com/zh/users/573300702/seller#products


You'll see

Trend series

Volatility series

passageway series

Style series

Multi currency series

Transaction volume series

Support resistance level series

Multi-schedule series

Cluster series


Indicator function

Buy and sell according to the index color change


Recommended products
Blahtech Market Profile
Blahtech Limited
4.59 (17)
Was: $249    Now: $149   Market Profile defines a number of day types that can help the trader to determine market behaviour. A key feature is the Value Area, representing the range of price action where 70% of trading took place. Understanding the Value Area can give traders valuable insight into market direction and establish the higher odds trade. It is an excellent addition to any system you may be using. Blahtech Limited presents their Market Profile indicator for the MetaTrader community.
149 USD
Daily Candle Predictor is an indicator that predicts the closing price of a candle. The indicator is primarily intended for use on D1 charts. This indicator is suitable for both traditional forex trading and binary options trading. The indicator can be used as a standalone trading system, or it can act as an addition to your existing trading system. This indicator analyzes the current candle, calculating certain strength factors inside the body of the candle itself, as well as the parameters of
65 USD
Infinity Trend Pro
Yaroslav Varankin
1 (1)
This is a trend indicator without redrawing Developed instead of the binary options strategy (by the color of the Martingale candlestick) Also works well in forex trading When to open trades (binary options) A signal will appear in the place with a candle signaling the current candle It is recommended to open a deal for one candle of the current timeframe M1 and M5 When a blue dot appears, open a deal up When a red dot appears, open a trade down. How to open trades on Forex. When a signal is rec
1 000 USD
Owl smart levels
Sergey Ermolov
4.74 (38)
MT5 version  |  How to install?  | FAQ The Owl Smart Levels Indicator  is a complete trading system within the one indicator that includes such popular market analysis tools as  Bill Williams' advanced fractals , Valable ZigZag which builds  the correct wave structure  of the market, and  Fibonacci levels  which mark the exact levels of entry into the market and places to take profits. Detailed description of the strategy Instructions for working with the indicator Advisor-assistant in trading
97 USD
Cosmic Diviner X Planet
Olena Kondratenko
4 (2)
This unique multi-currency strategy simultaneously determines the strength of trends and market entry points, visualizing this using histograms on the chart. The indicator is optimally adapted for trading on the timeframes М5, М15, М30, Н1. For the convenience of users, the indicator renders the entry point (in the form of an arrow), recommended take profit levels (TP1, TP2 with text labels) and the recommended Stop Loss level. The take profit levels (TP1, TP2) are automatically calculated for
79 USD
Noize Absorption Index MT4
Ekaterina Saltykova
5 (1)
Noize Absorption Index - is the manual trading system that measures the difference of pressure between bears forces and bulls forces. Green line - is a noize free index that showing curent situation. Zero value of index shows totally choppy/flat market.Values above zero level shows how powerfull bullish wave is and values below zero measures bearish forces.Up arrow appears on bearish market when it's ready to reverse, dn arrow appears on weak bullish market, as a result of reverse expectation. S
199 USD
Heiken Ashi candle chart is an improved version of The Japanese candle chart, which can effectively filter the market "noise" of the Japanese candle chart. It is favored by many traders for its simplicity and intuition. For trend traders, the HA candle chart is a magic tool. Unlike the traditional Japanese candle chart, Heikenashi does not reflect the opening price, high price, low price and closing price of the market. Instead, Heikenashi calculates the value of a single K line in the dominant
30 USD
The Th3Eng PipFinite indicator is based on a very excellent analysis of the right trend direction with perfect custom algorithms. It show the true direction and the best point to start trading. With StopLoss point and Three Take Profit points. Also it show the right pivot of the price and small points to order to replace the dynamic support and resistance channel, Which surrounds the price. And Finally it draws a very helpful Box on the left side on the chart includes (take profits and Stop loss
89 USD
Market Shaver
Remi Passanello
Market Shaver   Market Scalper This indicator is part of the   RPTrade Pro Solutions  systems. Market Scalper  is a daily trend indicator using Price Action, Dynamic Support and Resistances. It's designed to be used by anyone, even the absolute beginner in trading can use it. NEVER repaints . Indications are given  from close to close . Designed to  be used alone , no other indicators are required. Gives you Clear and simple indications How does it work Market Shaver  is using Dual Ti
240 USD
Trendiness Index
Libertas LLC
5 (3)
"The trend is your friend" is one of the best known sayings in investing, because capturing large trendy price movements can be extremely profitable. However, trading with the trend is often easier said than done, because many indicators are based on price reversals not trends. These aren't very effective at identifying trendy periods, or predicting whether trends will continue. We developed the Trendiness Index to help address this problem by indicating the strength and direction of price trend
49 USD
A technical indicator that calculates its readings on trading volumes. In the form of a histogram, it shows the accumulation of the strength of the movement of the trading instrument. It has independent calculation systems for bullish and bearish directions. Works on any trading instruments and time frames. Can complement any trading system. The indicator does not redraw its values, the signals appear on the current candle. It is easy to use and does not load the chart, does not require additi
189 USD
Discover the power of precision and efficiency in your trading with the " Super Auto Fibonacci " MT4 indicator. This cutting-edge tool is meticulously designed to enhance your technical analysis, providing you with invaluable insights to make informed trading decisions. Key Features: Automated Fibonacci Analysis: Say goodbye to the hassle of manual Fibonacci retracement and extension drawing. "Super Auto Fibonacci" instantly identifies and plots Fibonacci levels on your MT4 chart, saving you tim
40 USD
Accuracy of correct predictions 83%! This indicator was tested on the basis of real statistics for all market indicators according to indicators for 3 months of trading. 83% of correct trade forecasts for usd / jpy on the m30 time frame were received on our statistics! if you have any questions, please contact us in private messages or in discussions under this indicator and we will figure it out and help any questions will arise personal messages or in discussions under this indicator As soon
100 USD
VR Cub
Vladimir Pastushak
VR Cub is an indicator for getting high-quality entry points. The indicator was developed to facilitate mathematical calculations and simplify the search for entry points into a position. The trading strategy for which the indicator was written has been proving its effectiveness for many years. The simplicity of the trading strategy is its great advantage, which allows even novice traders to successfully trade with it. VR Cub calculates position opening points and Take Profit and Stop Loss targe
49 USD
MT4 indicators. Three levels of Fibonacci support and resistance levels are automatically drawn. They are: Month Level: Medium Orchid Weekly level: Orange Red Dayline level: Turquoise Color can be adjusted by parameters. MT5 Version: https://www.mql5.com/EN/market/product/80068 This indicator is mainly used to analyze future support and resistance levels for better trade analysis. If the support level is effectively supported for many times, the market will break through the previou
40 USD
Master Scalping M1 is an innovative indicator that uses an algorithm to quickly and accurately determine the trend.The indicator calculates the time of opening and closing positions, the indicator's algorithms allow you to find the ideal moments to enter a deal (buy or sell an asset), which increase the success of transactions for most traders. Benefits of the indicator: Easy to assemble, does not overload the chart with unnecessary information. Can be used as a filter for any strategy. Works on
30 USD
Shark Deal Book
Philip Pankaj Suthagar
4 (3)
Term  "shark"  in the business world denotes a high volume investor who just made a good investment in a highly Potential business deal.So, sharks are the ones who make the market move. In our case, if an American shark bought a Japanese company, he/she has to convert American dollars into Japanese yen to make the deal. So, the demand for the Japanese yen will increase sharply. Thus USD/JPY will go short rapidly if the deal was from the shark. Another example, In the case of forex, if fed increa
199 USD
Advanced Trend Regime
Shellard Securities (Pty) Ltd
The indicator has been designed to function on any time-frame and any pair.   This regime filter will help the trader better evaluate whether the current market is trending, and in which direction. It quickly reacts to changes in market dynamics using a series of advanced calculations. The user is able to select whether the calculation remains standard, or if a further filter constraint is added to the calculation.   A Yellow moving average of the signal has been included for the trader to smoot
100 USD
Stepping Trend
Mpendulo Chiliza
The Stepping Trend Indicator     The Steppi ng Trend indicator uses the  average true range  (ATR indicator) in its calculation. This gives you control to set your own average true range period, I set the Default as 10.   Indicator Details. Green Arrow Up: This means you are at the starting point of a new bullish trend, it’s time to buy.   Red  Arrow  Down : This means you are at the starting point of a new  bearish  trend, it’ s time to sell .   What if you miss the Arrow Signal?   No
200 USD
This MT4 indicator has been designed to be used on any currency pair and any time frame . It has the scalper and swing trader in mind.  The indicator looks for short-term high-probability reversals in price and will indicate to you to go long (buy) or short (sell) if you see a green or red arrow next to the current candlestick respectively. The indicator provides the best trading opportunities to you during the active trading hours of London and New York, but it will continue to give signals all
199 USD
BoxChart MT4
Evgeny Shevtsov
4.57 (7)
The market is unfair if only because 10% of participants manage 90% of funds. An ordinary trader has slim changes to stand against these "vultures". This problem can be solved. You just need to be among these 10%, learn to predict their intentions and move with them. Volume is the only preemptive factor that faultlessly works on any timeframe and symbol. First, the volume appears and is accumulated, and only then the price moves. The price moves from one volume to another. Areas of volume accumu
33 USD
This indicator monitors the market for a flat state and possible breakout. The flat state is detected as a predefined number of consecutive bars during which price fluctuates inside a small range. If one of the next bars closes outside the range, breakout is signaled. The indicator shows 3 lines: blue - upper bound of flat ranges AND consecutive breakout areas; red - lower bound of flat ranges AND consecutive breakout areas; yellow - center of flat ranges (NOT including breakout areas). When a b
30 USD
The Chaikin Oscillator is a technical indicator developed by Marc Chaikin that combines price and volume data to measure the accumulation and distribution of a financial instrument. It aims to identify potential buying and selling opportunities in the market. The Chaikin Oscillator is calculated by subtracting a 10-day exponential moving average of the Accumulation Distribution Line (ADL) from a 3-day exponential moving average of the ADL. Here's how to use the Chaikin Oscillator indicator in tr
250 USD
Title : Market Bias Indicator - Oscillator-Based Trading Tool Introduction : Discover the potential of the "Market Bias Indicator," a revolutionary oscillator-based trading tool designed for precise market analysis. If you're in search of a robust alternative to traditional bias indicators, your quest ends here. Market Bias Indicator offers unparalleled accuracy in identifying market sentiment and is your gateway to confident trading decisions. Recommended Trading Pairs : Market Bias Indicator i
50 USD
Power Renko MT4
Pierce Vallieres
Power Renko is an indicator which plots Renko bricks underneath the chart using a histogram. You can select the brick size and the timeframe of the Renko bricks as well as whether or not to use the close price or the high/low price of the candles. Renko bricks are based on price alone, not time, therefor the Renko bricks will not be aligned with the chart's time. They are extremely useful for trend trading and many different strategies can be formed from them. Buffers are provided allowing you t
30 USD
RiverScope Lite automatically determines the nearest most important price levels and support and resistance zones in history, it also identifies a large number of price action patterns (the lite version is limited to 10, while the full version has 30+). The support and resistance levels are determined based on an algorithm that calculates and filters the historical values of the price, its movement character, volumes, etc. It displays the current situation, therefore the nearest levels change in
30 USD
Gold Phoenix
Yaroslav Varankin
The perfect tool for Scalng in the Forex markets You can trade both from signal to signal and using take profit  The algorithm does not use Zigzag!  No redrawing!  This is a channel instrument that uses a moving average as a filter. Moving Average  There are 2 parameters for the settings Ma Period = 5 period Moving Average  Channel 1.0 distance of channel lines from the chart Price Signal Filter - calculation of signal opening and filter There is a complete set of Alert There is a multi-timefram
400 USD
Trade with Gann on your side!! MASTER CIRCLE 360 CIRCLE CHART, originally created by Gann admitted that this is “The Mother of all charts”. It is one of the last studies that this great trader left for us. The numeric tab le is apparently quite simple like all the tables and is based on square numbers, the SQUARE OF 12 and is by evolution, one of the most important square numbers. Here we can find CYCLE, PRICE AND TIME thanks to angles and grades, to show past and future support and resistance.
149.99 USD
The indicator builds current quotes, which can be compared with historical ones and on this basis make a price movement forecast. The indicator has a text field for quick navigation to the desired date. Options: Symbol - selection of the symbol that the indicator will display; SymbolPeriod - selection of the period from which the indicator will take data; IndicatorColor - indicator color; Inverse - true reverses quotes, false - original view; Next are the settings of the te
55 USD
PipFinite Exit EDGE
Karlo Wilson Vendiola
4.89 (158)
Did You Have A Profitable Trade But Suddenly Reversed? In a solid strategy, exiting a trade is equally important as entering. Exit EDGE helps maximize your current trade profit and avoid turning winning trades to losers. Never Miss An Exit Signal Again Monitor all pairs and timeframes in just 1 chart www.mql5.com/en/blogs/post/726558 How To Trade You can close your open trades as soon as you receive a signal Close your Buy orders if you receive an Exit Buy Signal. Close your Sell orde
88 USD
Buyers of this product also purchase
Currently 20% OFF ! Best Solution for any Newbie or Expert Trader! This dashboard software is working on 28 currency pairs plus one. It is based on 2 of our main indicators (Advanced Currency Strength 28 and Advanced Currency Impulse). It gives a great overview of the entire Forex market plus Gold or 1 indices. It shows Advanced Currency Strength values, currency speed of movement and signals for 28 Forex pairs in all (9) timeframes. Imagine how your trading will improve when you can watch the e
199 USD
Price Action Entry Alerts
Stephen Sanjeeve Sahayam
5 (2)
This indicator screens every bar for buying or selling pressure and identifies 4 types of candle patterns with the highest volume. These candles are then filtered using several linear filters to show Buy or Sell signals. Signals work best, in conjunction with higher time frame direction and when traded during high volume hours. All filters are customizable and work independently. Can view signals of a single direction with the click of a button. This indicator also comes loaded with the most im
225 USD
The Precision Index Oscillator (Pi-Osc) by Roger Medcalf of Precision Trading Systems First of all, if you have any questions please contact me via my website which you can find by searching the above title. Version 2 has been carefully recoded to be super fast to load up on your chart and some other technical improvements have been incorporated to enhance experience. Pi-Osc was created to provide accurate trade timing signals designed to find extreme   exhaustion points, the points that markets
597 USD
Shepherd Harmonic Pattern
Abdullah Alrai
4.45 (33)
This indicator will detect harmonic patterns that are drawn on the chart by manual and automatic methods. You can see user manual from this link: Add Your review And contact us to get it There is a free version to try this product on mt4. You can use it to detect Gartley and Nenstar patterns: https://www.mql5.com/en/market/product/30181 You can buy the full MT4 version from: https://www.mql5.com/en/market/product/15212 Notes Indicator has control panel and it will save every (chart & timeframe
1 250 USD
Ultimate Sniper Dashboard
Hispraise Chinedum Abraham
4.67 (24)
Currently on 10% Discount! Prices may increase in the future! Read description below! Once you purchase, send a message to my inbox for manual and starter kit. Best Entry System for Ultimate Sniper Dashboard: ULTIMATE DYNAMIC LEVELS. (Please Check my products) The Ultimate Sniper Dashboard ONLY works on live markets due to MT4 multicurrency testing limits. Introducing the Ultimate-Sniper Dashboard! Our very best which contains both HA-Sniper, MA-Sniper. and many special modes. The Ultimate S
349 USD
Please send me Direct message on MQL5 CHAT after purchasing the Indicator for Training and Installation Support There are some additional files that is important to use with the Indicator . So be sure to contact me after purchasing the Indicator So that I can add you for training and support . If you find any difficulty with installation then send me Direct message here So that I can connect with you via Anydesk or Teamview for the product installation. " Smart Order Block Indicator " to find
249 USD
ON Trade Optuma Astro
Abdullah Alrai
5 (2)
This is an astronomy indicator for the MT4 platform like optuma program that performs a variety of functions. It uses complex algorithms to perform its own calculations, which are so accurate. The indicator has a panel that provides astronomical information such as planets' geo/heliocentric cords, distance of sun/earth, magnitude, elongation, constellation, ecliptic cords, equatorial cords, and horizontal cords depending on  the vertical line that generated by the indicator depend on the time va
1 250 USD
Cycle Sniper
Elmira Memish
4.5 (32)
NEW YEAR SALE PRICE FOR LIMITED TIME!!! Please contact us after your purchase and we will send you the complimentary indicators to complete the system. Cycle Sniper is not a holy grail but when you use it in a system which is explained in the videos, you will feel the difference. If you are not willing to focus on the charts designed with Cycle Sniper and other free tools we provide, we recommend not buying this indicator. We recommend watching the videos about the indiactor and system before
200 USD
Volume by Price MT4
Brian Collard
5 (14)
The Volume by Price Indicator for MetaTrader 4 features Volume Profile and Market Profile TPO (Time Price Opportunity). Get valuable insights out of currencies, equities and commodities data. Gain an edge trading financial markets. Volume and TPO histogram bar, line and metric charts. TPO letter and block marker charts including split structures. Positioning and styling options to suit the user's needs and context. Volume Profile and Market Profile TPO Point of Control (VPOC and TPOC), Imbalanc
259 USD
Introduction to Fractal Pattern Scanner Fractal Indicator refers to the technical indicator that makes use of the fractal geometry found in the financial market. Fractal Pattern Scanner is the advanced Fractal Indicator that brings the latest trading technology after the extensive research and development work in the fractal geometry in the financial market. The most important feature in Fractal Pattern Scanner is the ability to measure the turning point probability as well as the trend probabi
185 USD
TPA True Price Action indicator reveals the true price action of the market makers through 100% non-repainting signals (except early signals mode) strictly at the close of a candle! TPA shows entries and re-entries, every time the bulls are definitely stronger than the bears and vice versa. Not to confuse with red/green candles. The shift of power gets confirmed at the earliest stage and is ONE exit strategy of several. There are available now two free parts of the TPA User Guide for our custo
168 USD
Welcome to the world of SMC (Smart Money Concepts) Trading, where we empower traders with the tools and knowledge to make smarter trading decisions. Our latest addition to our suite of trading tools is the SMC Trading Pro indicator, version 1.0. Key Features: Major Market Structure Identification with BODY break. Order Block must be in Major Swing ( not Small Swing ). Order Block with Fair Value Gap Detection. Order Block in Discount | Premium zone. Filter for only Bullish, Bearish or All Order
199 USD
Robot Choppiness
Diego Mauricio Padilla Mendez
5 (1)
The Choppines robot is loaded as an indicator in the MT4 indicators folder It is recommended to use a candle timing of 5 minutes, the recommended robot expiration time is 5 minutes. The robot can be configured to send signals to MT2, MX2, PRICEPRO platforms. To send signals, you must use the connector program of the platform we want to work with. To install on the connector, perform the following procedure (an image is attached describing the configuration with the MT2 platform connector)
499 USD
MR Volume POC Levels 4
Sergey Khramchenkov
5 (3)
The most crucial price level in any "Volume Profile" is the "Point of Control" . Is the price level with the highest traded volume. And mainly, is the level where the big guys start there their positions, so it's an accumulation/distribution level for smart money. The idea of the indicator arose after the "MR Volume Profile Rectangles" indicator was made. When creating the "MR Volume Profile Rectangles" indicator, we spent a lot of time comparing the volumes with those from the volume profil
150 USD
Elliott Wave Trend was designed for the scientific wave counting. This tool focuses to get rid of the vagueness of the classic Elliott Wave Counting using the guideline from the template and pattern approach. In doing so, firstly Elliott Wave Trend offers the template for your wave counting. Secondly, it offers Wave Structural Score to assist to identify accurate wave formation. It offers both impulse wave Structural Score and corrective wave Structure Score. Structural Score is the rating to sh
200 USD
Introduction Excessive Momentum Indicator is the momentum indicator to measure the excessive momentum directly from raw price series. Hence, this is an extended price action and pattern trading. Excessive Momentum Indicator was originally developed by Young Ho Seo. This indicator demonstrates the concept of Equilibrium Fractal Wave and Practical Application at the same time. Excessive Momentum detects the market anomaly. Excessive momentum will give us a lot of clue about potential reversal and
200 USD
Introduction to X3 Chart Pattern Scanner X3 Cherart Pattern Scanner is the non-repainting and non-lagging indicator detecting X3 chart patterns including Harmonic pattern, Elliott Wave pattern, X3 patterns, and Japanese Candlestick patterns. Historical patterns match with signal patterns. Hence, you can readily develop the solid trading strategy in your chart. More importantly, this superb pattern scanner can detect the optimal pattern of its kind. In addition, you can switch on and off individu
250 USD
Introduction to Chart Pattern MT Chart Pattern MT is a chart pattern scanner to detect the triangle pattern, falling wedge pattern, rising wedge pattern, channel pattern and so on. Chart Pattern MT uses highly sophisticated chart pattern detection algorithm. However, we have designed it in the easy to use with intuitive user interface. Chart Pattern MT will show all the patterns in your chart in the most efficient format for your trading. You do not have to do tedious manual pattern detection an
180 USD
I have been trading for some time now and always find it a difficulty remembering the timing of the various market opening hours at the other part of the world (especially, when it comes to daylight saving), but could not find any decent indicator online that could help. And it is for this reason that gives birth to this indicator, which I have spent much time, effort and thinking. As many already know that opening of a certain marketplace, depending on which currency pair, has an impact on the
200 USD
Scientific trade
Aleksey Ivanov
5 (1)
An extremely convenient indicator that truly makes the process of making money on the exchange easy. It is based on the scientifically rigorous theory of the market developed by the author, the beginning of which is presented here .                The full algorithm of this indicator operation is presented in the article .               The indicator calculates the most probable price movement trajectory and displays it on the chart. Based on the predicted price movement trajectory
179 USD
Introducing ON Trade Waves Patterns Harmonic Elliot Wolfe, an advanced indicator designed to detect various market patterns using both manual and automated methods. Here's how it works: Harmonic Patterns: This indicator can identify harmonic patterns that appear on your chart. These patterns are essential for traders practicing harmonic trading theory, as popularized by Scott Carney's book "Harmonic Trading vol 1&2." Whether you draw them manually or rely on automated detection, ON Trade Waves
800 USD
TheStrat Monitor
Robert Gerald Wood
5 (1)
If you've not already learnt about The Strat trading strategy , go google it now. I promise it won't be a waste of your time, and you will likely learn some new tricks whether you use it or not. OK, so now you know what TheStrat is, you will be able to understand what this indicator can do for you. Key Features In short, the Indicator will: Show Timeframe Continuity for all supported timeframes Supports two timeset views, Day trader and Swing trader Show when Full Timeframe Continuity is in pl
150 USD
Cyclical indicator for trading and predicting the direction of the market. Shows the cyclical behavior of the price in the form of an oscillator. Gives signals for opening deals when rebounding from the upper and lower boundaries of the oscillator. In the form of a histogram, it shows the smoothed strength of the trend. Will complement any trading strategy, from scalping to intraday. The indicator does not redraw. Suitable for use on all symbols/instruments. Suitable time frames for short-term
197 USD
Diamond Grail
Dmitriy Kashevich
The universal indicator Diamond Grail which received such a name is not so simple! The indicator has been tested for over a year by our experts! One of the best arrow indicators that is perfect for binary options and forex trading, If you trade on binary options, the best ragtime for it is from 3 minutes to a maximum of 5 minutes An arrow appears on the previous candle. If you trade forex, then the opening time from candle to candle Forex result From 40 To 1324 pips! Profitability
800 USD
The Nihilist 5.0 Indicator includes Forexalien and Nihilist Easy Trend trading strategies and systems. It is composed of an MTF Dashboard where you can analyze the different input possibilities of each strategy at a glance. It has an alert system with different types of configurable filters. You can also configure which TF you want to be notified on your Metatrader 4 platform and Mobile application The indicator has the option to view how could be a TP and SL by using ATR or fixed points, even
299 USD
Ultimate Dynamic Levels
Hispraise Chinedum Abraham
4.88 (8)
Discounted at $199 for early birds! Prices may increase in the future. Read description below. Once you purchase, send a message to my inbox for manual. Introducing Ultimate Dynamic Levels - the BEST Entry Indicator for the Ultimate Sniper Dashboard! Extremely Low-Risk timely entries and high RR! Find the Ultimate Sniper Dashboard Here The most important ability for both beginner and pro traders is to tell exactly where and when a market is most likely to turn, and how to get in safely and
199 USD
PTS Divergence Buy Finder
PrecisionTradingSystems
PTS - Divergence Buy Finder by Precision Trading Systems Precision Divergence Finder was designed to find market bottoms with pinpoint accuracy and frequently does so. In technical analysis, the art of picking bottoms is generally much easier than picking tops this item is designed precisely for this task. After a bullish divergence is identified then it is wise to wait for the trend to turn up before buying. You can use a 10 or 20 bar high to enter or a moving average 15-30 to be rising to id
397 USD
Candle Power Pro
Thushara Dissanayake
4.33 (6)
Unlock the power of real volume information with the Candle Power Pro indicator. This dynamic tool captures the actual volume data for each candle and presents it as a percentage of the total volume. By doing so, it empowers you to discern the ongoing struggle between buyers and sellers in the market. The Candle Power Pro displays the battle between buyers and sellers as a percentage of the total volume, giving you valuable insights into market dynamics. You can easily confirm breakouts by anal
450 USD
Supply and Demand Dashboard PRO
Bernhard Schweigert
4.81 (21)
Currently 20% OFF ! This dashboard is a very powerful piece of software working on multiple symbols and up to 9 timeframes. It is based on our main indicator (Best reviews:   Advanced Supply Demand ). The dashboard gives a great overview. It shows: Filtered Supply and Demand values including zone strength rating, Pips distances to/and within zones, It highlights nested zones, It gives 4 kind of alerts for the chosen symbols in all (9) time-frames. It is highly configurable for your personal
199 USD
Introducing Shepherd Numerology Levels Indicator: Unlock the Hidden Patterns of Price Movement Discover a revolutionary approach to trading with the Shepherd Numerology Levels Indicator. This innovative tool combines the ancient wisdom of numerology with cutting-edge trading techniques to help you identify key support and resistance levels on your charts. By harnessing the power of the Square of Nine method, this indicator offers a unique perspective on market dynamics, allowing you to make mor
250 USD
More from author
Indicator function      As shown in the figure, choosing to buy or sell at the dotted line of the indicator, and following the trend with the Angle of the channel up and down, are equally effective in bands and trends It is best to use 1H for testing   About update questions In order to be more suitable for market fluctuations, the company regularly updates the indicators   Product cycle and trading time applicable to indicators Applicable mainstream currency pair EUR/USD GBP/USD NZD/USD AUD/US
129 USD
Indicator function   When the color of the indicator changes, it will send you a long short notice It is best to use 1H for testing   About update questions In order to be more suitable for market fluctuations, the company regularly updates the indicators   Product cycle and trading time applicable to indicators Applicable mainstream currency pair EUR/USD GBP/USD NZD/USD AUD/USD USD/JPY USD/CAD USD/CHF Applicable mainstream cross currency pair EUR/JPY EUR/GBP EUR/CHF EUR/CAD EUR/NZD AUD/CAD A
149 USD
Indicator function   Choose to buy or sell at the critical point of indicator zero It is best to use 1H for testing   About update questions In order to be more suitable for market fluctuations, the company regularly updates the indicators   Product cycle and trading time applicable to indicators Applicable mainstream currency pair EUR/USD GBP/USD NZD/USD AUD/USD USD/JPY USD/CAD USD/CHF Applicable mainstream cross currency pair EUR/JPY EUR/GBP EUR/CHF EUR/CAD EUR/NZD AUD/CAD AUD/NZD AUD/CHF AUD
129 USD
Indicator function This index buys and sells according to the color, using time is one hour,Please run the test on a 30-minute cycle It is best to use 1H for testing   About update questions In order to be more suitable for market fluctuations, the company regularly updates the indicators   Product cycle and trading time applicable to indicators Applicable mainstream currency pair EUR/USD GBP/USD NZD/USD AUD/USD USD/JPY USD/CAD USD/CHF Applicable mainstream cross currency pair EUR/JPY EUR/GBP E
149 USD
Indicator function Buy and sell by indicator color It is best to use 1H for testing   About update questions In order to be more suitable for market fluctuations, the company regularly updates the indicators   Product cycle and trading time applicable to indicators Applicable mainstream currency pair EUR/USD GBP/USD NZD/USD AUD/USD USD/JPY USD/CAD USD/CHF Applicable mainstream cross currency pair EUR/JPY EUR/GBP EUR/CHF EUR/CAD EUR/NZD AUD/CAD AUD/NZD AUD/CHF AUD/JPY GBP/JPY GBP/CHF NZD/JPY App
149 USD
Indicator function Moving averages cross a short-term buy and sell, moving averages cross a 50 horizontal line a long-term buy and sell It is best to use 1H for testing   About update questions In order to be more suitable for market fluctuations, the company regularly updates the indicators   Product cycle and trading time applicable to indicators Applicable mainstream currency pair EUR/USD GBP/USD NZD/USD AUD/USD USD/JPY USD/CAD USD/CHF Applicable mainstream cross currency pair EUR/JPY EUR/GB
149 USD
Indicator function Select a trend based on the Angle above and below the indicator curve, and choose overbought and oversold when an action crosses the trend line It is best to use 1H for testing   About update questions In order to be more suitable for market fluctuations, the company regularly updates the indicators   Product cycle and trading time applicable to indicators Applicable mainstream currency pair EUR/USD GBP/USD NZD/USD AUD/USD USD/JPY USD/CAD USD/CHF Applicable mainstream cross c
149 USD
Indicator function Choose buy and sell at horizontal line 0 It is best to use 1H for testing   About update questions In order to be more suitable for market fluctuations, the company regularly updates the indicators   Product cycle and trading time applicable to indicators Applicable mainstream currency pair EUR/USD GBP/USD NZD/USD AUD/USD USD/JPY USD/CAD USD/CHF Applicable mainstream cross currency pair EUR/JPY EUR/GBP EUR/CHF EUR/CAD EUR/NZD AUD/CAD AUD/NZD AUD/CHF AUD/JPY GBP/JPY GBP/CHF NZ
149 USD
Indicator function Buy and sell at the 0.19 threshold.Notice that the level number is 0.19! It is best to use 1H for testing   About update questions In order to be more suitable for market fluctuations, the company regularly updates the indicators   Product cycle and trading time applicable to indicators Applicable mainstream currency pair EUR/USD GBP/USD NZD/USD AUD/USD USD/JPY USD/CAD USD/CHF Applicable mainstream cross currency pair EUR/JPY EUR/GBP EUR/CHF EUR/CAD EUR/NZD AUD/CAD AUD/NZD AU
149 USD
Indicator function Choose to buy and sell according to the system prompts It is best to use 1H for testing   About update questions In order to be more suitable for market fluctuations, the company regularly updates the indicators   Product cycle and trading time applicable to indicators Applicable mainstream currency pair EUR/USD GBP/USD NZD/USD AUD/USD USD/JPY USD/CAD USD/CHF Applicable mainstream cross currency pair EUR/JPY EUR/GBP EUR/CHF EUR/CAD EUR/NZD AUD/CAD AUD/NZD AUD/CHF AUD/JPY GBP/
149 USD
Indicator function Choose to go long or short when crossing the EMA or crossing the 0 line below It is best to use 1H for testing   About update questions In order to be more suitable for market fluctuations, the company regularly updates the indicators   Product cycle and trading time applicable to indicators Applicable mainstream currency pair EUR/USD GBP/USD NZD/USD AUD/USD USD/JPY USD/CAD USD/CHF Applicable mainstream cross currency pair EUR/JPY EUR/GBP EUR/CHF EUR/CAD EUR/NZD AUD/CAD AUD/N
149 USD
Indicator function Please set the level line with a value of 0 and buy and sell at the level line of 0 It is best to use 1H for testing   About update questions In order to be more suitable for market fluctuations, the company regularly updates the indicators   Product cycle and trading time applicable to indicators Applicable mainstream currency pair EUR/USD GBP/USD NZD/USD AUD/USD USD/JPY USD/CAD USD/CHF Applicable mainstream cross currency pair EUR/JPY EUR/GBP EUR/CHF EUR/CAD EUR/NZD AUD/CAD
129 USD
Indicator function Choose to buy and sell according to the system prompts It is best to use 1H for testing   About update questions In order to be more suitable for market fluctuations, the company regularly updates the indicators   Product cycle and trading time applicable to indicators Applicable mainstream currency pair EUR/USD GBP/USD NZD/USD AUD/USD USD/JPY USD/CAD USD/CHF Applicable mainstream cross currency pair EUR/JPY EUR/GBP EUR/CHF EUR/CAD EUR/NZD AUD/CAD AUD/NZD AUD/CHF AUD/JPY GBP/
149 USD
Indicator function Choose to buy and sell where the EMA crosses It is best to use 1H for testing   About update questions In order to be more suitable for market fluctuations, the company regularly updates the indicators   Product cycle and trading time applicable to indicators Applicable mainstream currency pair EUR/USD GBP/USD NZD/USD AUD/USD USD/JPY USD/CAD USD/CHF Applicable mainstream cross currency pair EUR/JPY EUR/GBP EUR/CHF EUR/CAD EUR/NZD AUD/CAD AUD/NZD AUD/CHF AUD/JPY GBP/JPY GBP/
129 USD
Indicator function Choose to buy and sell where the yellow EMA crosses zero It is best to use 1H for testing   About update questions In order to be more suitable for market fluctuations, the company regularly updates the indicators   Product cycle and trading time applicable to indicators Applicable mainstream currency pair EUR/USD GBP/USD NZD/USD AUD/USD USD/JPY USD/CAD USD/CHF Applicable mainstream cross currency pair EUR/JPY EUR/GBP EUR/CHF EUR/CAD EUR/NZD AUD/CAD AUD/NZD AUD/CHF AUD/JPY GB
149 USD
Indicator function Choose to buy and sell where the yellow moving average crosses zero. Arrow for overbought oversold reference only The indicator is suitable for the best time period of 1H About update questions In order to be more suitable for market fluctuations, the company regularly updates the indicators   Product cycle and trading time applicable to indicators Applicable mainstream currency pair EUR/USD GBP/USD NZD/USD AUD/USD USD/JPY USD/CAD USD/CHF Applicable mainstream cross currenc
129 USD
Filter:
No reviews
Reply to review