Box Weis Wave
- Indicators
- Thalles Nascimento De Carvalho
- Version: 2.0
- Activations: 5
Elevate Your Analysis with the Weis Wave Box! 📊🚀
If you’re looking for precision and clarity in your trading, the Weis Wave Box is the tool you need. This advanced indicator offers a detailed visual analysis of volume waves and swing points, helping you better understand the relationship between effort and results in the market.
Key Features of the Weis Wave Box:
📈 Customizable Volume Waves: Adjust volume waves in ticks to fit your trading strategies.
🔍 Adjustable History: Focus on specific time periods for more precise and relevant analysis.
🔄 Ticks vs. Real Volume: Clearly differentiate between ticks and real volume for a more comprehensive market view.
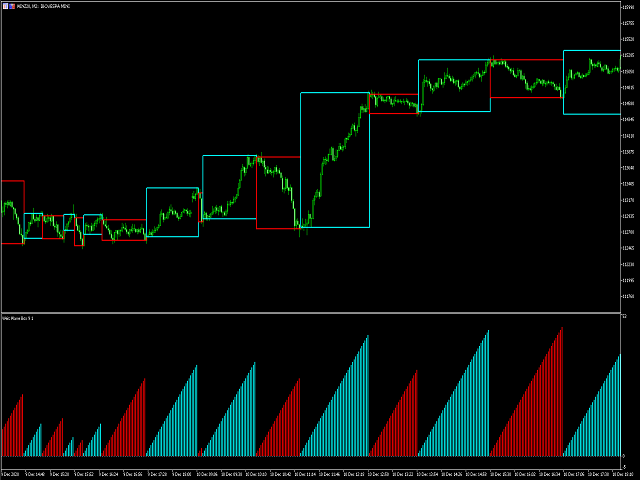
📊 Top Boxes Visualization: Clearly see where the volume (energy) was highest and where the price had less displacement. This visualization helps identify the relationship between effort and results, highlighting which forces are dominating and signaling potential future price shifts.
⚙️ Customizable Swing Forms: Use five different swing forms, including totalVol, length, width, barDVol, and lengthDVol, to tailor your analysis to your needs.
Benefits of the Weis Wave Box:
- Clarity in Analysis: Understand the relationship between effort and results, identifying which side is winning and how this might affect future price movement.
- Intuitive Interface: Easy navigation and efficient use of the indicator.
- Trading Opportunities: Enhance your strategies and results with precise analysis.
The Swing Point Volume indicator can be purchased at this link:
👉 Buy the Swing Point Volume Here
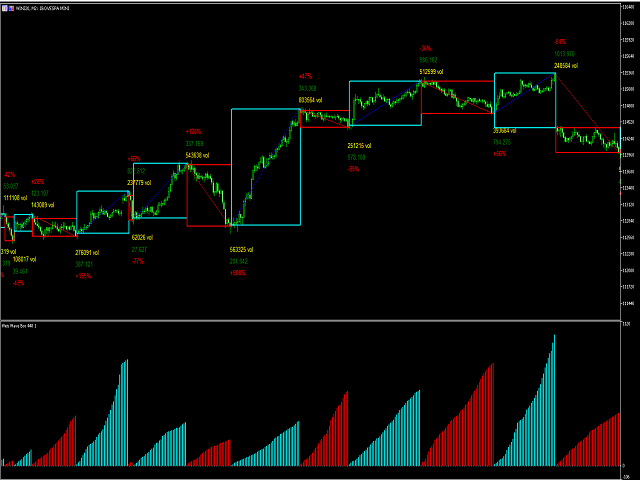


A Very good product.The Box format is very nice.The developer has said there are 5 options to print text near the boxes.The description pictures also show the Wave Distance printed next to the Boxes.However,I am not able to see any text printed near the boxes and I have tried all the options.Maybe something was missed in the update.I have sent a note to the developer and I am hoping that he would fix it soon to restore the full functionality as described.