Unfortunately, "Volume Spread Analysis VSA" is unavailable
You can check out other products of Piotr Stepien:

Alpha BOT is a professional automatic trading system designed and optimized for the MT5 platform and multi currency pair. The principle of operation is based on support and resistance, uses pullback of currency pairs and deep machine learning, the EA independently adjusts to market volatility. Tested in sample and in out of sample with positive results since 2010y.
Currency pair: AUDCAD,NZDCAD,AUDNZD.
Requirements: Leverage 1:30 or higher
Minimum deposit 500 USD, recomended 1000 USD (

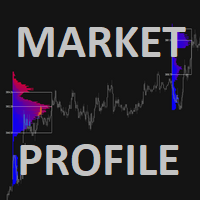
This is a volume profile where you can customize the time period you want. You can do this with a line or choose automatic functions such as showing the volume from the last time period. The indicator also shows the maximum volume value (VPOC - VOLUME POINT OF CONTROL) and the average value, colors and settings you can adjust as you like, there are many possibilities. If you need an indicator that shows the constant volume time frames there is ...HERE... Volume Profile is an advanced charting

This is a volume profile that shows the volume with a fixed constant time frame that you set. The indicator also shows the maximum volume value (VPOC - VOLUME POINT OF CONTROL) and the average value, colors and settings you can adjust as you like, there are many possibilities. If you need an indicator that shows the variable volume range frames there is ...HERE... Volume Profile is an advanced charting study that displays trading activity over a specified time period at specified price leve

Concept of Market Profile was created at Chicago Board of Trade (CBOT) by trader Peter Steidlmayer and first published during the 1980s as CBOT product. Market profile by itself is not a stand-alone strategy, but a different way how you can view the market and make better trading decisions.
They have seen a market as an auction process which is affected by supply and demand the same way as every other auction, for example, development of prices of food, gas etc.
The price goes up as long th

Concept of Market Profile was created at Chicago Board of Trade (CBOT) by trader Peter Steidlmayer and first published during the 1980s as CBOT product. Market profile by itself is not a stand-alone strategy, but a different way how you can view the market and make better trading decisions.
They have seen a market as an auction process which is affected by supply and demand the same way as every other auction, for example, development of prices of food, gas etc.
The price goes up as long

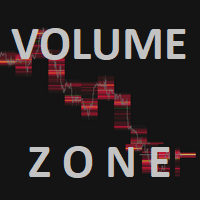
This indicator shows the high volume zone. From the last minutes that you set yourself, the image of the volume zone is generated on an ongoing basis. The indicator also shows the V-Poc, Average Volumen and V-WAP lines. if you are using high intervals you must enter a large number of minutes. the zone builds itself up as the chart moves. if you want to build a zone from: last day - 1440 minutes, last week - 10080 minutes, ... etc. If you need an indicator that shows the constant volume zone

This is an indicator that shows high volume zones and very important points such as V-POC, Average Volume and V-WAP, its use is very similar to the volume Profile but has much more use, You can adjust the time interval in which the zone is to be built, I recommend high compartments type D1, W, M. But if you are using very low time intervals you can also use lower TF zones. If you need an indicator that shows the variable volume zone range frames there is ...HERE...
Volume Zone is an adv

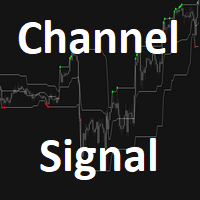
The channel Forex indicator is designed with extreme price values for a specific period in mind.
The indicator comprises of three distinctly colored lines that resembles those of the Bollinger Bands.
Basic Trading Signals
Buy Signal: Go long when price opens and closes above the middle medium line of the indicator, and trades along the upper channel border.
Sell Signal: Go short when price opens and closes below the middle medium blue line of the indicator, and trades along lower chan

Market Factor is a professional automatic trading system designed and optimized for the MT5 platform. The principle of operation is based on price channels, price breakouts and pullback . Tested in sample and in out of sample.
Currency pair: AUDCAD
Requirements: Leverage 1:100 or higher
Minimum deposit 500 USD ( or the same in another currency. )
Run EA on AUDCAD symbol and any Time Frame. ( does not require any specific setting. )
You can set your risk management using a perce