Power Trend
- Indicators
- Yurij Kozhevnikov
- Version: 1.2
- Updated: 4 January 2022
- Activations: 5
Power Trend Paid - the indicator shows the trend strength in the selected period.
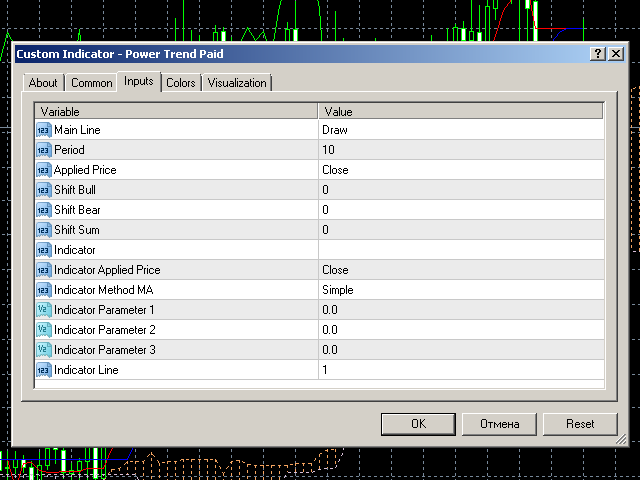
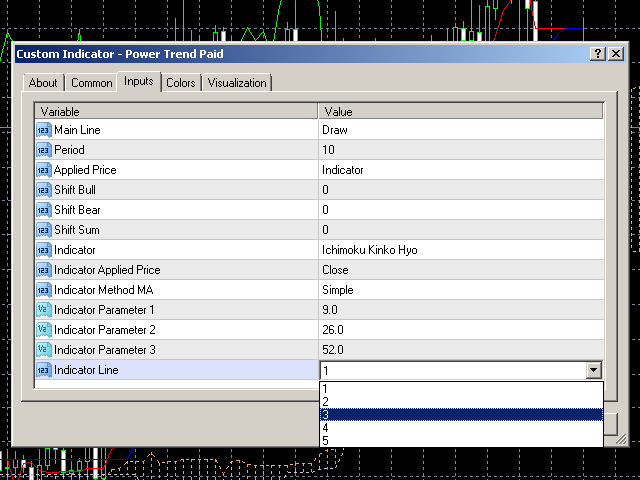
Input Parameters
The indicator has the following input parameters:
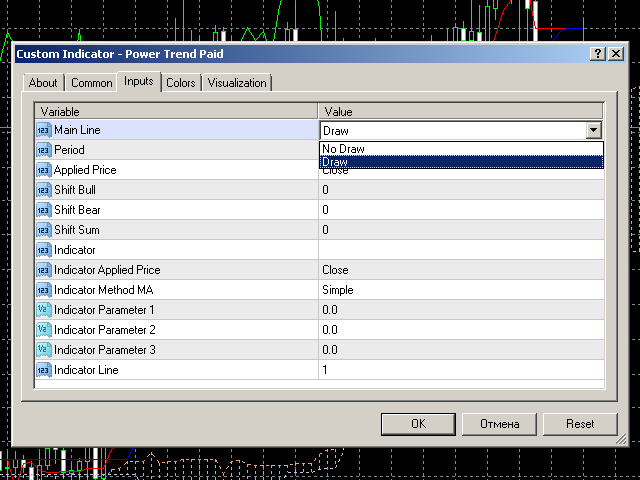
- Main Line - an optional function for drawing a line on the values used for indicator calculation (not available in the free version).
- Period - a positive number greater than one, it shows the number of candlesticks used for calculations. If you enter one or zero, there will be no error, but the indicator will not be drawn.
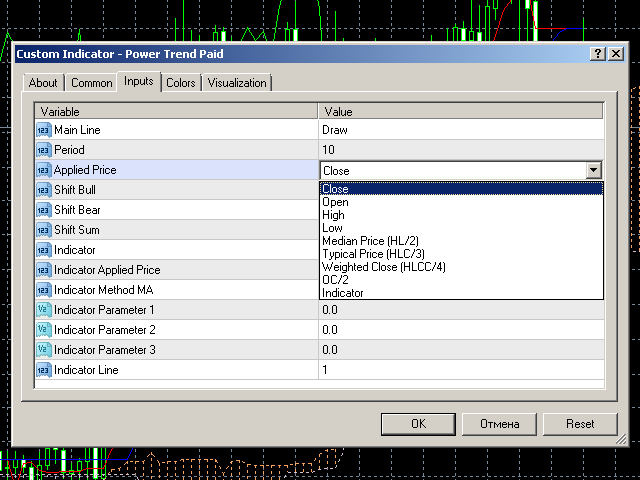
- Applied Price - an extended "Apply to:" set meaning data used for the indicator calculation:
- Close - Close prices;
- Open - Open prices;
- High - High prices;
- Low - Low prices;
- Median Price (HL/2) - average of high and low prices, (high+low)/2;
- Typical Price (HLC/3) - average of high, low and close prices, (high+low+close)/3;
- Weighted Close (HLCC/4) - average of high, low and double value close prices, (high+low+close+close)/4;
- OC/2 - average of open and close prices (open+close)/2 (not available in the free version);
- Indicator - based on indicator values (the list of indicators is below) (not available in the free version).
- Shift Bull - shift of the Bull line (in the free version only one setting for all lines).
- Shift Bear - shift of the Bear line (in the free version only one setting for all lines).
- Shift Sum - shift of the Sum line (in the free version only one setting for all lines).
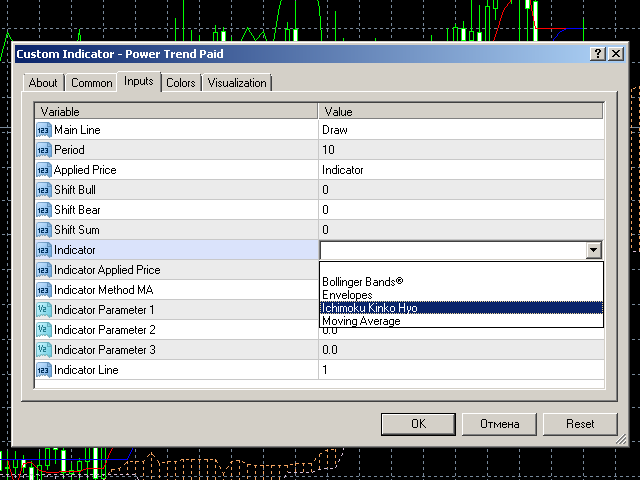
- Indicator - select an indicator to calculate Power Trend Paid (not available in the free version):
- Bollinger Bands®;
- Envelopes;
- Ichimoku Kinko Hyo;
- Moving Average.
- Indicator Applied Price - if the parameter "Apply to:" is used in the inputs of the indicator used for the calculation of Power Trend Paid, the value from this field is used for this parameter (not available in the free version):
- Close - Close prices;
- Open - Open prices;
- High - High prices;
- Low - Low prices;
- Median Price (HL/2) - average of high and low prices, (high+low)/2;
- Typical Price (HLC/3) - average of high, low and close prices, (high+low+close)/3;
- Weighted Close (HLCC/4) - average of high, low and double value close prices, (high+low+close+close)/4.
- Indicator Method MA - if the parameter "MA Method:" is used in the inputs of the indicator used for the calculation of Power Trend Paid, the value from this field is used for this parameter (not available in the free version):
- Simple - simple averaging;
- Exponential - exponential averaging;
- Smoothed - smoothed averaging;
- Linear weighted - linear weighted averaging.
- Indicator Parameter 1 - the first input parameter of the indicator, using which Power Trend Paid will be calculated, not including fields "Apply to:" and "MA Method:" (See the table of indicator input parameters) (not available in the free version).
- Indicator Parameter 2 - the second input parameter of the indicator, using which Power Trend Paid will be calculated, not including fields "Apply to:" and "MA Method:" (See the table of indicator input parameters) (not available in the free version).
- Indicator Parameter 3 - the third input parameter of the indicator, using which Power Trend Paid will be calculated, not including fields "Apply to:" and "MA Method:" (See the table of indicator input parameters) (not available in the free version).
- Indicator Line - the number of the indicator line used for the calculation of Power Trend Paid (See the table of indicator lines) (not available in the free version).
Attention! If in Applied Price Indicator was selected, and in the Indicator field no indicator was selected, this will lead to a fatal error and the indicator will be removed from the chart.
Indicator lines
The indicator is based on the following lines:
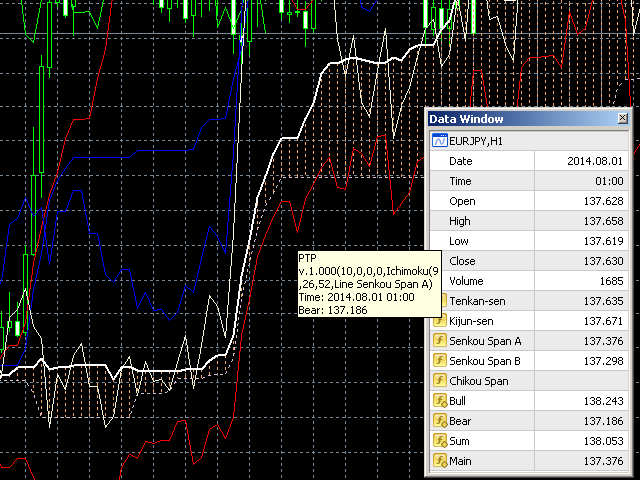
- Bull - to the current value selected in the Applied Price field, a sum of all positive differences between the current and the previous value within the selected period is added.
- Bear - to the current value selected in the Applied Price field, a sum of all negative differences between the current and the previous value within the selected period is added.
- Sum - to the current value selected in the Applied Price field, a sum of all differences between the current and the previous value within the selected period is added.
- Main (optional) - a line of data used for the calculation of Power Trend Paid (not available in the free version).
The Table of Indicator Input Parameters
| Indicator Applied Price |
Indicator Method MA | Indicator Parameter 1 |
Indicator Parameter 2 |
Indicator Parameter 3 |
|
| Bollinger Bands® |
Apply to: |
not used |
Period |
Deviations |
Shift |
| Envelopes |
Apply to: | MA Method |
Period | Shift | Deviation |
| Ichimoku Kinko Hyo |
not used |
not used | Tenkan-sen | Kijun-sen | Senkou Span B |
| Moving Average |
Apply to: | MA Method | Period | Shift | not used |
If incorrect data are specified, the nearest possible values will be used. The main data are shown in the indicator name which appears as a tooltip when you hover your mouse cursor over the indicator line on a chart.
A Table of Indicator Lines
| 1 |
2 | 3 |
60 |
5 |
|
| Bollinger Bands® |
Main |
Upper |
Lower |
not used | not used |
| Envelopes |
Upper | Lower |
not used | not used | not used |
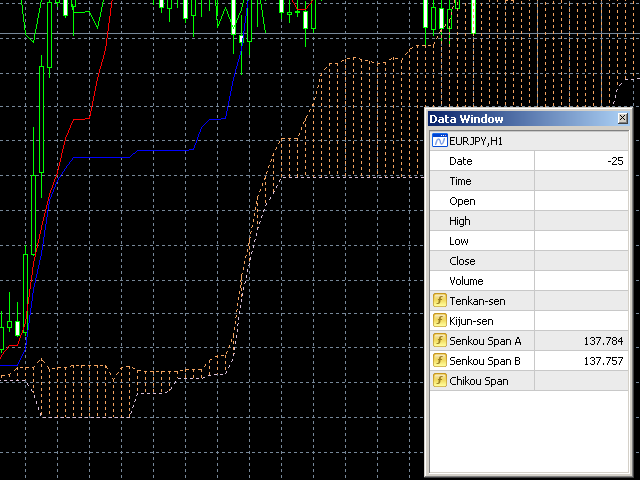
| Ichimoku Kinko Hyo |
Tenkan-sen |
Kijun-sen | Senkou Span A | Senkou Span B | Chinkou Span |
| Moving Average |
IGNORED | IGNORED | IGNORED | IGNORED | IGNORED |
If you select a line that does not exist for the selected indicator, the last possible line will be used. The name of the line applied is shown in the indicator name which appears as a tooltip when you hover your mouse cursor over the indicator line on a chart.