• Overview
  • Reviews
  • Comments

Histogram DMI with Oscillator ADX

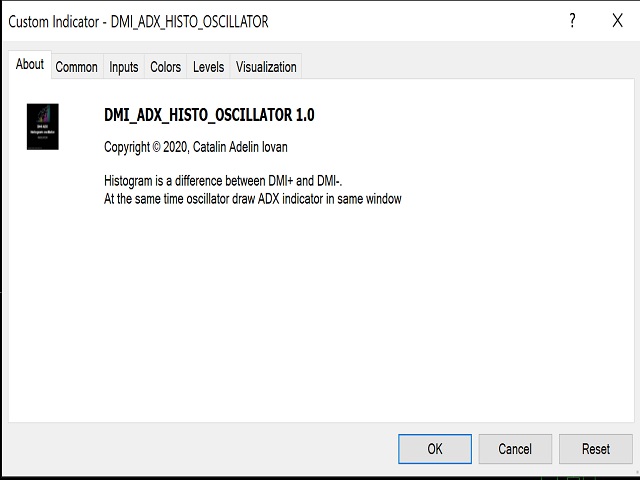
DMI ADX Histogram Oscillator

I present you one of the most precise and powerful indicator

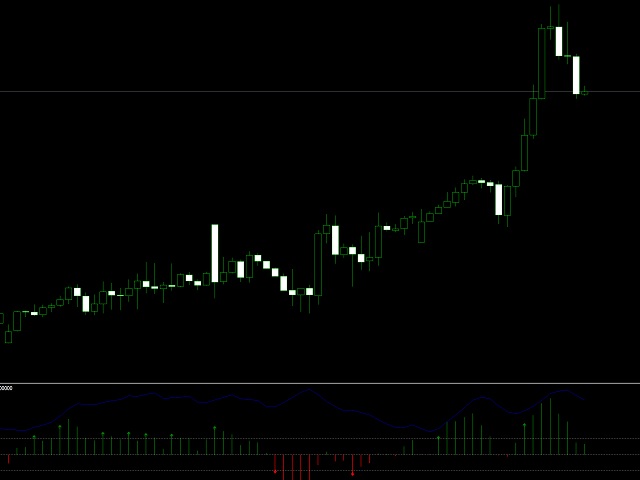
Its made of DMI Histogram together with ADX Oscillator. It has inside arrow to show a buy or sell setup.


Features 

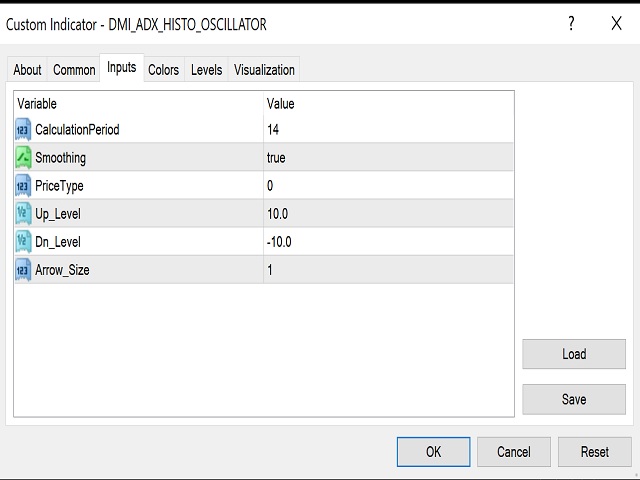
The way it works its the next one : the histogram is a difference between DMI+ and DMI-.  At the same time together we have the oscillator ADX for


Market to run

It can be adapted to all type of trading styles such as scalping, day trading or swing. It doesn't matter if its forex, stock , crypto and so on. It can be adapted and optimized to all of them.


Contact 

 For any question that you have feel free to let me know


Logo made by https://www.fiverr.com/aleksa19

Recommended products
The PERFECT TREND HIT creates   BUY and SELL  perfect trend   arrow signals based on ADX EMA AND RSI And all filters inbuilt with accurate trend entries. Furthermore, the indicator and template display the trend direction, strength, and trade recommendation for independent price charts. ROCK WITH THE TREND Moreover, it shows the final trade recommendation to BUY or SELL with all filters and displays that information as arrow signals and pop up in the chart.  The indicator works well for new and
Implement
Vitalii Zakharuk
5 (1)
Implement analyzes market dynamics for pivot points. If you want to learn how to spot the correct reversals for consistently likely profitable trading, buy this indicator. Shows favorable moments of entering the market in stripes. Ready-made trading system. The principle of operation of the indicator is to automatically determine the current state of the market when placed on a chart, analyze historical data based on historical data and display instructions for further actions on the trader's
VWAP Indicator MT4
Kyra Nickaline Watson-gordon
5 (2)
Description : VWAP (Volume-Weighted Average Price) is the ratio of the value traded to total volume traded over a particular time horizon. It is a measure of the average price at which pair is traded over the trading horizon. Read More. All Symbols and All Timeframes are supported. Indicator Inputs :     VWAP Mode : Mode of VWAP Calculation. Options can be selected : Single,Session,Daily,Weekly,Monthly     Volumes : Real Volumes,Tick Volumes     Price Type : Used price for ca
Sequential R
Antony Augustine
3.67 (3)
Sequential R  is a powerful indicator from the set of professional trader. In today’s market, an objective counter trend technique might be a trader’s most valuable asset. Most of the traders in the stock market must be familiar with the name "TD Sequential" and "Range Exhaustion". The Sequential R is a Counter-Trend Trading with Simple Range Exhaustion System. TD Sequential is designed to identify trend exhaustion points and keep you one step ahead of the trend-following crowd. The "Sequentia
Trend New
Vitalii Zakharuk
Trend New Trend Indicator, shows the signals for entry. Displays both entry points and the trend itself. Shows statistically calculated moments for entering the market with arrows. When using the indicator, it is possible to optimally distribute the risk factor. Settings: Uses all one parameter for settings. Selecting a parameter, it is necessary to visually resemble it so that the appropriate graph has a projection of extremes. Options: Length - the number of bars for calculating the ind
AlgoKing Chandelier Exit Indicator (MT4) The Chandelier Exit Indicator is a volatility based indicator that maximizes returns using the Average True Range (ATR) value and the highest high or lowest low of a period. Benefits Should be used as a trailing stop. Helps you exit a position when you have a respectable profit. Identifies a high probability of a trend reversal when the price moves against the prevailing trend by a distance equal to 3x the average volatility. Join the AlgoKing Lightning
To get access to MT5 version please click here . Also you can check this link . This is the exact conversion from TradingView: "UT Bot" by "Yo_adriiiiaan". This is a light-load processing indicator. This is a non-repaint indicator. Buffers are available for processing in EAs. All input fields are available. You can message in private chat for further changes you need. Thanks for downloading
HC candlestick pattern is a simple and convenient indicator able to define candle patterns.‌ Candlestick charts are a type of financial chart for tracking the movement of securities. They have their origins in the centuries-old Japanese rice trade and have made their way into modern day price charting. Some investors find them more visually appealing than the standard bar charts and the price action is easier to interpret. Hc candlestick pattern is a special indicator designed to find divergence
This indicator will allow you to evaluate single currency linear regression. WHAT IS LINEAR REGRESSION?(PIC.3) Linear regression is an attempt to model a straight-line equation between two variables considering a set of data values. The aim of the model is to find the best fit that can serve the two unknown values without putting the other at a disadvantage. In this case, the two variables are price and time, the two most basic factors in the Forex market. Linear regression works in such a wa
VWAPIndicator
Ahmet Metin Yilmaz
Volume-weighted average price In finance, volume-weighted average price (VWAP) is the ratio of the value traded to total volume traded over a particular time horizon (usually one day). It is a measure of the average price at which a stock is traded over the trading horizon. VWAP is calculated using the following formula: *It is shown second screenshot in the screenshots. trade that takes place over the defined period of time, excluding cross trades and basket cross trades. for more informatio
Lunatic
Agustinus Biotamalo Lumbantoruan
Ever wonder how to apply zodiac and moon cycle on your trading? Don't get me wrong, moon cycle doesn't give you when to buy or when to sell. But it gives you a different time frame that isn't shown in minutes, hourly or daily time frame. Pay attention to the market movement during New Moon and Full Moon Phases. Set to True "Use 4 Phases Only". Often the market is trending during these phases. ================ This indi also shows you the current trend of the market and it paints a candle on eac
This EA is working based on our Shark indicator ( https://www.mql5.com/en/market/product/22786 ). After forward testing this EA for more than 2 months and publishing live signals on our Telegram channel https://t.me/SharkChannel , we received so many positive feed-backs from the clients. Therefore, I decided to put this simple but nice EA on the Market! The robot is multi pair and multi timeframe. So it can monitor several instruments on different timeframes to find shark patterns and then trade
Delta AG
Yurij Kozhevnikov
The difference between the arithmetic and geometric means at the specified range. Since the greater is the difference between the values, the greater the resulting figure is, actually the indicator shows volatility fluctuations. The arithmetic mean of a certain number of values ​​is the sum of the values ​​divided by their number. The geometric mean is the root of the power of the number of values ​​extracted from the product of these values. If all values ​​are equal, the arithmetic mean and th
DsPMO
Ahmet Metin Yilmaz
Double Smoothed Price Momentum Oscillator The Momentum Oscillator measures the amount that a security’s price has changed over a given period of time. The Momentum Oscillator is the current price divided by the price of a previous period, and the quotient is multiplied by 100. The result is an indicator that oscillates around 100. Values less than 100 indicate negative momentum, or decreasing price, and vice versa. Double Smoothed Price Momentum Oscillator examines the price changes in the dete
Smart Awesome Volume
Thushara Dissanayake
5 (1)
The Smart Awesome Volume technical indicator is designed to measure market momentum by combining candle volume data and filtering it with an average to provide accurate signals. It focuses on the concept of "volume confirms price," allowing traders to easily identify market momentum and the battle between buyers and sellers within each candle. With its fast alert system, traders can stay on top of valuable trading events and never miss out on important market movements. One way to improve a stra
Introducing the K-Level Indicator: A Powerful Tool for Unveiling Hidden Trading Opportunities In the dynamic world of trading, identifying high-probability trading opportunities is crucial for success. However, sifting through the vast amount of market data can be a daunting task, often leading to missed opportunities or ill-informed decisions. To address this challenge, we present the K-Level Indicator, a revolutionary tool designed to empower traders with unparalleled insights into market stru
Everyday trading represents a battle of buyers ("Bulls") pushing prices up and sellers ("Bears") pushing prices down. Depending on what party scores off, the day will end with a price that is higher or lower than that of the previous day. Intermediate results, first of all the highest and lowest price, allow to judge about how the battle was developing during the day. It is very important to be able to estimate the Bears Power balance since changes in this balance initially signalize about possi
KT Volatility Oscillator
KEENBASE SOFTWARE SOLUTIONS
KT Volatility oscillator analyze the past and current market data with a mathematical formula to display the result in a form of an oscillator. The growing and deteriorating waves are equivalent to high and low volatility in the asset.  In a nutshell, volatility is simply a measurement of the price fluctuation of an asset over a certain period of time. Without volatility, there would not much movement in the market and traders would not be able to profit from the price movements. Use of Volati
Drop Trends
Vitalii Zakharuk
Drop Trend is a trend indicator for the MetaTrader 4 trading platform. This indicator allows you to find the most probable trend reversal points. You will not find this indicator anywhere else. A simple but effective system for determining the forex trend. From the screenshots you can see for yourself the accuracy of this tool. Works on all currency pairs, stocks, raw materials, cryptocurrencies. Are you tired of the constant ups and downs? Do not become a victim of unstable market movements,
The Trend Professor is a moving average based indicator designed for the purpose of helping the community of traders to analyse the price trend. The indicator will be displayed in the main chart as it is indicated on the screenshot section. How it works The indicator has lines of moving averages and colored histograms to depict the direction of the trend. There will be a fast signal line colored blue/yellow/red at some points. The red/yellow colored lines stands for bearish trend/signal while th
Market Profile
Artem Titarenko
5 (1)
The "Market Profile" indicator displays the profiles and volumes of periods – weekly, daily, session (8-hour), 4-hour, hour, summary. The VAH/VAL price area is automatically highlighted by a dotted line for each profile (except for the summary). The indicator includes chroma Delta, which colors the profile areas. The areas of prevailing Buys is colored in green, that of Sells - in red. The intensity histogram features blue/red respectively. In the filter mode, the indicator displays the volume a
Super MataELang Pro
Agus Wahyu Pratomo
EA SUPER MATAELANG PRO See Live Result : https://www.mql5.com/en/signals/2040079?source=Site +Profile+Seller https://www.mql5.com/en/signals/2146550?source=Site +Profile+Seller About EA: This EA uses some very sophisticated indicators. Can detect trend direction with high accuracy. It also has a safety system to anticipate if the price direction is not in the same direction as the position. Using security in the form of an averaging or martingale system Best used in the m15 time frame. Th
Volume Delta Panel
Chantal Sala
4.54 (13)
Volume DeltaPanel is a very powerful indicator that read the supply on Market. It calculates the Delta from movement of the price and the difference of BUY volumes and SELL volumes. The Volumes are added to price and normalized to symbol points. Its special structure allows you to get all Time Frames values available on the platform MT4. Panel can show 28 instruments simultaneously all customizable according to the offer of the Broker. A good observation of this instrument can suggest great en
The GENEVA trading system this is a tool that can conduct a comprehensive analysis of the Forex market, stock market, and cryptocurrency market. With this tool, you will receive ready-made signals to enter the market. Let's see what the system looks like: To begin with, the system is exclusively trend-based, which means that you are already in a winning situation, because you only work on the trend. The system has its own trend/flat analyzer built in. This means that during lateral moveme
Everyday trading represents a battle of buyers ("Bulls") pushing prices up and sellers ("Bears") pushing prices down. Depending on what party scores off, the day will end with a price that is higher or lower than that of the previous day. Intermediate results, first of all the highest and lowest price, allow to judge about how the battle was developing during the day. It is very important to be able to estimate the Bears Power balance since changes in this balance initially signalize about possi
Dublgis
Ivan Simonika
Here is a sensitive indicator for Dublgis professionals. It is built on completely new algorithms and is more efficient, on any timeframes, since it filters random price movements. Finds and visually displays price reversal points. This tool can be used as confirmation when making a deal, as well as to determine the direction of the trend and its strength. The indicator was developed as a complement to a number of our other trading tools.
To get access to MT5 version please click here . This is the exact conversion from TradingView:"HIGH AND LOW Optimized Trend TrackerHL OTT" by "kivancozbilgic" This is a light-load processing indicator. It is a non-repaint indicator. Colored Candle and Highlighting options are not available. Buffers are available for processing in EAs. You can message in private chat for further changes you need. Thanks.
Ultimate solution on price action trade system Built Inside One Tool! Our smart algorithm tool will detect the price action pattern and alert upon potential with entry signals and exit levels including stoploss and takeprofit levels based on the time setting on each market session. This tool will also filters out market currency strength to ensure our entry are in a good currency conditions based on it's trend. Benefit You Get Easy, visual and effective price action detection. Gives you th
Session Volume Profile  is an advanced graphical representation that displays trading activity during Forex trading sessions at specified price levels. The Forex market can be divided into four main trading sessions: the Australian session, the Asian session, the European session and the favorite trading time - the American (US) session. POC  - profile can be used as a support and resistance level for intraday trading. VWAP  - Volume Weighted Average Price. ATTENTION! For the indicator to
The indicator determines a special pattern of Joe Dinapoli. It gives very high probability buy and sell signals. Indicator does not repaint. Indicator Usage Buy Signal ''B'' Entry : Market buy order at signal bar close Stop : Low of signal bar Take Profit : First swing high Sell Signal ''S'' Entry : Market sell order at signal bar close Stop : High of signal bar Take Profit : First swing low Indicator Parameters Fast EMA : External Parameter (should be kept as default) Slow EMA: External Param
Buyers of this product also purchase
Atomic Analyst
Issam Kassas
5 (3)
First of all Its worth emphasizing here that this Trading Indicator is   Non-Repainting ,   Non-Redrawing   and   Non-Lagging   Indicator, Which makes it ideal from both manual and robot trading.  User manual: settings, inputs and strategy . The Atomic Analyst  is a PA Price Action Indicator that uses Strength and Momentum of the price to find a better edge in the market. Equipped with Advanced filters which help remove noises and false signals, and Increase Trading Potential. Using Multiple la
TPSpro RFI Levels
Roman Podpora
5 (13)
A key element in trading is zones or levels from which decisions to buy or sell a trading instrument are made. Despite attempts by major players to conceal their presence in the market, they inevitably leave traces. Our task was to learn how to identify these traces and interpret them correctly. Reversal First Impulse levels (RFI)   -  Version MT5                INSTRUCTIONS                 RUS                 ENG                                       R ecommended to use with an indicator   -  
Currently 20% OFF ! Best Solution for any Newbie or Expert Trader! This dashboard software is working on 28 currency pairs plus one. It is based on 2 of our main indicators (Advanced Currency Strength 28 and Advanced Currency Impulse). It gives a great overview of the entire Forex market plus Gold or 1 indices. It shows Advanced Currency Strength values, currency speed of movement and signals for 28 Forex pairs in all (9) timeframes. Imagine how your trading will improve when you can watch the e
Introducing the Miraculous Forex Indicator: Unleash the Power of Precision Trading Are you tired of searching for the perfect forex indicator that truly delivers exceptional results across all time frames? Look no further! The Miraculous Forex Indicator has arrived to revolutionize your trading experience and propel your profits to new heights. Built upon a foundation of cutting-edge technology and years of meticulous development, the Miraculous Forex Indicator stands as the pinnacle of str
How to use Pair Trading Station Pair Trading Station is recommended for H1 time frame and you can use it for any currency pairs. To generate buy and sell signal, follow few steps below to apply Pair Trading Station to your MetaTrader terminal. When you load Pair Trading Station on your chart, Pair Trading station will assess available historical data in your MetaTrader platforms for each currency pair. On your chart, the amount of historical data available will be displayed for each currency pai
The BB Reversal Arrows technical trading system has been developed to predict reverse points for making retail decisions. The current market situation is analyzed by the indicator and structured for several criteria: the expectation of reversal moments, potential turning points, purchase and sale signals. The indicator does not contain excess information, has a visual understandable interface, allowing traders to make reasonable decisions. All arrows appear to close the candle, without redr
TrendMaestro
Stefano Frisetti
5 (2)
note: this indicator is for METATRADER4, if you want the version for METATRADER5 this is the link:  https://www.mql5.com/it/market/product/108106 TRENDMAESTRO ver 2.4 TRENDMAESTRO recognizes a new TREND in the bud, he never makes mistakes. The certainty of identifying a new TREND is priceless. DESCRIPTION TRENDMAESTRO identifies a new TREND in the bud, this indicator examines the volatility, volumes and momentum to identify the moment in which there is an explosion of one or more of these data a
Up down v6T
Guner Koca
5 (1)
Thise indicator is up down v6  comes with tradingwiev pinescript. purchased people, after installed on terminal ,contact me on mql5  to get BONUS  TradingView pinescript. up-down indicator is no repaint and works all pairs and lower than weekly time frames charts. it is suitable also 1 m charts for all pairs. and hold long way to signal. dont gives too many signals. when red histogram cross trigger line that is up signal.and price probably will down when blue histogram cross trigger line that
FX Volume
Daniel Stein
4.6 (35)
Visit our all-new   Stein Investments Welcome Page   to get the latest information, updates and trading strategies. FX Volume is the FIRST and ONLY volume indicator that provides a REAL insight into the market sentiment from a broker's point of view. It provides awesome insights into how institutional market participants, like brokers, are positioned in the Forex market, much faster than COT reports. Seeing this information directly on your chart is the real game-changer and breakthrough solut
Connect Indicator
Sukunthakan Ngernbamrung
Connect Indicator is a tool used for connecting indicators between the MQL market and MT4. The connected indicators are made by our group and can be used for other applications, such as sending messages to the Line application or Telegram application. If you have any questions, please don't hesitate to ask us to receive support. Function and indicator buffer Buffer one is the high price of the previous candle. Buffer two is the high price of the previous candle. Usage To connect indicators to fu
Welcome to the world of SMC (Smart Money Concepts) Trading, where we empower traders with the tools and knowledge to make smarter trading decisions. Our latest addition to our suite of trading tools is the SMC Trading Pro indicator, version 1.0. Key Features: Major Market Structure Identification with BODY break. Order Block must be in Major Swing ( not Small Swing ). Order Block with Fair Value Gap Detection. Order Block in Discount | Premium zone. Filter for only Bullish, Bearish or All Order
Cycle Sniper
Elmira Memish
4.39 (36)
NEW YEAR SALE PRICE FOR LIMITED TIME!!! Please contact us after your purchase and we will send you the complimentary indicators to complete the system Cycle Sniper is not a holy grail but when you use it in a system which is explained in the videos, you will feel the difference. If you are not willing to focus on the charts designed with Cycle Sniper and other free tools we provide, we recommend not buying this indicator. We recommend watching the videos about the indiactor and system before pu
TakePropips Donchian Trend Pro
Eric John Pajarillaga Aldana
4.82 (17)
TakePropips Donchian Trend Pro  (MT4) is a powerful and effective tool that automatically detects the direction of the trend using the Donchian Channel and provides you with an entry and exit trading signals! This multi-function indicator includes a trend scanner, trading signals, statistical panel, screener, trading sessions, and alerts history dashboard. It is designed to provide you with trading signals and save you hours analyzing the charts! You can download the user manual and installation
Trend Arrow Super
Aleksandr Makarov
5 (1)
Trend Arrow Super Live signal: Click to view The indicator not repaint or change its data. A professional, yet very easy to use Forex system. The indicator gives accurate BUY\SELL signals. Trend Arrow Super is very easy to use, you just need to attach it to the chart and follow simple trading recommendations. Buy signal: Arrow + Histogram in green color, enter immediately on the market to buy. Sell signal: Arrow + Histogram of red color, enter immediately on the market to sell. Please
The "Easy Ichimoku Wave Meter" indicator is a basic tool to automatically determine Waves according to Ichimoku! The indicator gives the possibility to simultaneously apply the Wave Theory, Time Theory and Target Price Theory according to the "Little Ichimoku" strategy developed by Sense Hosoda on the MT4 platform.  The use of this tool allows not only novice traders to instantly (fully automatic) determine the waves and their rapid interpretation, it also allows to automatically measure the p
XQ Indicator MetaTrader 4
Marzena Maria Szmit
3 (2)
Step into the realm of Forex trading with confidence and precision using XQ, a cutting-edge Forex indicator designed to elevate your trading game to unprecedented heights. Whether you're a seasoned trader or just stepping into the world of currency exchange,   XQ Forex Indicator   empowers you with the insights and signals needed to make informed trading decisions. The signal conditions are a combination of three indicators, and XQ Forex Indicator only display  medium and long-term trends . The
Reversal Sniper
Elmira Memish
5 (3)
Reversal Sniper is designed to find the extreme reversals of the price. Indicator collects data of Cycle Sniper Indicator. NOTE: REVERSAL SNIPER Indicator is made for Cycle Sniper Users as an additional tool.  However, it can be used by the traders who look for finding out strong reversal levels. Indicator works on all timeframes and all instruments. Reversal  Sniper  Checks: Harmonic Patterns RSI Zig Zag and Harmonic Swings Cycle Sniper Indicator's Buy / Sell Signals The complex algo i
PZ Harmonacci Patterns
PZ TRADING SLU
3.43 (7)
This is arguably the most complete harmonic price formation auto-recognition indicator you can find for the MetaTrader Platform. It detects 19 different patterns, takes fibonacci projections as seriously as you do, displays the Potential Reversal Zone (PRZ) and finds suitable stop-loss and take-profit levels. [ Installation Guide | Update Guide | Troubleshooting | FAQ | All Products ] It detects 19 different harmonic price formations It plots primary, derived and complementary Fibonacci pro
Introducing ON Trade Waves Patterns Harmonic Elliot Wolfe, an advanced indicator designed to detect various market patterns using both manual and automated methods. Here's how it works: Harmonic Patterns: This indicator can identify harmonic patterns that appear on your chart. These patterns are essential for traders practicing harmonic trading theory, as popularized by Scott Carney's book "Harmonic Trading vol 1&2." Whether you draw them manually or rely on automated detection, ON Trade Waves
Shepherd Harmonic Pattern
Abdullah Alrai
4.68 (59)
This indicator will detect harmonic patterns that are drawn on the chart by manual and automatic methods. You can see user manual from this link: Notes Indicator has control panel and it will save every (chart & timeframe) settings. You can minimize it to have more space on chart and you can press close button to hide all indicator data on chart if you prefer to work with other analysis tools  When you use this indicator and change the settings, add indicators like Moving Average or Bollinger
TPA True Price Action indicator reveals the true price action of the market makers through 100% non-repainting signals (except early signals mode) strictly at the close of a candle! TPA shows entries and re-entries, every time the bulls are definitely stronger than the bears and vice versa. Not to confuse with red/green candles. The shift of power gets confirmed at the earliest stage and is ONE exit strategy of several. There are available now two free parts of the TPA User Guide for our custo
Indicator : RealValueIndicator Description : RealValueIndicator is a powerful tool designed specifically for trading on the EURUSD pair. This indicator analyzes all EUR and USD pairs, calculates their real currency strength values, and displays them as a single realistic value to give you a head start on price. This indicator will tell you moves before they happen if you use it right. RealValueIndicator allows you to get a quick and accurate overview of the EURUSD currency pair tops and bottoms,
Gann Signal
Kirill Borovskii
Gann Signal is a very simple indicator at first glance, but hidden inside is many years of experience in studying W.D.Ganna methods. The indicator gives accurate BUY/SELL signals, without redrawing. The indicator is very easy to use. All you need to do is attach it to your chart and follow its recommendations. The indicator constantly analyzes the market for entry opportunities. When such an opportunity appears, the indicator gives a signal in the form of an arrow. I repeat, all signals are NOT
Gold Channel is a volatility-based indicator, developed with a specific timing algorithm for the XAUUSD pair, which consists of finding possible corrections in the market. This indicator shows two outer lines, an inner line (retracement line) and an arrow sign, where the theory of the channel is to help identify overbought and oversold conditions in the market. The market price will generally fall between the boundaries of the channel. If prices touch or move outside the channel it is a tra
StalkeR Arrow
Abdulkarim Karazon
5 (4)
StalkeR Arrow is an arrow indicator that gives buy and sell signal on bar open/intra bar , this indicator is based on price action patterns and fractals  this indicator gives tp and sl for each buy and sell signal , the tp and sl are in form of lines above and below each signal , they extend till a new signal is formed  this indicator has backtesting panel/dashboard that gives win/loss stats of history signals , this indicator does not repaint or backpaint. Parameters :  StalkeR Period : arrow
Supply and Demand Dashboard PRO
Bernhard Schweigert
4.82 (22)
Currently 20% OFF ! This dashboard is a very powerful piece of software working on multiple symbols and up to 9 timeframes. It is based on our main indicator (Best reviews:   Advanced Supply Demand ). The dashboard gives a great overview. It shows: Filtered Supply and Demand values including zone strength rating, Pips distances to/and within zones, It highlights nested zones, It gives 4 kind of alerts for the chosen symbols in all (9) time-frames. It is highly configurable for your personal
ON Trade Optuma Astro
Abdullah Alrai
5 (4)
This is an astronomy indicator for the MT4 platform like optuma program that performs a variety of functions. It uses complex algorithms to perform its own calculations, which are so accurate. The indicator has a panel that provides astronomical information such as planets' geo/heliocentric cords, distance of sun/earth, magnitude, elongation, constellation, ecliptic cords, equatorial cords, and horizontal cords depending on  the vertical line that generated by the indicator depend on the time va
The indicator " ZigZag on Trend " is an assistant in determining the direction of price movement, as well as a calculator of bars and points. It consists of a trend indicator, which follows the price direction by the trend line presented in the form of a zigzag and a counter calculating the number of bars traversed in the direction of the trend and the number of points on the vertical scale. (calculations are carried out by the opening of the bar) The indicator does not redraw. For convenience,
XPointer
Andrey Kozak
5 (3)
XPointer is a completely ready trading system. It shows the trader when to open and close a trade. It works on all currency pairs and all time frames. Very easy to use and does not require additional indicators for its operation. Even a beginner trader can start working with XPointer. But it will also be useful for professional traders to confirm the opening of orders. Features of the XPointer indicator It does not redraw its values. It works on all currency pairs and all time frames. It has a
Chan
Zhao Ming Liu
5 (1)
缠中说禅在MT4的应用,该指标自动识别分型,划笔,划线段,显示笔中枢,线段中枢,也可以根据需求在参数中设置显示自己所需要的。 1.笔采用条件较为宽松的新笔。 2.当前分型与前面分型不能构成笔时,若与前面笔同向且创新高或新底时会延伸笔,若与前面笔异向且符合替换条件则去除倒数第一笔,直接倒数第二笔。 3.线段的终结第一类情况:缺口封闭,再次创新高或新底新低,则判为终结,同时破坏那一笔的右侧考虑特征序列包含。 4.线段终结的第二类情况,缺口未封闭,考虑后一段特征序列分型出现新的顶底分型,同时做了包含处理。 5.中枢必须有退出段才进行显示,中枢的进入段和退出段必须同向。 中枢的进入段起始点 ( 上下上结构的) 必须高于GG,或( 下上下结构的)必须 低于DD; 中枢的退出段结束点 (下上下结构的) 必须高于GG,或 (上下上结构的)  必须低于DD。
More from author
Have you ever wanted a system which contains all major indicators together as a whole? Instead of dozens of strategies, why not use one that contains all of them, and can be run as a whole or individually? Well, now it's your chance to have it , because I am very glad to bring you one of my best creations : ALL IN ONE  Expert Advisor Features  This EA its a all in one strategy. It has a multiple combination of all major indicators that can be used separately or together as a whole, to ma
All in one MA cross
Catalin Adelin Iovan
All moving averages in one strategy Have you ever wanted a simple and efficient strategy that actually works?  Well, now it's your chance to have it , because I am very glad to bring you another of my best creations : ALL in one MA CROSS This EA its an all in one strategy. It contains all types of moving averages that can be modified together with a risk management plan. If you want the indicator only , here it is : https://www.mql5.com/en/market/product/54184#!tab=overview Features  T
All moving averages in one indicator Have you ever wanted an indicator which contains all types of moving averages and show you when they cross?  And at the same time works on all timeframes and it's very simple to configure? Well, now it's your chance to have it , because I am very glad to bring you another of my best creations : ALL in one MA indicator This indicator is the base indicator used for this strategy. https://www.mql5.com/en/market/product/54168#!tab=overview Features 
The five guardians
Catalin Adelin Iovan
The five guardians This indicator is a combination of the next indicators, each with their own settings. CCI MACD ADX DMI STOCHASTIC When all five of them align with the same movement we get a green color which represents the buy movement , and contrary we have a red color which represents a sell movement. If its gray, its undecided, and we have to wait until a better signal will appear. Logo made by  https://www.fiverr.com/aleksa19
Features  Beginner friendly tools that incorporates one of the most useful indicators into simple and efficient strategy. This oscillator merges MA of RSI and parabolic SAR based on MACD values. Compared to standard parabolic SAR you'll see it is smoother and it seems likely to identify better significant price breaks. You will also have histogram that shows price bias and to assist with making trading decisions based on alignment. Market to run It can be adapted to all type of trading style
Features  A n indicator will be given if we have a break on high volume. Up Arrow Volume> Average_Volume * Multiplier Price> Highest Price for Last N candle, plus set, Pip / Percentage Value Down Arrow Volume> Average_Volume * Multiplier Price <Lowest Price for Last N candle, minus set, Pip / Percentage Value Market to run It can be adapted to all type of trading styles such as scalping, day trading or swing. It doesn't matter if its forex, stock , crypto and so on. It can be ad
Description An amazing and effcient scalper, suited for all types of accounts. Its designed especially for EURUSD 15min chart. No martingale, no extra risk, none of that gambling stuff that can destroy your account. Its a plug and play strategy, meaning that you dont have to modify anything, except the input value of the lots. Strategy : Its made of multiple averages combinations EMA,SMMA, SMA, applied to different candles : closes/ hl2 / hl3 . In general it always enter at the beginning
EURUSD 5min scalper
Catalin Adelin Iovan
Features An amazing scalper created for EURUSD 5 min time frame, with very low risk and high reward at the same time. After more than 500h of optimization I am glad to present you this EA . It was made in mind for IC markets MQL5 platform, an adapted for their data, but I suppose it must works on other brookers as well. I will also publish soon the MT4 version for IC markets as well. Link to 1 min scalper  https://www.mql5.com/en/market/product/54413 Description Strategy is made from ADX tog
EURUSD 1min scalper
Catalin Adelin Iovan
Features An amazing scalper created for EURUSD 1 min time frame. Compared to the 5 min version https://www.mql5.com/en/market/product/54412#!tab=overview , this one is a higher risk/ reward . Just like the 5 min version, this one needed more than 500h of optimization . It was made in mind for IC markets MQL5 platform, an adapted for their data, but I suppose it must works on other brookers as well. I will also publish soon the MT4 version for IC markets as well. Description Strategy is made
Filter:
No reviews
Reply to review