UPD1 X00 Levels
- Indicators
- Vitaliy Kuznetsov
- Version: 2.70
- Updated: 8 December 2023
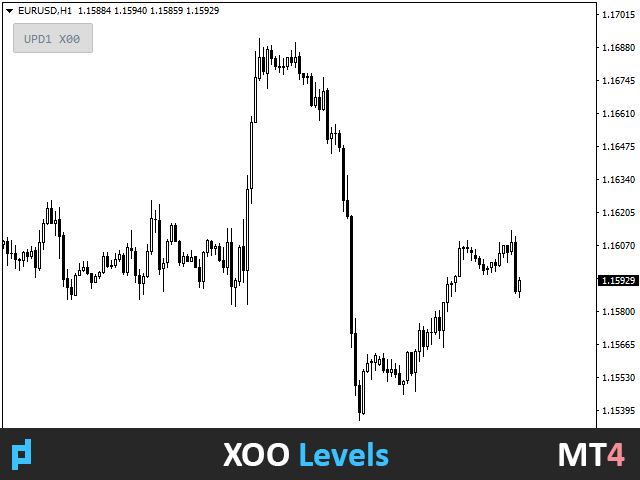
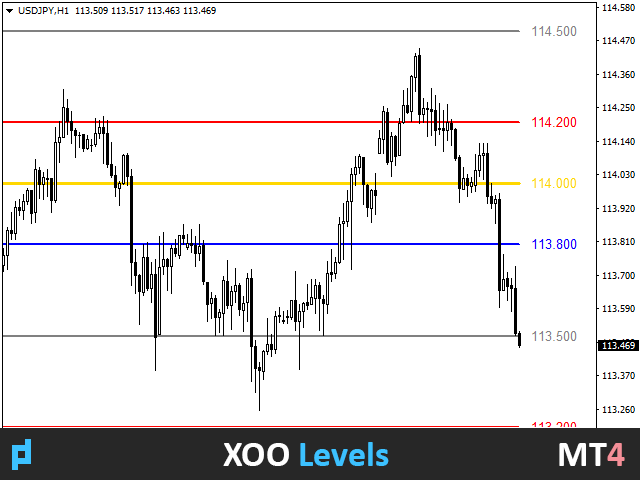
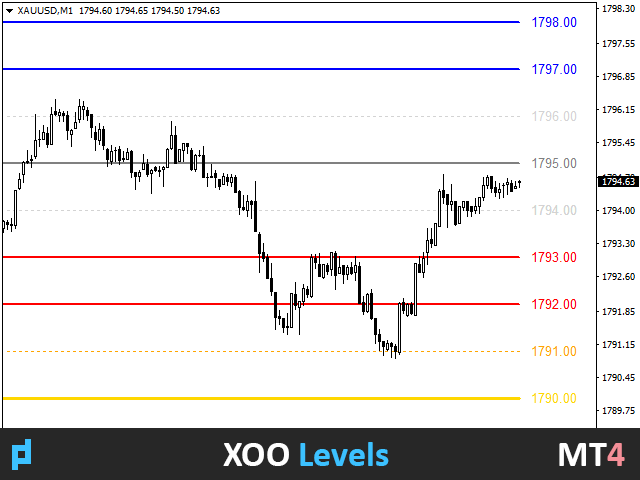
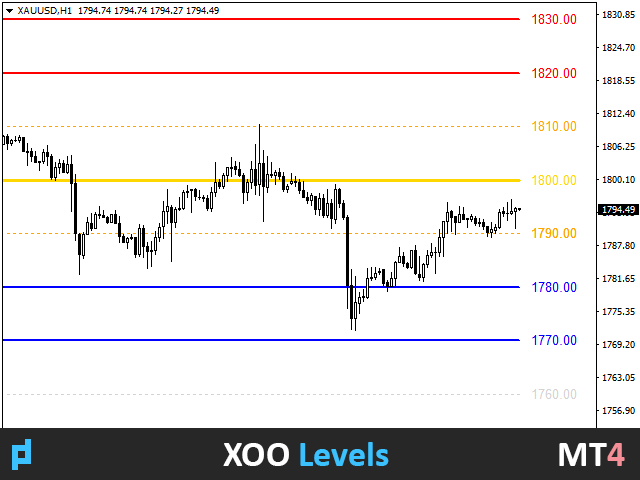
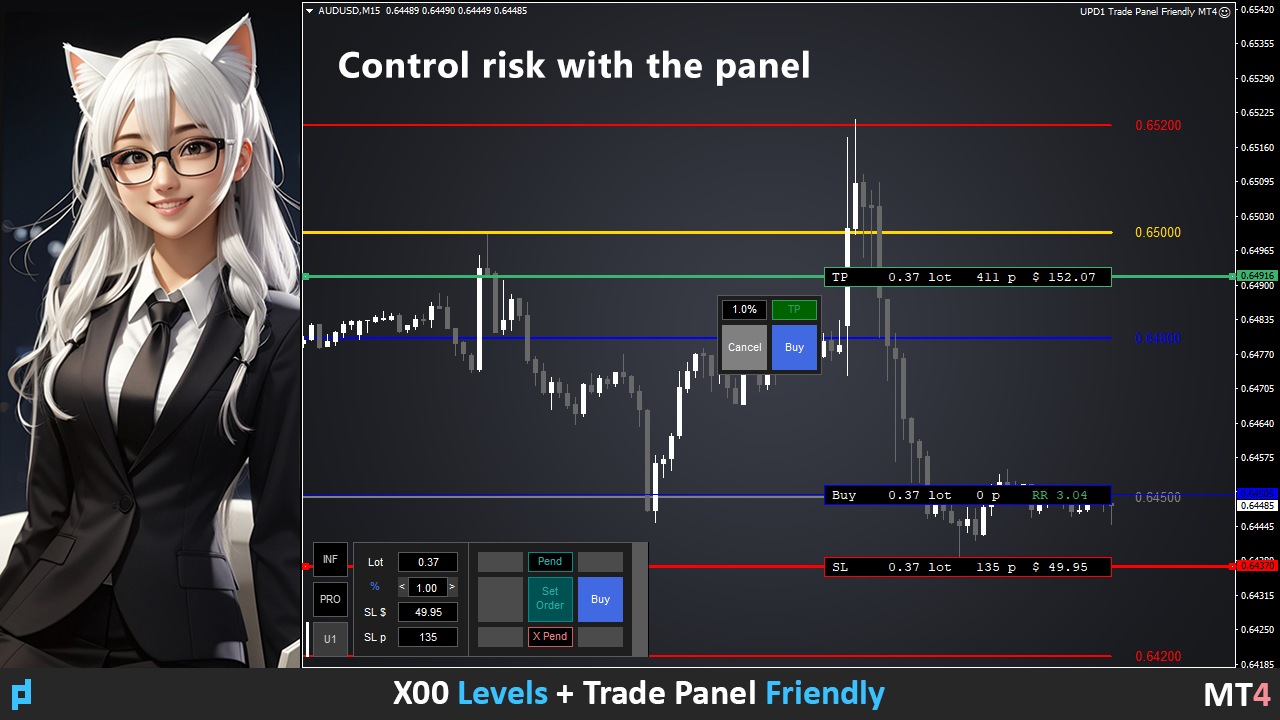
The indicator shows round levels on the chart.
They are also called psychological, banking, or levels of major players.
At these levels, there is a real fight between bulls and bears, the accumulation of many orders, which leads to increased volatility.
The indicator automatically adjusts to any instrument and timeframe.
When the level 80 is broken through and then tested, we buy. When level 20 is broken through and then tested, we sell. The target is 00.
Attention. Due to strong support and resistance levels, the price may slightly miss the 00 level.
Input parameters.
Bars Count - Line length in bars.
Show 00 Levels - On/Off.
Show 10, 90 Levels - On/Off.
Show 20, 80 Levels - On/Off.
Show 30, 70 Levels - On/Off.
Show 40, 60 Levels - On/Off
Show 50 Levels - On/Off.
N Lines - the number of round levels above and below the price.
Distance 00 Levels - Auto or Manual.
Line Position - Forward/Backward.
Visual Button - (On / Off).
Corner - (UP Left / DN Left / UP Right / DN Right).
X indent - in pixels.
Y indent - in pixels.
Label Visual - On/Off digital level marking.
Label Font Size.
Label Shift Bars.
Label Tooltip.
Label Name - Full/Short.
Levels Style.
Levels Width.
Levels Color.
Alert - On/Off.
Alert Work Time - 00:00-23:59 (edit).
Alert Pop Up - On/Off.
Alert Push - On/Off.
Alert Email - On/Off.
Alert Sound - On/Off.
Alert Sound Name.
Object ID - prefix to the name of the object.


Amazing indicator! Great job to the Author!