• Overview
  • Reviews (2)
  • Comments (4)
  • What's new

Follow Trend MT4

5
The indicator is based on the analysis of the volatility of a trading instrument.

The indicator does not repaint (except for the last candle).

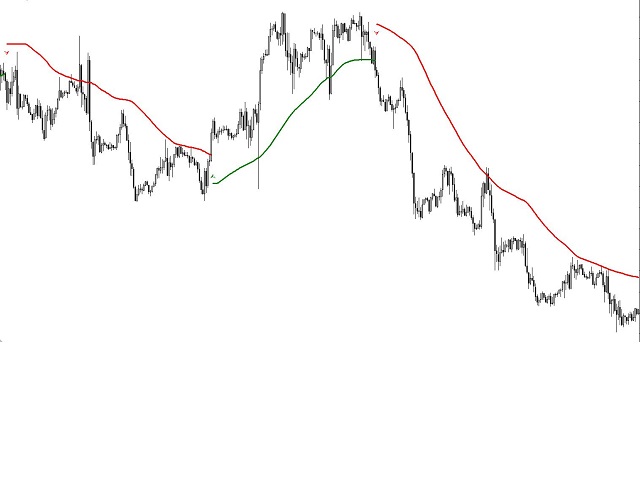
On the chart it looks like 2 lines (estimated support / resistance levels) and displays arrows when a trend changes.

It can be used on any timeframe, but best of all, the indicator shows itself on timeframes from H1 and higher.

Extremely easy to set up and use.

Input parameters:

Sensivity - indicator sensitivity. The lower the value, the faster the indicator responds to a trend change (but at the same time there are more false signals). The optimal interval is 0.8-1.5.

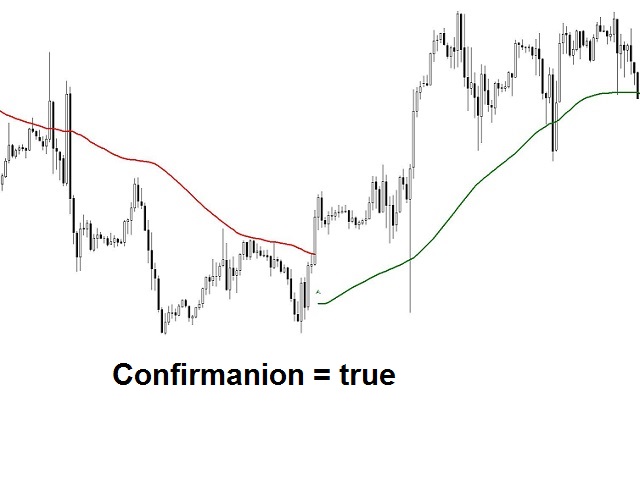
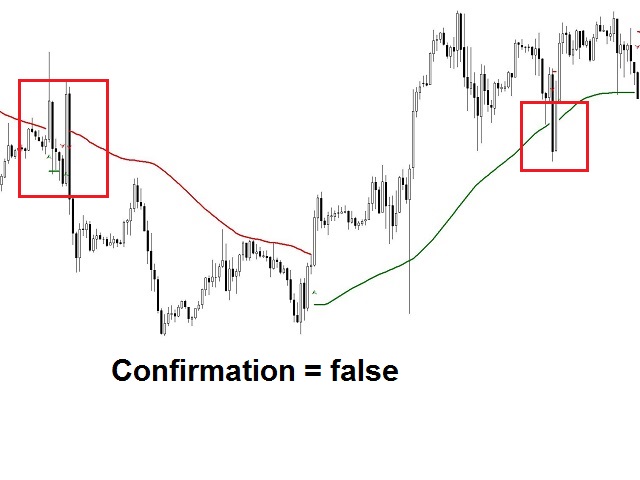
Wait confirmation - wait or not wait for confirmation of a signal about a trend change. If true, the signal appears 1 candle later, but this eliminates false breakouts.

Arrow distance - position of the signal arrow relative to the trend line (may be negative).


Indicator Use Options

Entry points
  • the appearance of the arrow (on a closed candle)
  • retest of the trend line (on a closed candle) without changing the direction of the trend. it is advisable to enter this signal for a maximum of 30-40 candles after changing the direction of the trend. Such inputs are often the best.
Exit points
  • the appearance of an arrow in the opposite direction (on a closed candle)
  • if the entrance was during a retest of the trend line, an exit / partial closure is possible at the level of the local extremum formed after the trend change
Also, indicator lines can be used as trailing stop levels (at a certain distance from the lines).


Reviews 2
intan08
1382
intan08 2021.11.12 08:38 
 

Excellent.

Recommended products
Master Scalping M1 is an innovative indicator that uses an algorithm to quickly and accurately determine the trend.The indicator calculates the time of opening and closing positions, the indicator's algorithms allow you to find the ideal moments to enter a deal (buy or sell an asset), which increase the success of transactions for most traders. Benefits of the indicator: Easy to assemble, does not overload the chart with unnecessary information. Can be used as a filter for any strategy. Works on
HMA Trend Professional MT4
Pavel Zamoshnikov
4.63 (8)
Improved version of the free HMA Trend indicator (for MetaTrader 4) with statistical analysis. HMA Trend is a trend indicator based on the Hull Moving Average (HMA) with two periods. HMA with a slow period identifies the trend, while HMA with a fast period determines the short-term movements and signals in the trend direction. The main differences from the free version: Ability to predict the probability of a trend reversal using analysis of history data. Plotting statistical charts for analyz
Point61 Indicator
Evgeniy Machok
5 (1)
The Point61 indicator is the result of many years of monitoring of price behavior of currency pairs and metals. It is not a secret, that in times of uncertainty, traders are looking for possible levels of support and resistance - the point, where price should stop its movement. There are 2 possible scenarios at these points: 1. Reverse (correction) to the opposite direction; 2. Breakthrough to continue movement. Very often these points are used to set stop orders - TakeProfit or
Owl smart levels
Sergey Ermolov
4.63 (54)
MT5 version  |  FAQ The Owl Smart Levels Indicator  is a complete trading system within the one indicator that includes such popular market analysis tools as  Bill Williams' advanced fractals , Valable ZigZag which builds  the correct wave structure  of the market, and  Fibonacci levels  which mark the exact levels of entry into the market and places to take profits. Detailed description of the strategy Instructions for working with the indicator Advisor-assistant in trading Owl Helper Private
VR Cub
Vladimir Pastushak
VR Cub is an indicator for getting high-quality entry points. The indicator was developed to facilitate mathematical calculations and simplify the search for entry points into a position. The trading strategy for which the indicator was written has been proving its effectiveness for many years. The simplicity of the trading strategy is its great advantage, which allows even novice traders to successfully trade with it. VR Cub calculates position opening points and Take Profit and Stop Loss targe
Trade with Gann on your side!! MASTER CIRCLE 360 CIRCLE CHART, originally created by Gann admitted that this is “The Mother of all charts”. It is one of the last studies that this great trader left for us. The numeric tab le is apparently quite simple like all the tables and is based on square numbers, the SQUARE OF 12 and is by evolution, one of the most important square numbers. Here we can find CYCLE, PRICE AND TIME thanks to angles and grades, to show past and future support and resistance.
Trend Monitor
Pavel Zamoshnikov
4.2 (5)
The indicator generates early signals basing on ADX reading data combined with elements of price patterns. Works on all symbols and timeframes. The indicator does not redraw its signals. You see the same things on history and in real time. For better visual perception signals are displayed as arrows (in order not to overload the chart). Features Easy to use. Filter configuration only requires selection of sensitivity in the " Sensitivity of the indicator " input. Signals can be filtered usin
The Stochastic Oscillator is a momentum indicator that uses support and resistance levels. The term "stochastic" refers to the point of a current price in relation to its price range over a period of time. You can use a New Stochastic in the same way as classical one: Overbought and Oversold areas to make a Buy or Sell orders. This new indicator shows all variety of Fibonacci Levels (from 23.6 to 76.4) which can be used as Overbought and Oversold levels as well as points to close an open positio
MetaCOT 2 is a set of indicators and specialized utilities for the analysis of the U.S. Commodity Futures Trading Commission reports. Thanks to the reports issued by the Commission, it is possible to analyze the size and direction of the positions of the major market participants, which brings the long-term price prediction accuracy to a new higher-quality level, inaccessible to most traders. These indicators, related to the fundamental analysis, can also be used as an effective long-term filter
ZhiBiCCI MT4
Qiuyang Zheng
5 (1)
[ZhiBiCCI] indicators are suitable for all cycle use, and are also suitable for all market varieties. [ZhiBiCCI] Green solid line is a reversal of bullish divergence. The green dotted line is a classic bullish divergence. [ZhiBiCCI] The solid line to the red is a reverse bearish divergence. The red dotted line is a classical bearish divergence. [ZhiBiCCI] can be set in the parameters (Alert, Send mail, Send notification), set to (true) to send instant signals to the alarm window, email, in
Infinity Trend Pro
Yaroslav Varankin
1 (1)
This is a trend indicator without redrawing Developed instead of the binary options strategy (by the color of the Martingale candlestick) Also works well in forex trading When to open trades (binary options) A signal will appear in the place with a candle signaling the current candle It is recommended to open a deal for one candle of the current timeframe M1 and M5 When a blue dot appears, open a deal up When a red dot appears, open a trade down. How to open trades on Forex. When a signal is rec
The indicator displays the data of the Stochastic oscillator from a higher timeframe on the chart. The main and signal lines are displayed in a separate window. The stepped response is not smoothed. The indicator is useful for practicing "manual" forex trading strategies, which use the data from several screens with different timeframes of a single symbol. The indicator uses the settings that are identical to the standard ones, and a drop-down list for selecting the timeframe. Indicator Parame
Are you tired of the uncertainty that arises when your orders fail to stop at a specific line due to the spread? Look no further! Introducing our  indicator that plots candlesticks based on the Ask price instead of the traditional bid-based chart commonly used in MQL4. With this indicator, you can say goodbye to the frustrations caused by the bid-based chart, as it provides you with a more accurate representation of market movements. By utilizing the Ask price, which represents the price at whic
The Th3Eng PipFinite indicator is based on a very excellent analysis of the right trend direction with perfect custom algorithms. It show the true direction and the best point to start trading. With StopLoss point and Three Take Profit points. Also it show the right pivot of the price and small points to order to replace the dynamic support and resistance channel, Which surrounds the price. And Finally it draws a very helpful Box on the left side on the chart includes (take profits and Stop loss
Stepping Trend
Mpendulo Chiliza
The Stepping Trend Indicator     The Steppi ng Trend indicator uses the  average true range  (ATR indicator) in its calculation. This gives you control to set your own average true range period, I set the Default as 10.   Indicator Details. Green Arrow Up: This means you are at the starting point of a new bullish trend, it’s time to buy.   Red  Arrow  Down : This means you are at the starting point of a new  bearish  trend, it’ s time to sell .   What if you miss the Arrow Signal?   No
Wave Wolf MT4
Andrei Salanevich
The Wave Wold MT4 Forex indicator is designed to search for Wolf waves and display them in the current window of the trading terminal. An excellent indicator for traders who use Wolf waves in trading. Its application in trading strategies will significantly increase their efficiency and profitability. INFORMATION ABOUT THE INDICATOR Unlike other Wolf wave indicators, the Wave Wold MT4 forex indicator has a number of features that significantly increase its effectiveness: The first is the
What are Heiken Ashi Candles? Heiken Ashi, derived from the Japanese term 'Heikin Ashi,' translates to average price bars. It's an indicator depicting price bars on a chart. Formula for Heiken Ashi candles: - Heiken Ashi opening price: (previous candle's opening + closing price) / 2 - Closing price Heiken Ashi: (opening + high + low + closing) / 4 - Heiken Ashi peak: Max of high, opening, or closing price - Heiken Ashi bottom price: Min of low, opening, or closing price How to Read Heik
Signal trend indicator. Detects the direction of the trend and is coloured accordingly.  Has built in audible and visual alerts when trends change. Can send notifications to your phone or email. Allows Trend and Counter-Trend trading. Works on all timeframes, all currency pairs, metals, indices and cryptocurrencies. Can be used with binary options. Distinctive features No re-drawing; Simple and clear settings; Four types of alerts; Works on all timeframes and all trading tools; Su
Insider Scalper Binary This tool is designed to trade binary options. for short temporary spends. to make a deal is worth the moment of receiving the signal and only 1 candle if it is m1 then only for a minute and so in accordance with the timeframe. for better results, you need to select well-volatile charts.... recommended currency pairs eur | usd, usd | jpy .... the indicator is already configured, you just have to add it to the chart and trade .... The indicator signals the next can
PABT Pattern Indicator - it's classical system one of the signal patterns. Indicator logic - the Hi & Lo of the bar is fully within the range of the preceding bar, look to trade them as pullback in trend. In the way if indicator found PABT pattern it's drawing two lines and arrow what showing trend way.  - First line - it's entry point and drawing at: 1. On the high of signal bar or on middle of the signal bar (depending from indicator mode) for buy; 2. On the low of signal bar or on middle of t
ZhiBiMACD MT4
Qiuyang Zheng
4.5 (2)
This is a unique MACD indicator that is more accurate and easy to use than traditional MACD. It is suitable for any chart cycle and is suitable for any market variety. The red column is the (Buy) band signal, and the blue column is the (Sell) band signal. The yellow and green lines are trend lines, and the two lines never cross. Buy: In the blue column, look at the green line up through the middle 0 axis. Sell: In the red column, look at the yellow line down the middle 0 axis. The MACD
The indicator shows harmonic patterns on the chart without repainting with the minimum possible lag. The search for indicator tops is based on the wave principle of price analysis. Advanced settings allow you to choose parameters for your trading style. At the opening of a candle (bar), when a new pattern is formed, an arrow of the probable direction of the price movement is fixed, which remains unchanged. The indicator recognizes the following patterns and their varieties: ABCD, Gartley (Butter
Advanced Bollinger Bands Scanner is a multi symbol multi timeframe Bollinger bands dashboard that monitors and analyzes the Bollinger Bands indicator from one chart. This panel monitors the Bollinger bands indicator in up to 28 configurable instruments and 9 timeframes for price overbought/oversold, price consolidation (Bollinger bands squeeze), and consolidation breakout (squeeze break)  with a deep scan feature to scan all market watch symbols (up to 1000 instruments!). Download Demo here  
Keltner Trend Pro - Unleash the Power of Price Action! Are you ready to transform your trading approach? Meet Keltner Trend Pro, an Expert Advisor meticulously crafted to harness the dynamic movements of the market using the renowned Keltner Channel and Average True Range (ATR) indicators. Limited-time Special Opportunity: Seize the moment! Be among the first 10 (Purchasing 0/10) to seize this unique opportunity, and not only will you acquire a top-tier trading algorithm but also enjoy an exclu
Trendiness Index
Libertas LLC
5 (3)
"The trend is your friend" is one of the best known sayings in investing, because capturing large trendy price movements can be extremely profitable. However, trading with the trend is often easier said than done, because many indicators are based on price reversals not trends. These aren't very effective at identifying trendy periods, or predicting whether trends will continue. We developed the Trendiness Index to help address this problem by indicating the strength and direction of price trend
Stoch Arrow
Abdulkarim Karazon
STOCH ARROW is a long short arrow signal type indicator that is based on standard stochastic oscillator this indicator has 3 methods of giving long and short signal that are as follow : 1.whenever stochastic lines cross 2.when a cross happens in overbought and oversold zones (short arrow on overbought zone cross , long arrow on oversold zone cross) 3.when stochastic lines leave overbought and oversold zones (short arrow on leave from overbought zone  , long arrow leave on oversold zone) this ind
Lyne
Maksim Kalachev
About the Lyne indicator Lyne is a Metatrader 4 (MT4) indicator, the essence of which is to transform the accumulated historical data. The Lyne indicator makes it possible to detect various features and patterns in price dynamics that are invisible to the naked eye. Based on this information, traders can anticipate further price movement and adjust their strategy accordingly. This indicator has proven itself in the scalping strategy. The indicator works without repainting.
To get access to MT5 version please click here . - This is the exact conversion from TradingView: "Stochastic Momentum Index" By "UCSgears". - This is a popular version of stochastic oscillator on tradingview. - This is a light-load processing and non-repaint indicator. - Buffers are available for the lines on chart. - You can message in private chat for further changes you need. Thanks for downloading
Double HMA MTF for MT4
Pavel Zamoshnikov
4.2 (5)
This is an advanced multi-timeframe version of the popular Hull Moving Average (HMA). Features Graphical panel with HMA indicator data from all timeframes at the same time . If the HMA has switched its direction on any timeframe, a question mark or exclamation mark is displayed on the panel, accompanied by a text and audio message. The messages can be configured separately for each timeframe using the corresponding checkboxes. The indicator is located in a separate window, so as not to overloa
Buy and sell zones
Evgeniy Zhdan
5 (3)
Indicator for determining flat and trend. If the price is below any of the two histograms and two lines (red and blue), this is a sell zone. When purchasing this version of the indicator, MT5 version for one real and one demo account - as a gift (to receive, write me a private message)! If the price is above any of the two histograms and two lines (red and blue), this is a buy zone. MT5 version:  https://www.mql5.com/en/market/product/70409 If the price is between two lines or in the zone
Buyers of this product also purchase
Gann Made Easy
Oleg Rodin
4.92 (62)
Gann Made Easy is a professional and easy to use Forex trading system which is based on the best principles of trading using the theory of mr. W.D. Gann. The indicator provides accurate BUY and SELL signals including Stop Loss and Take Profit Levels. You can trade even on the go using PUSH notifications. PLEASE CONTACT ME AFTER PURCHASE TO GET MY TRADING TIPS PLUS A GREAT BONUS! Probably you heard already many times about Gann trading methods. Usually Gann's theory is very complex thing not only
CURRENTLY 26% OFF Best Solution for any Newbie or Expert Trader! This Indicator is a unique, high quality and affordable trading tool because we have incorporated a number of proprietary features and a new formula. With only ONE chart you can read Currency Strength for 28 Forex pairs! Imagine how your trading will improve because you are able to pinpoint the exact trigger point of a new trend or scalping opportunity? User manual: click here That's the first one, the original! Don't buy a worthle
Atomic Analyst
Issam Kassas
5 (3)
First of all Its worth emphasizing here that this Trading Indicator is   Non-Repainting ,   Non-Redrawing   and   Non-Lagging   Indicator, Which makes it ideal from both manual and robot trading.  User manual: settings, inputs and strategy . The Atomic Analyst  is a PA Price Action Indicator that uses Strength and Momentum of the price to find a better edge in the market. Equipped with Advanced filters which help remove noises and false signals, and Increase Trading Potential. Using Multiple la
TPSproTREND PrO
Roman Podpora
5 (15)
TPSpro TRENDPRO  - is a trend indicator that automatically analyzes the market and provides information about the trend and each of its changes, as well as giving signals for entering trades without redrawing! The indicator uses each candle, analyzing them separately. referring to different impulses - up or down impulse. Exact entry points into transactions for currencies, crypto, metals, stocks, indices!  -  Version MT5               DETAILED DESCRIPTION        /       TRADING SETUPS           
Advanced Supply Demand
Bernhard Schweigert
4.92 (310)
CURRENTLY 26% OFF !! Best Solution for any Newbie or Expert Trader! This indicator is a unique, high quality and affordable trading tool because we have incorporated a number of proprietary features and a new formula. With this update, you will be able to show double timeframe zones. You will not only be able to show a higher TF but to show both, the chart TF, PLUS the higher TF: SHOWING NESTED ZONES. All Supply Demand traders will love it. :) Important Information Revealed Maximize the potenti
TPSpro RFI Levels
Roman Podpora
5 (13)
A key element in trading is zones or levels from which decisions to buy or sell a trading instrument are made. Despite attempts by major players to conceal their presence in the market, they inevitably leave traces. Our task was to learn how to identify these traces and interpret them correctly. Reversal First Impulse levels (RFI)   -  Version MT5                INSTRUCTIONS                 RUS                 ENG                                       R ecommended to use with an indicator   -  
ON Trade Optuma Astro
Abdullah Alrai
5 (4)
This is an astronomy indicator for the MT4 platform like optuma program that performs a variety of functions. It uses complex algorithms to perform its own calculations, which are so accurate. The indicator has a panel that provides astronomical information such as planets' geo/heliocentric cords, distance of sun/earth, magnitude, elongation, constellation, ecliptic cords, equatorial cords, and horizontal cords depending on  the vertical line that generated by the indicator depend on the time va
This indicator I use with RENKO and RangeBar candle Discover the Secret to Successful Forex Trading with Our Custom MT4 Indicator! Have you ever wondered how to achieve success in the Forex market, consistently earning profits while minimizing risk? Here is the answer you've been searching for! Allow us to introduce our proprietary MT4 indicator that will revolutionize your approach to trading. Unique Versatility Our indicator is specially designed for users who prefer Renko and Rangebar candle
Introducing   Quantum Trend Sniper Indicator , the groundbreaking MQL5 Indicator that's transforming the way you identify and trade trend reversals! Developed by a team of experienced traders with trading experience of over 13 years,   Quantum Trend Sniper Indicator   is designed to propel your trading journey to new heights with its innovative way of identifying trend reversals with extremely high accuracy. ***Buy Quantum Trend Sniper Indicator and you could get Quantum Breakout Indicator fo
Break and Retest
Mohamed Hassan
4.56 (9)
‍You can visually backtest Break & Retest to see how it behaved in the past!     Manual guide:   Click here $65  for only 1  copy left! Next price is $120 .  This Indicator only places quality trades when the market is really in your favor with a clear break and retest. Patience is key with this price action strategy! Recommended timeframes: M1 for Scalpers.  M15 for Intraday traders. H1 & H4 for Day traders. Other timeframes are also excellent! After many months of hard w
Introducing ON Trade Waves Patterns Harmonic Elliot Wolfe, an advanced indicator designed to detect various market patterns using both manual and automated methods. Here's how it works: Harmonic Patterns: This indicator can identify harmonic patterns that appear on your chart. These patterns are essential for traders practicing harmonic trading theory, as popularized by Scott Carney's book "Harmonic Trading vol 1&2." Whether you draw them manually or rely on automated detection, ON Trade Waves
74% discount for the next 10 buyers (original price $605): 1 left Get a 50% bonus by buying (or even renting) any of our products. After buying (or renting), send a message for more information. 3 Indicators in 1 indicator Strategy based on price action Made specifically for the best forex currency pairs Can be used in the best time frame of the market at a very reasonable price This indicator is basically 3 different indicatos . But we have combined these 3 indicators in 1 indicator so th
Currency Strength Wizard is a very powerful indicator that provides you with all-in-one solution for successful trading. The indicator calculates the power of this or that forex pair using the data of all currencies on multiple time frames. This data is represented in a form of easy to use currency index and currency power lines which you can use to see the power of this or that currency. All you need is attach the indicator to the chart you want to trade and the indicator will show you real str
on free demo press zoom out button to see back.. cnt number is bar numbers.you can change up to 3000 related to chart bars numbers. minimum value is 500. there is g value set to 1.01. no need to change it. this indicator almost grail,no repaint and all pairs ,all timeframe indicator. there is red and blue histograms. if gold x sign comes on red histogram that is sell signal. if blue x sign comes on blue histogram that is buy signal. this indicator on thise version works all pairs.al timeframes
FX Power MT4 NG
Daniel Stein
5 (9)
Trading GOLD, and currencies, with the dog walk strategy  - super smart Trading GOLD, and currencies, with the breakout strategy  - super easy Visit our all-new   Stein Investments Welcome Page   to get the latest information, updates and trading strategies. FX Power MT4 NG  is the next generation of our long-time very popular currency strength meter, FX Power.  And what does this next-generation strength meter offer? Everything you have loved about the original FX Power  PLUS GOLD/XAU stre
First of all Its worth emphasizing here that this Trading Tool is Non-Repainting Non-Redrawing and Non-Lagging Indicator Which makes it ideal for professional trading . Online course, user manual and demo. The Smart Price Action Concepts Indicator is a very powerful tool for both new and experienced traders . It packs more than 20 useful indicators into one combining advanced trading ideas like Inner Circle Trader Analysis and Smart Money Concepts Trading Strategies . This indicator focuses on
Scalper Vault
Oleg Rodin
5 (28)
Scalper Vault is a professional scalping system which provides you with everything you need for successful scalping. This indicator is a complete trading system which can be used by forex and binary options traders. The recommended time frame is M5. The system provides you with accurate arrow signals in the direction of the trend. It also provides you with top and bottom signals and Gann market levels. The indicator provides all types of alerts including PUSH notifications. Please contact me aft
Advanced Currency IMPULSE with ALERT
Bernhard Schweigert
4.91 (494)
CURRENTLY 31% OFF !! Best Solution for any Newbie or Expert Trader! This indicator is a unique, high quality and affordable trading tool because we have incorporated a number of proprietary features and a secret formula. With only ONE chart it gives Alerts for all 28 currency pairs. Imagine how your trading will improve because you are able to pinpoint the exact trigger point of a new trend or scalping opportunity! Built on new underlying algorithms it makes it even easier to identify and confir
Shepherd Harmonic Pattern
Abdullah Alrai
4.68 (59)
This indicator will detect harmonic patterns that are drawn on the chart by manual and automatic methods. You can see user manual from this link: Notes Indicator has control panel and it will save every (chart & timeframe) settings. You can minimize it to have more space on chart and you can press close button to hide all indicator data on chart if you prefer to work with other analysis tools  When you use this indicator and change the settings, add indicators like Moving Average or Bollinger
PRO Renko System
Oleg Rodin
5 (25)
PRO Renko System is a highly accurate trading system specially designed for trading RENKO charts. The ARROWS and Trend Indicators DO NOT REPAINT! The system effectively neutralizes so called market noise giving you access to accurate reversal signals. The indicator is very easy to use and has only one parameter responsible for signal generation. You can easily adapt the tool to any trading instrument of your choice and the size of the renko bar. I am always ready to provide extra support to help
Currently 20% OFF ! Best Solution for any Newbie or Expert Trader! This dashboard software is working on 28 currency pairs plus one. It is based on 2 of our main indicators (Advanced Currency Strength 28 and Advanced Currency Impulse). It gives a great overview of the entire Forex market plus Gold or 1 indices. It shows Advanced Currency Strength values, currency speed of movement and signals for 28 Forex pairs in all (9) timeframes. Imagine how your trading will improve when you can watch the e
Symbols must be separated by commas (,) and entered into the parameters exactly as displayed by your broker to ensure they are recognized in the dashboard. These symbols will be used for analysis by the indicator. With one click open any pair any timeframe directly from dashboard The MA Speedometer Dashboard is a highly functional MetaTrader 4 (MT4) indicator designed to enhance trading strategies through dynamic market analysis. It offers robust features for identifying market trends, trading
TrendMaestro
Stefano Frisetti
5 (2)
note: this indicator is for METATRADER4, if you want the version for METATRADER5 this is the link:  https://www.mql5.com/it/market/product/108106 TRENDMAESTRO ver 2.4 TRENDMAESTRO recognizes a new TREND in the bud, he never makes mistakes. The certainty of identifying a new TREND is priceless. DESCRIPTION TRENDMAESTRO identifies a new TREND in the bud, this indicator examines the volatility, volumes and momentum to identify the moment in which there is an explosion of one or more of these data a
Entry Points Pro
Yury Orlov
4.7 (225)
Top indicator for MT4 providing accurate signals to enter a trade without repainting! Watch  the video  (6:22) with an example of processing only one signal that paid off the indicator! It can be applied to any financial assets:  forex, cryptocurrencies, metals, stocks, indices.  MT5 version is here   It will provide pretty accurate trading signals and tell you when it's best to open a trade and close it. Most traders improve their trading results during the first trading week with the help of t
IX Power MT4
Daniel Stein
5 (5)
IX Power finally brings the unbeatable precision of FX Power to non-Forex symbols. It accurately determines the intensity of short, medium and long-term trends in your favourite indices, stocks, commodities, ETFs, and even cryptocurrencies. You can analyse everything your terminal has to offer. Try it out and experience how your timing improves significantly when trading. Read about our latest strategic development -  Easy scalping with IX Power Visit our all-new   Stein Investments Welcome
Up down v6T
Guner Koca
5 (1)
Thise indicator is up down v6  comes with tradingwiev pinescript. purchased people, after installed on terminal ,contact me on mql5  to get BONUS  TradingView pinescript. up-down indicator is no repaint and works all pairs and lower than weekly time frames charts. it is suitable also 1 m charts for all pairs. and hold long way to signal. dont gives too many signals. when red histogram cross trigger line that is up signal.and price probably will down when blue histogram cross trigger line that
Scalper Inside PRO
Alexey Minkov
4.75 (57)
An exclusive indicator that utilizes an innovative algorithm to swiftly and accurately determine the market trend. The indicator automatically calculates opening, closing, and profit levels, providing detailed trading statistics. With these features, you can choose the most appropriate trading instrument for the current market conditions. Additionally, you can easily integrate your own arrow indicators into Scalper Inside Pro to quickly evaluate their statistics and profitability. Scalper Inside
ICT, SMC, SMART MONEY CONCEPTS, SMART MONEY, Smart Money Concept, Support and Resistance, Trend Analysis, Price Action, Market Structure, Order Blocks, BOS/CHoCH,   Breaker Blocks ,  Momentum Shift, Supply&Demand Zone/Order Blocks , Strong Imbalance, HH/LL/HL/LH,    Fair Value Gap, FVG,  Premium  &   Discount   Zones, Fibonacci Retracement, OTE, Buy Side Liquidity, Sell Side Liquidity, BSL/SSL Taken, Equal Highs & Lows, MTF Dashboard, Multiple Time Frame, BigBar, HTF OB, HTF Market Structure,  L
TrendDecoder Premium
Christophe, Pa Trouillas
5 (3)
Identify ranges  | Get earliest signals of Trends  | Get clear exits before reversal  | Spot the Fibo levels the price will test Non-repainting, non-delayed indicator - ideal for manual and automated trading - for all assets and all time units $69   for launch - then back to >>   $149 After purchase,   please contact me on this channel   for recommended and personalised settings MT5   version:  Click here Get our full method with  BladeSCALPER  and   PowerZONES What is it about? TrendDECOD
Quantum Breakout Indicator PRO
Bogdan Ion Puscasu
4.96 (26)
Introducing   Quantum Breakout PRO , the groundbreaking MQL5 Indicator that's transforming the way you trade Breakout Zones! Developed by a team of experienced traders with trading experience of over 13 years, Quantum Breakout PRO is designed to propel your trading journey to new heights with its innovative and dynamic breakout zone strategy. Quantum Breakout Indicator will give you signal arrows on breakout zones with 5 profit target zones and stop loss suggestion based on the breakout box.
More from author
Flexible Grid
Dmitriy Sheykin
5 (8)
MT5 version here The Flexible Grid EA uses the RSI indicator to enter the trade. To enter BUY, the RSI must cross the bottom up the value specified in the EA parameters (for the sales, on the contrary, cross from top to bottom). In case of a successful entry, the transaction closes either according to Take Profit, or Trailing Stop is used. If the market goes in opposite direction, the order grid opens at a specified distance from the average price of the grid. Also, newly opened orders ca
MT4 version here The   Flexible Grid   EA uses the RSI indicator to enter the trade. To enter BUY, the RSI must cross the bottom up the value specified in the EA parameters (for the sales, on the contrary, cross from top to bottom). In case of a successful entry, the transaction closes either according to Take Profit, or Trailing Stop is used. If the market goes in opposite direction, the order grid opens at a specified distance from the average price of the grid. Also, newly opened orders
Filter:
intan08
1382
intan08 2021.11.12 08:38 
 

Excellent.

new1977
242
new1977 2020.05.13 03:57 
 

User didn't leave any comment to the rating

Reply to review
Version 1.1 2020.05.07
Alert added