The indicator finds many WolfeWave. But you have to change the parameters repeatedly. This leads to the fact that you have to go into the settings all the time to get 100% or 75%. I have set up several time units and adjusted various parameters. For example M5 with 500/12, M5 with 500/4, M30 with 500/12 and M30 with 1300/10. Unfortunately, the Metatrader is completely overtaxed with it. It often does not react, crashes, the display freezes. I have opened a new Metatrader only for the WolfeWave. But even if you only run the WolfeWave and no other indicators, the display freezes constantly, I can't make changes. The found WolfeWave are good. It often runs every point exactly. However, then there is only TP1 or TP2, but no exact price information. There is an alarm when a new WolfeWave is found, but I would prefer it if there would also be an alarm when the TPs are reached. Another problem is: If you want to open the Metatrader, the WolfeWave shows all last alarms in an extra window. These are actually done. Thus it can happen that the Metatrader does not open or the display freezes. This should be changed by the programmer, so that the Metatrader can open without alarms of the WolfeWave. All in all there are too many technical problems. This is more than annoying, because you don't know that before you buy it.
- Overview
- Reviews (2)
- Comments (17)
- What's new
Wolfe Scanner Pro
WOLFE WAVE PATTERNs
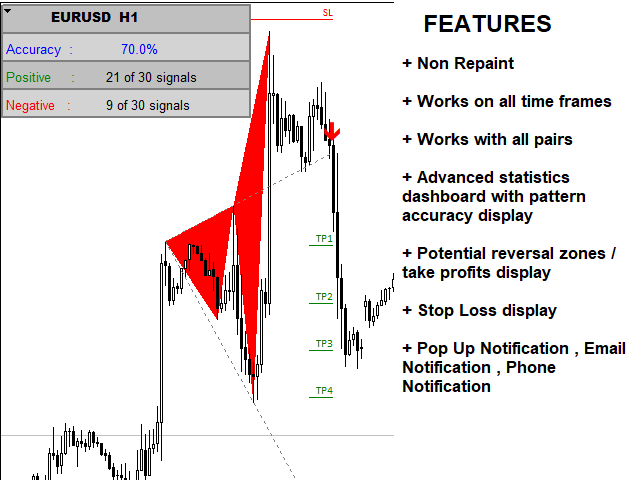
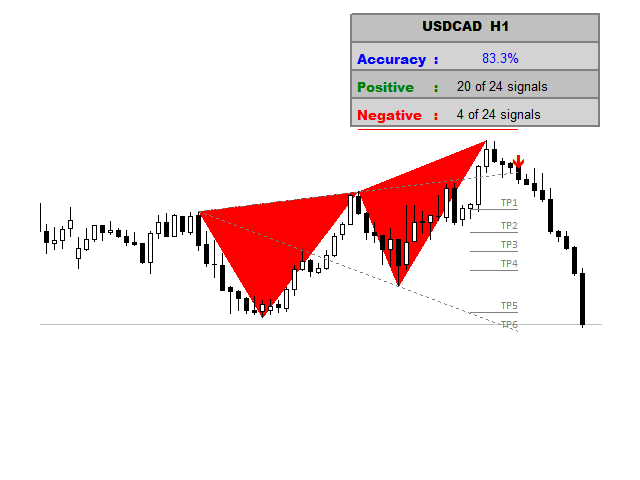
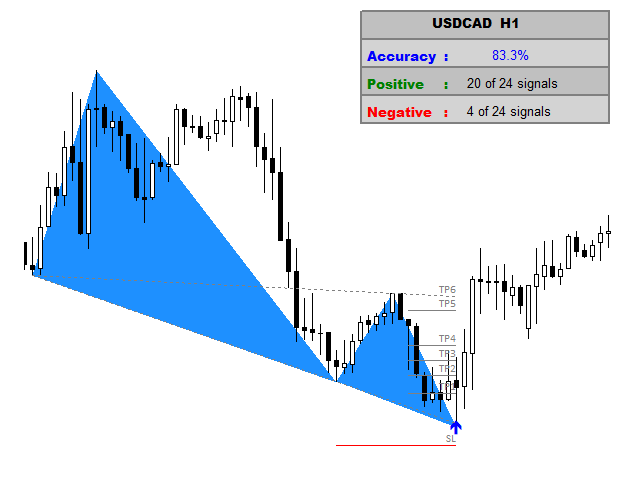
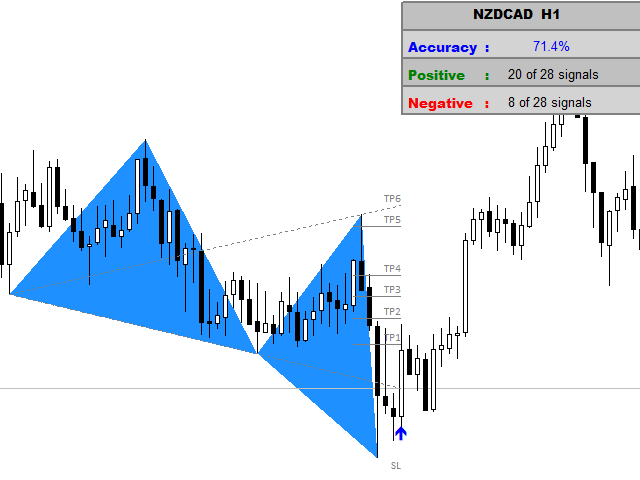
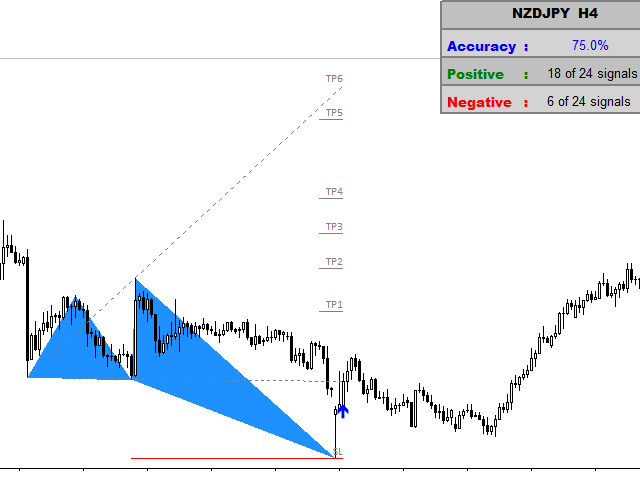
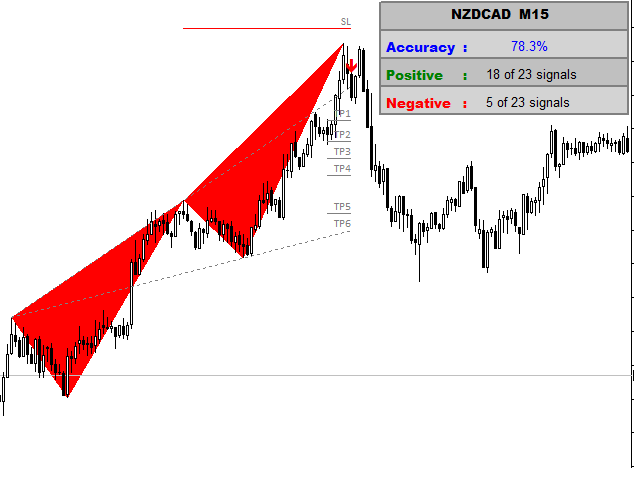
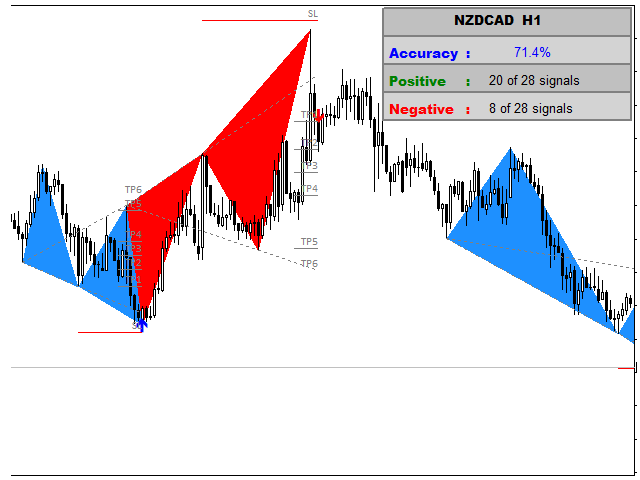
First discovered by Bille Wolfe . The wolfe wave is a 5 wave price action pattern that is formed by supply and demand in a market and the fight to reach equilibrium in the market. The entry spot of the pattern is defined by the breakout of the trend created by wave 1 and wave 3 . This pattern forms in any market where there is supply and demand thus it can also be used to trade commodities and stocks. Wolfe Waves are reversal patterns that usually carry a low risk margin.
Product Features
- The Pattern Signals are non-repaint
- The product scans Wolfe wave patterns on any time frame and currency pair.
- It comes with a statistics dashboard that shows pattern accuracy.
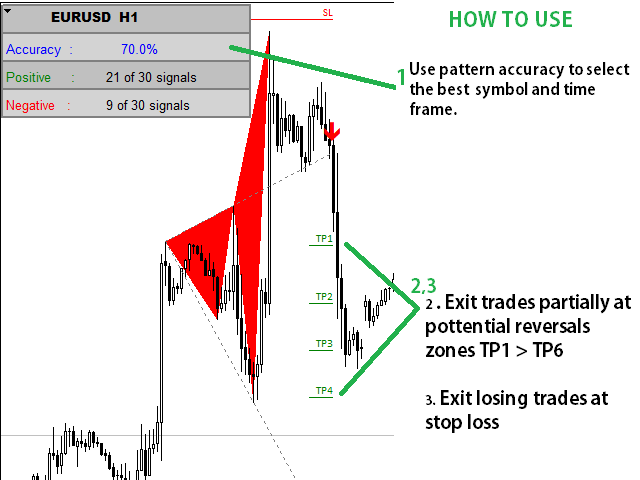
- Each pattern has a stop loss and 5 Fibonacci targets .
- The scanner also comes with a notification system for when patterns are formed.
INPUTs
- Scan Range : Numbers of history bars to scan
- Pattern Period : Used to define pattern points, lower period will scan closer pattern points
- TP1 : First Target Fibonacci Ratio
- TP2 : Second Target Fibonacci Ratio
- TP3 : Third Target Fibonacci Ratio
- TP4 : Fourth Target Fibonacci Ratio
- TP5 : Fifth Target Fibonacci Ratio
- TP6 : Sixth Target Fibonacci Ratio
- Pop Up : Pop Up Alert
- Email : Email Alerts
- Phone : Phone Notifications
Video
Reviews 2
Recommended products

Levels ATR
30 USD Hafis Mohamed Yacine
The ATR Levels Indicator For MT4 is an indicator that is built specifically for traders who use the Meta Trader 4 for their trading analysis, charting of different currency pairs and trading assets, doing their technical analysis and making trading decisions all through the trading day as they work.
One of the first major advantages of using the ATR Levels Indicator For MT4 is that it automatically helps the trader to spot very important levels in the markets based on the Average True Range In

Weis Wave for MT4
100 USD Ruslan Safin
This indicator is analogous to Weis Wave from the recognized expert David Weiss. It is a modern adaptation of the Wyckoff Method featuring 30-years experience on different markets. The main indicator objective is to calculate the cumulative volumes of the previous waves and the current one.
Indicator Features It responds to changes in a price behavior of the current wave. The indicator may begin to form a new unconfirmed wave. It works in all possible time periods. Four types of different pric

Fibonacci SR Indicator
45 USD Martin Eshleman
Fibonacci SR Indicator This indicator creates support and resistance lines. This indicator is based on Fibonacci Retracement and Extension levels. It will consider many combinations of the Fibonacci levels and draw support/resistance lines based on these. This indicator uses tops and bottoms drawn by the ZigZag indicator in its calculations. The ZigZag can also be drawn on the chart, if necessary. The indicator considers many combinations of past reversal points and Fibonacci ratio levels, and w

PipTick Currency Barometer MT4
67 USD Michal Jurnik
PipTick Currency Barometer is one of our most favorite indicators. It measures the strength of two currencies represented in the pair and compares the difference between them. The result is shown as a histogram where you can simply identify which currency is the strongest. This indicator is designed to measure the strengths and weaknesses of eight major currencies (USD, EUR, GBP, CHF, CAD, JPY, AUD and NZD) and works on 28 currency pairs. The PipTick Currency Barometer uses CCI method (Commodity

Mean Reversion Supply Demand MT4
80 USD Young Ho Seo
Supply Demand with Mean Reversion Concept The concept of supply demand trading rely on the quantity mismatching between buying and selling volumes in financial markets. To typical traders, supply demand zone serves as the turning point. When we looked at its original concept, we have found that the original supply demand trading can be performed better at mean reversion period rather than trend period. For the demonstration of this concept, for any supply demand zone to work as an successful tra

Heiken Ashi and Heiken Ashi Smoothed MA MT4
50 USD Ku Chuan Lien
Heiken Ashi Smoothed Strategy is a very simple but powerful system to get forex market trend direction. This indicator is actually 2 indicators in 1 pack, Heiken Ashi and Heiken Ashi Smoothed Moving Average both included. Because HA (Heiken Ashi) and HAS (Heiken Ashi Smoothed) are calculated in the same one system event with necessary buffers and loop only, so it is the FAST, OPTIMIZED and EFFICIENT HA having the combined indicator of MetaTrader 4. You can choose to display HA and HAS in the sam

Trendiness Index
49 USD Libertas LLC
"The trend is your friend" is one of the best known sayings in investing, because capturing large trendy price movements can be extremely profitable. However, trading with the trend is often easier said than done, because many indicators are based on price reversals not trends. These aren't very effective at identifying trendy periods, or predicting whether trends will continue. We developed the Trendiness Index to help address this problem by indicating the strength and direction of price trend

BEST Intraday
45 USD Oleg Borisov
Effective indicator for intraday trading. It is based on original author's algorithms and uses Laguerre transformations and modified CCI. Advantages of the indicator BEST it is clearly displays the market movement and generates signals for entry and exit of trade transactions the profitability of the indicator is shown in the screenshots just configured does not redraw and works on opening bars. Timeframes- M5-M15. Recommendations for using the BEST in order to always get a good profit with the

The Sextet Scalper Pro
49 USD Naim El Hajj
The Sextet Scalper Pro is an MT4 indicator that gives signals when new waves are starting in a trend. The trends are calculated using the original " The Sextet " indicator method. You get a free EA to trade with The Sextet Scalper Pro: Free EA . Default settings were optimized on GBPUSD H1 from 2017.
EA could be tested on free demo version of The Sextet Scalper Pro, before purchase. Key Features: Uses The Sextet Trend Detection Method which is already a good strategy in itself for detecting l

Master Binary Trading Signals
100 USD ORAZIO CIANCI
Master Binary Trading Signals EARN MONEY QUICKLY WITHOUT EXPERIENCE. WOULD YOU LIKE TO EARN MONEY WITH BINARY OPTIONS BUT THERE ARE ONLY POOR PRODUCTS AROUND AT REALLY EXAGGERATED PRICES? HOW MANY TIMES HAVE YOU WASTED MONEY ON THESE INDICATORS WHICH IN THE END AND COMPLICATED TO USE AND ONLY MAKE YOU LOSE MONEY? IF I TOLD YOU THIS IS ALL GOING TO END NOW, WOULD YOU BELIEVE ME? I KNEW IT.
MASTER BINARY TRADING SIGNAL WILL BE ABLE TO HELP YOU. IT WILL GIVE YOU WHAT YOU NEED. SIMPLE TO USE, SI

Vol MACD
30 USD Calin Adrian David
The MACD indicator is based on volume , which can offer us a very valuable type of information (it marks the long or short strength of each candle), es pecially if we are operating in shorter time frames. Green = bullish signal; Red = bearish signal; Blue = MACD volume
Parameters: Fast: Numbers of bars used for fast period calculations Slow: Numbers of bars used for slow period calculations

Zig Zag 123
30 USD Stephen Reynolds
Zig Zag 123 tells us when a reversal or continuation is more likely by looking at the shift in supply and demand. When this happens a signature pattern appears known as 123 (also known ABC) will often break out in direction of higher low or lower high.
Stop loss and take profit levels have been added. There is a panel that shows the overall performance of your trades for if you was to use these stop loss and take profit levels.
We get alerted if a pattern 123 appears and also if the price r

Blahtech Supply Demand
124 USD Blahtech Limited
Supply Demand uses previous price action to identify potential imbalances between buyers and sellers. The key is to identify the better odds zones, not just the untouched ones. Blahtech Supply Demand indicator delivers functionality previously unavailable on any trading platform. This 4-in-1 indicator not only highlights the higher probability zones using a multi-criteria strength engine, but also combines it with multi-timeframe trend analysis, previously confirmed swings and engulfing detector

US30 Autopilot 3D
99.99 USD Jw Donerson Iii
THIS INDICATOR WORKS ON ALL BROKERS EXCEPT COINEXX..CLICK HERE FOR IF YOU HAVE COINEXX https://www.mql5.com/en/market/product/43644
The 3D Bank Time Autopilot indicator is a game changer and there is nothing else like it. It measures market sentiment, volume and momentum to give you the most accurate price points to trade. We utilized this indicator when the stock market and the US bank opening to trade US30. There are set rules to follow and nothing is 100% but we have around a 97% accuracy

Strict Volume
66 USD Ivan Simonika
Volume indicator Strict Volume , in the Forex market, volumes are peculiar (tick). This volume indicator shows the level of financial and emotional involvement. When the indicator forms a new peak, this suggests that buyers are stronger than sellers for a certain period of time. If the indicator decreases, this indicates that bears are stronger.
Why is it impossible to track normal volumes on Forex? The fact is that this is an over-the-counter market. Therefore, it is practically impossible t

TradingDesk
79 USD Christian Weilinger
TradingDesk – Performance Analyse MT4
To test the indicator download free Demo version here: https://www.mql5.com/en/market/product/40471
TradingDesk analysed MetaTrader 4 historical data by Symbol, Magic Number, Trade or Comment. All these evaluations will be displayed in real time on your MetaTrader 4 chart window.
All this information will be displayed in the following dashboards: account info General information about the account is displayed in the account info dashboard. performance

Modified TTM Squeeze Indicator
149 USD Libertas LLC
"The Squeeze indicator attempts to identify periods of consolidation in a market. In general the market is either in a period of quiet consolidation or vertical price discovery. By identifying these calm periods, we have a better opportunity of getting into trades with the potential for larger moves. Once a market enters into a "squeeze," we watch the overall market momentum to help forecast the market direction and await a release of market energy." The Modified TTM Squeeze Indicator is a modif

PipTick Supply Demand
97 USD Michal Jurnik
PipTick Supply Demand is the best indicator we have ever made. This great tool automatically draws a supply and demand zones which are the best places for opening and closing the positions. It has many advanced features such as multi timeframe zones support, displaying width of zones, alert notifications for retouched zones and much more. Because of principle of market fractality, this indicator can be used for any kind of trading. It does not matter whether you are positional, swing or intraday

TrustyTrader
30 USD Paolo Miocchi
TrustyTrader is a professional indicator based on a proprietary algorithm that suitably combines and filters moving averages to detect profitable trends. Through a deep statistical analysis and a built-in optimizer, it provides reliable alert signals to enter the market, along with solid indications on optimal Stop-Loss (SL) and Take-Profit (TP) levels. The indicator is never either repainted/backpainted or recalculated and signals are strictly on the "Close of the bar" (try the free DEMO or see

Infinity TrendLine PRO
99 USD Evgenii Aksenov
PROMO: Buy Trend Line PRO today and contact me to get for free:
1) User's Manual about the indicator and built in pop-up Scanner 2) Settings files for Bitcoin, GOLD, EURUSD, GBPUSD 3) HTF Histogram (basement indicator) which shows Higher TimeFrame trend in the bottom of chart 4) Trend Line Expert Advisor which trades Trend Line PRO indicator signals automatically !!! TrendLine PRO indicator is based on the analysis of the strength of bulls and bears. TrendLine PRO never repaint and do

Harmonic Papallons
149 USD Ramon Sobrevals Arce
We have perfected this indicator to predict accurately the future market movements. Harmonic Papallons will give you the best price within a REVERSAL. Automatically scans the chart to find these Harmonic Patterns, and give you the chance to enter early in good operations. Also if selected, it will alert you in advance when future patterns appears. The main goal for this algorithm is to determine with high precision the moment when a trend ends and a new one begins. THE G LDEN TRADE, Th

Super Gator
150 USD Agustinus Biotamalo Lumbantoruan
This indi shows the following 1. Supertrend 2. Alligator (Not a regular alligator)
3. ZigZag 4. Moving Average 5. Trend Continuation/Mini correction Signal (plotted in X) (See screenshots in green background color
6. Early Signal Detection (See screenshots in green background color)
You may treat Alligator as the lagging indicator
The leading indicator is the supertrend. The zig zag is based on the leading indicator where it gets plotted when the leading indicator got broken to the opposite.

PipFinite Exit EDGE
88 USD Karlo Wilson Vendiola
Did You Have A Profitable Trade But Suddenly Reversed? In a solid strategy, exiting a trade is equally important as entering.
Exit EDGE helps maximize your current trade profit and avoid turning winning trades to losers.
Never Miss An Exit Signal Again
Monitor all pairs and timeframes in just 1 chart www.mql5.com/en/blogs/post/726558
How To Trade You can close your open trades as soon as you receive a signal
Close your Buy orders if you receive an Exit Buy Signal. Close your Sell orde

PZ Lopez Pressure
30 USD Arturo Lopez Perez
This indicator anticipates price reversals analyzing bullish and bearish pressure in the market. The buying pressure is the sum of all the accumulation bars over a certain number of days, multiplied by the volume. The selling pressure is the sum of all of the distribution over the same number of bars, multiplied by the volume. [ Installation Guide | Update Guide | Troubleshooting | FAQ | All Products ] The indicator ratio gives you a measure of the buying pressure as a percentage of the total ac

StdATR Squeeze Channel
49 USD Libertas LLC
"The Squeeze indicator attempts to identify periods of consolidation in a market. In general the market is either in a period of quiet consolidation or vertical price discovery. By identifying these calm periods, we have a better opportunity of getting into trades with the potential for larger moves. Once a market enters into a "squeeze," we watch the overall market momentum to help forecast the market direction and await a release of market energy." The StdATR Squeeze Channel combines standard

PipFinite Trend PRO
98 USD Karlo Wilson Vendiola
Breakthrough Solution For Trend Trading And Filtering With All Important Features Built Inside One Tool! Trend Pro's smart algorithm detects the trend, filters out market noise and gives entry signals with exit levels. The new features with enhanced rules for statistical calculation improved the overall performance of this indicator.
Important Information Revealed Maximize the potential of Trend Pro, please visit www.mql5.com/en/blogs/post/713938 Test the demo version and explore its feature

Wolfe Wave Indicator
355 USD BJF Trading Group inc. (2202934 ON inc.)
MetaTrader 4 Wolfe Wave Indicator draws Wolfe Wave in fully automated mode. Benefits We do not use ZigZag and work with fractals. Our indicator can recognize all Wolfe Wave patterns on specified time range. So we check every top for potential 1,2,3,4,5 points not only ZigZag tops . Indicator has a lot of adjustable parameters.

Color Macd Tf
47.14 USD Syarif Nur Arief
MACD is well known indicator that still can be use for prediction where price will go next few minutes, hours or even weekly With colored bar of Macd, your eyes can easily catch when color is changed based what market price movement to find any early trend on market. here is the parameter of the indicator: TF_MACD , default is 1 Hour , this mean you can see clearly MACD of 1 Hour TimeFrame on Lower TimeFrame. InpPrice , default is Price Close , this is original MACD parameter from Metaquotes st

Overlay Renko MT4
30 USD Pierce Vallieres
Overlay Renko is an indicator which plots Renko bricks overtop of the chart. You can select the brick size as well as whether or not to use the close price or the high/low price of the candles. Typically Renko bricks are based on price alone, not time, however unlike normal Renko bricks the only difference is this indicator allows you to see the price action going on within each Brick by overlaying the bricks on top of the standard chart. Renko bricks are extremely useful for trend trading and m

Trend Line Map Pro
49 USD Sayadi Achraf
️ ️ ️ ️ ️ TREND LINE MAP ️️️ ️️
Trend Line Map indicator is an addons for Trend Screener . It's working as a scanner for all signals generated by Trend screener ( Trend Line Signals ) .
Important Note :
1. Active Signals Performance via TREND LINE MAP INDICATOR ( Daily Update ) Click Here 2. Trend Line Map is a Trend Line Scanner based on Trend Screener Indicator. Please make sure that you get Trend Screener Pro before getting Trend Line Map indicator.
3.
Buyers of this product also purchase

Entry Points Pro
125 USD Yury Orlov
This is a trend indicator for MT4 providing accurate signals to enter a trade without redrawing or delays.
It can be applied to any financial assets: forex, cryptocurrencies, metals, stocks, indices . The best results are on the timeframe M15+
Our Telegram group | MT5 version of the indicator
IMPORTANT! Contact me after your purchase to get the detailed guide and bonus. Video (6:22) - one signal that made a profit equal to triple the price of the indicator. Video (4:4

Advanced Supply Demand
148 USD Bernhard Schweigert
CURRENTLY 33% OFF !! Best Solution for any Newbie or Expert Trader! This indicator is a unique, high quality and affordable trading tool because we have incorporated a number of proprietary features and a new formula. With this update, you will be able to show double timeframe zones . You will not only be able to show a higher TF but to show both, the chart TF, PLUS the higher TF: SHOWING NESTED ZONES . All Supply Demand traders will love it. :) Important Information Revealed
Maximize th

Advanced Currency Strength28 Indicator
148 USD Bernhard Schweigert
CURRENTLY 26% OFF Best Solution for any Newbie or Expert Trader! This Indicator is a unique, high quality and affordable trading tool because we have incorporated a number of proprietary features and a new formula. With only ONE chart you can read Currency Strength for 28 Forex pairs! Imagine how your trading will improve because you are able to pinpoint the exact trigger point of a new trend or scalping opportunity? User manual: click here That's the first one, the original! Don't buy a worthle

PipFinite Breakout EDGE
98 USD Karlo Wilson Vendiola
The Missing Edge You Need To Catch Breakouts Like A Pro. Follow a step-by-step system that detects the most powerful breakouts!
Discover market patterns that generate massive rewards based on a proven and tested strategy.
Unlock Your Serious Edge
Get it here www.mql5.com/en/blogs/post/723208
Have access to the game changing indicator that will take your trading to the next level!
How To Trade
Execute your trades in 3 Easy Steps!
Step 1: Trade Setup Enter a signal if Success Rate is

Best Currency Strength Indicator
149 USD Tumelo Rakotsoane
Advanced Currency Strength Indicator
The Advanced Divergence Currency Strength Indicator. Not only it breaks down all 28 forex currency pairs and calculates the strength of individual currencies across all timeframes , but, You'll be analyzing the WHOLE forex market in 1 window (In just 1 minute) . This indicator is very powerful because it reveals the true movements of the market. It is highly recommended to analyze charts knowing the performance of individual currencies or the countries ec

Trading Chaos Map
125 USD Andrey Sinegovskiy
For those who studies Bill Williams' books "New Trading Dimensions" and "Trading Chaos (Second Edition)" and tries trading using these methods, it becomes evident that the standard set of indicators is not sufficient for full-fledged work. The Trading Chaos Map indicator draws the "market map", thus allowing you to the charts the same way as the author of the trilogy. Parameters provide options for enabling and disabling each signal. You can use any of the methods, or use them in conjunction. Yo

Best And Worst Dashboard
100 USD Chantal Sala
Best and worst Dashboard was born from the idea to have a panel that includes all the symbols in a chart. It is very importance to understand which symbols are both positive and negative. In the past, we realized the single indicator Best and Worst ( https://www.mql5.com/en/market/product/11784 ), now thanks to the upgrading of the Metatrader the dashboard displays all the instruments simultaneously. A great revolution. This Dashboard is able to calculate performance at any time frame and clicki

TPA True Price Action MT4 Indicator
168 USD InvestSoft
TPA True Price Action indicator reveals the true price action of the market makers through 100% non-repainting signals (except early signals mode) strictly at the close of a candle!
TPA shows entries and re-entries, every time the bulls are definitely stronger than the bears and vice versa. Not to confuse with red/green candles. The shift of power gets confirmed at the earliest stage and is ONE exit strategy of several. The first part of the TPA manual "The Basics" is now available (free to g

TickUnit Scalper Currency Strength28 PRO
148 USD Bernhard Schweigert
CURRENTLY 26% OFF !! This indicator is a super combination of both our main indicators ( Advanced Currency Strength 28 and Advanced Currency IMPULSE with ALERT ). It shows Currency Strength values for TICK-UNITS and alert signals for 28 Forex pairs. 11 different Tick-Units can be used. Those are 1, 2, 3, 4, 5, 6, 10, 12, 15, 20, and 30 Seconds. The Tick-Unit bar in the sub-window will be shown and shifted to the left when there is at least 1 tick within the second’s timer. With only ONE

Advanced Dashboard for Currency Strength and Speed
199 USD Bernhard Schweigert
CURRENTLY 20% OFF !! Best Solution for any Newbie or Expert Trader! This dashboard software is working on 28 currency pairs. It is based on 2 of our main indicators (Advanced Currency Strength 28 and Advanced Currency Impulse). It gives a great overview of the entire Forex market. It shows Advanced Currency Strength values, currency speed of movement and signals for 28 Forex pairs in all (9) timeframes. Imagine how your trading will improve when you can watch the entire market using a sin

Square of 9 for all
99.99 USD Francesco Rubeo
Welcome all to the famous Gann's "Square Of 9"!! This method was used by one of the best traders in the history, a person who made his way among the top traders. An "Holy Grail" for whoever wants to learn trading. The "Square of 9" was used by this genius to find the market's future supports and future resistances. Nowadays is possible to find them with just a click, thanks to softwares. At the time Gann was using just his set of square and goniometer!! Gann describes, partially, the tecnique on

PipTick VSA MT4
97 USD Michal Jurnik
PipTick VSA is based on the original Volume Spread Analysis method. It was designed for quick and easy recognition of VSA patterns. Even though this indicator looks very simple, it is the most sophisticated tool that we have ever made. PipTick VSA indicator is a really powerful analytical tool that generates very reliable trading signals. Because it is very user friendly and understandable, it is suitable for every type of trader, regardless of their experience.
What Is VSA? VSA (Volume Spread

FXtraderariel Indicator
100 USD Ariel Capja
This is the FXTraderariel-Indicator . It scans the market for opportunities and creates a buy or sell signal. Depending on the settings and trading style, it can be used for scalping or long-term trading . The indicator can be used on every time frame , but we advise to use it on H1, H4 and D1 . Especially if you are a novice trader. Pro Traders can also you use it for scalping in smaller timeframes (M1, M5 and M15). This indicator is not a complete trading system. It doesn't give you exit point

MACD Currency Meter
125 USD Emir Revolledo
telegram link : https://t.me/joinchat/RTSgzlmYXyj7_8oP
WELCOME to the very new algorithm in the market which you have never seen before. MACD Currency Strength Meter: 2 indicators in 1! MACD Currency Meter : A MACD indicator with the power of Currency Strength Meter. MACD - a indicator which is good to know the momentum of a Pair Currency Strength Meter is used for tracing market trends.. If you are a fan of MACD and Currency Strength Meter, this indicator is the one for you. MACD-CSM is s

Currency Strength Matrix
98 USD Raymond Gilmour
THE ONLY CURRENCY STRENGTH INDICATOR THAT IS BASED ON PRICE ACTION. DESIGNED FOR TREND, MOMENTUM & REVERSAL TRADERS
This indicator reads price action to confirm trend and strength . Advanced multi-currency and multi-time frame indicator that shows you simply by looking at one chart, every currency pair that is trending and the strongest and weakest currencies driving those trends.
For full details on how to use this indicator, and also how to get a FREE chart tool, please see user manual HER

Naked Forex Kangaroo Tail
147 USD Renaud Candel
Kangaroo Tail Indicator is a pattern recognition indicator for Forex, Stocks, Indices, Commodities, Metals, Cryptos. The Kangaroo Tail is a simple and very effective pattern to trade. The strategy that comes with the Kangaroo Tail is purely based on price action. Inputs of the indicator are : Distance: distance in pixel relative to top or bottom of candle to display the arrow symbol MaxBars: number of bars back used to calculate the indicator TradeDirection (Long/Short/LongAndShort): filter sign

ShvedSupDem Pro Zone
120 USD Andrey Shvedov
Let us analyze what supply and demand are, and how relevant the expression "market memory" is. The screenshots show the operation of the SupDem-Pro custom indicator, it is the improved version of my previously created Shved Supply and Demand indicator. In order to create it, I gave up trading for almost 3 years and studied a lot of literature, I have not traded during this time, but only analyzed the behavior of the price in different situations. It took me quite a long time to correctly formula

Blahtech Market Profile
124 USD Blahtech Limited
Market Profile defines a number of day types that can help the trader to determine market behaviour. A key feature is the Value Area, representing the range of price action where 70% of trading took place. Understanding the Value Area can give traders valuable insight into market direction and establish the higher odds trade. It is an excellent addition to any system you may be using. Blahtech Limited presents their Market Profile indicator for the MetaTrader community. Inspired by Jim Dalton’s

Currency Strength Exotics
128 USD Bernhard Schweigert
CURRENTLY 20% OFF !! Best Solution for any Newbie or Expert Trader! This Indicator is specialized to show currency strength for any symbols like Exotic Pairs Commodities, Indexes or Futures . Is first of its kind, any symbol can be added to the 9th line to show TRUE CURRENCY STRENGTH of Gold, Silver, Oil, DAX, US30, MXN, TRY, CNH etc. This is a unique, high quality and affordable trading tool because we have incorporated a number of proprietary features and a new formula. Imagine how your

Ultimate Double Top Bottom Reversal Scanner
119 USD FXsolutions
This indicator scans for you up to 30 trading instruments and up to 8 timeframes for occurrences of the high probability reversal patterns: Double Tops/Bottoms with fake breakouts . Please read also the blog post " Professional Trading With Double Tops/Bottoms And Divergences! " which explains the concepts behind the ULTIMATE Double Top/Bottom indicator and how you can use a professional top-down approach. You can get alerts via MetaTrader 4, email and push notifications at the moment when a sig

PROscalper
99 USD Paul Reymkhe
PROscalper is a perfect tool for traders who use the scalping strategy! It gives you the visual view of the main Stoploss , Takeprofits and current/last pips on the chart and also in the integrated menu . So with this overview you have the high quality indicator for scalping! You can use PROscalper on any timeframes and on any pairs , but lower timeframes are recommended. To improve results , you can combine PROscalper with a Trendindicator (TrendfollowerSR) to get a dual confirmation for the en

Automated Trendlines
99 USD Georgios Kalomoiropoulos
Trendlines are the most essential tool of technical analysis in forex trading. Unfortunately, most traders don’t draw them correctly. Automated Trendlines indicator is a professional tool for serious traders that help you visualize the trending movement of the markets .
There are two types of Trendlines Bullish Trendlines and Bearish Trendlines.
In the uptrend, Forex trend line is drawn through the lowest swing-points of the price move.
Connecting at least two "lowest lows" will create a

Excessive Momentum Indicator MT4
200 USD Young Ho Seo
Introduction Excessive Momentum Indicator is the first indicator to measure the excessive momentum directly from raw price series. Hence, this is an extended price action and pattern trading. Excessive Momentum Indicator was originally developed by Young Ho Seo. This indicator demonstrates the concept of Equilibrium Fractal Wave and Practical Application at the same time. Excessive Momentum detects the market anomaly. Excessive momentum will give us a lot of clue about potential reversal and bre

StrongCurrency
150 USD Daying Cao
This StrongCurrency is a complete trading system based on a variety of technical indicators, moving averages and pivots. Each of those elements can be assessed in defined rules and coefficients (depending on the indicator) providing limitless optimization scenarios for the StrongCurrency. In order to work the StrongCurrency creates a trend strength and entry point signal list display by evaluating these data, that takes data from all symbols. It extrapolates all the information in order to get t

Beast Super Signal
119.20 USD Dustin Vlok
TODAY IS THE LAST DAY OF OUR FLASH SALE! Get 20% off all of our products! Was $149 now only $119,20!
The Beast Super Signal is a simple, and easy to use trend based indicator. It will continuously monitor current price action looking for new trends developing or strong reversals building at extreme price levels, and trends that have reached strong exhaustion level The Beast Super Signal indicator will monitor the current price, and only when all of the internal strategies align, and are in

TrendfollowerSR
119 USD Paul Reymkhe
B ULL B EAR I NNOVATION
️ Technology To Success ️
Correct identification of the trends in stock investments are pivotal and TrendFollowerSR ensures this perspective while displaying the correct trend on multiply timeframes to help you go long way as much as possible. The latest technology of the Indicator enables to track whether if a certain trend has just begun ,

Pro Currency Strength Meter
129 USD Oystein Knudsen
Currency Strength Meters are a great way to identify strong and weak currencies. With this CSM indicator attached to your chart, you will get a clear overlook over the 8 major currencies: USD, EUR, JPY, CAD, CHF, GBP, AUD, and NZD.
Suggested timeframes to scan is: M15 - H1 - H4 - Daily You can however just change timeframe to check in the settings. Bear in mind that scanning very low timeframes such as M1 will require a lot of resources and might make your mt4 terminal slow.
The strength s

EFW Pattern Trader MT4
100 USD Young Ho Seo
EFW Pattern Trader is a Powerful Pattern Scanner for your trading. The main pattern detection methods in this software follows the principle of Equilibrium Fractal Wave (EFW Notation using shape ratio and propagation ratio, original concept created by Young Ho, Seo). Therefore, our EFW Pattern Trader provides an effective pattern detection algorithm. Any patterns in EFW Pattern Trader can be backtested visually in your strategy tester. Visual backtesting with pattern will show you how pattern wi

Rsi Macd Warden
99 USD Glaramara LLC
RSI.MACD Warden is an innovative indicator for MetaTrader 4 running a versatile algorithm aimed at identifying RSI , MACD and Stochastic divergences. This indicator looks back for a set number of bars and draws lines when a normal or hidden divergence is identified. The smaller the lookback period the faster is the indicator. A divergence line is plotted on the chart when an RSI divergence between A and B points is also confirmed by MACD and Stochastic divergences between the same points on the

Actual Levels
99 USD Ilya Fomin
The indicator shows significant support and resistance levels. When the price approaches these levels, it in some way responds either to the levels themselves, or to the areas that are near these levels. These levels can be viewed as potential reversal zone. Accordingly, the levels can be used for performing trading operations or closing previously opened positions.
For example You can buy if the price rolls back from the support level upwards, or sell if the price rolls back from the resistan
More from author

One to Three Trendline Breakout
89 USD Nesimeye Oswald
This indicator scans the 1-3 Trendline pattern . The indicator is a 100 % non repaint low risk breakout system . The patterns are formed around swing high and swing lows which make them a low risk pattern with high reward.
PATTERN BACKGROUND The 1-3 Trendline Breakout pattern is formed by four(4) points which are composed of three (3) primary points and the pattern neck. A trendline is always formed by the point 1 and the neck of the pattern . When price breaks out of the trendline formed , it

I to 3 Trendline Breakout
89 USD Nesimeye Oswald
This indicator scans the 1-3 Trendline pattern . The indicator is a 100 % non repaint low risk breakout system . The patterns are formed around swing high and swing lows which make them a low risk pattern with high reward.
PATTERN BACKGROUND The 1-3 Trendline Breakout pattern is formed by four(4) points which are composed of three (3) primary points and the pattern neck. A trendline is always formed by the point 1 and the neck of the pattern . When price breaks out of the trendline formed ,

Advanced Trade Manager Pro
30 USD Nesimeye Oswald
Ask any successful forex traders the secret of their success and they will tell you that the first key to a successful forex trading is proper trade management. Trade management is what differentiates the rookie from the pro in Forex. While the rookie trades based on emotions and greed, the pro trades based on certain logic and rules . These logic and rules are all embodied in a successful Trade Management System. Advanced Trade Manager is a combination of different trade management systems desi

High Volume Turns
FREE
Nesimeye Oswald
Most of the time, market reversals / pull backs usually follow volume and price spikes thus these spikes could be the first indication of an exhaustion and possible reversal/pullback. High volume Turns is an indicator that scans the market for price and volume spikes around over-bought/over-sold market conditions. These spikes when spotted serves as the first indication of reversal/pullback.
Note : Though it seems ok now but this is a system that is still under development. We have made it p

Volatility Ratio
FREE
Nesimeye Oswald
The Volatility Ratio was developed by Jack D. Schwager to identify trading range and signal potential breakouts. The volatility ratio is defined as the current day's true range divided by the true range over a certain number of days N (i.e. N periods). The following formula is used to calculate the volatility ratio: Volatility Ratio (VR) = Today's True Range/True Range over N number of days To calculate the volatility ratio, the true range is calculated using the following formula: Today's True

Camarilla Pivots Historical
FREE
Nesimeye Oswald
Camarilla Pivots Historical plots the historical data of the camarilla pivot point levels on the chart. The Camarilla Pivot levels was originated in 1989 by Nick Scott. The levels are used as primary support and resistance levels by Intraday traders. The levels are calculated with the following formula: R4 = C + RANGE * 1.1/2 R3 = C + RANGE * 1.1/4 R2 = C + RANGE * 1.1/6 R1 = C + RANGE * 1.1/12 PP = (HIGH + LOW + CLOSE) / 3 S1 = C - RANGE * 1.1/12 S2 = C - RANGE * 1.1/6 S3 = C - RANGE * 1.1/4 S4

One to Three Trendline Breakout Free
FREE
Nesimeye Oswald
This indicator scans the 1-3 Trendline pattern . The indicator is a 100 % non repaint low risk breakout system . The patterns are formed around swing high and swing lows which make them a low risk pattern with high reward. This free version is designed for use on the EURUSD pair only . To get the full version for all pairs go to https://www.mql5.com/en/market/product/45231
PATTERN BACKGROUND The 1-3 Trendline Breakout pattern is formed by four(4) points which are composed of three (3) pr

Active Trends
FREE
Nesimeye Oswald
A<tive Trends is designed around a simple yet effective trading strategy . It aims to show traders sentiment in real time thus giving an idea of trend direction as it changes with each bullish / bearish transaction . The indicator displays a bullish and bearish arrow accordingly as the trend changes. Arrows might repaint of the current candle but the signal is always sustained and non repaint at the close of the current candle. Works with a time frames and pairs. INPUTs. 1. Trend Sensitivity : D

Advanced Currency Meter
30 USD Nesimeye Oswald
Good News ! Advanced Currency Meter is more awesome now ! If you have been a fan of the free version of Advanced Currency Meter then I will implore you not to be discourage because you will soon find that the new paid version is worth every dime. Unlike the free version the new paid version of Advanced Currency Meter now has a newly added panel called the “% Daily Range” . Why A Paid Version Now? We believe you like good things and many who has used Advanced Currency Meter over the years will te
Pivot X
79 USD Nesimeye Oswald
Pivot-X is a trend scalping indicator designed for lower time frames such as M1, M5 and M15 charts. The indicator uses a combination of Moving Averages( MA Cross) + Custom Indicator to enter positions and a combination of Moving Averages (MA Cross) + RSI to exit its positions. The Signal Bar is Indicated by a Circle while the Exit Bar is indicated by an "X", thus the name Pivot-X
How It Works Entry signals are given at the beginning of a candle while closing signals are given at the close of t

Multi TimeFrame Currency Meter
79 USD Nesimeye Oswald
This Currency Meter Calculates Strength Using a currency basket of 28 pairs? This Currency Meter uses a basket of 28 currency pair to define strength. This is very important because it gives an wholesome view of the strength of a currency by considering its reaction to all major currencies paired with it.
This Currency Meter is Multi-timeframe!!! Majority of the currency strength indicators around the market today only has a single time frame view. Even with the so called multi-timeframe ver

Account Alerts
25 USD Nesimeye Oswald
Account Alerts is an indispensable Forex tool to keep tab of all trading activities on your account. Even when you have an EA trading on your account, you still need to keep tab on trading activities on your account to ensure trades are executed according to strategy and plan. Account Alerts sends notifications on trade openings and closings, account balance status, margin level decline, trade loss, trade profit, attained daily profit target, daily maximum loss hit. Whenever any event occurs in

Pivots Dashboard
79 USD Nesimeye Oswald
Pivots Dashboard is the single most complete instruments set for Pivot Points trading currently available in the market. We have done a comprehensive research prior to the product design to make sure that this product meets every need of Pivot Point trading. Pivots Points are significant levels technical analysts can use to determine directional movement and potential support/resistance levels. Pivot Points are thus predictive or leading indicators. While the points were originally used by floor

Flag Pennant Scanner
129 USD Nesimeye Oswald
Flag Pennant Scanner is a Price Action (PA) analytical tool that scans the continuation patterns known as "Flag and Pennant Patterns" . This scanner is a multi - currency scanner with an easy-on pattern display dashboard. The scanner also comes with two major Flag Pattern trading strategies . Flag and Pennant patterns are continuation patterns characterized by a move in a previous trend direction after a shallow retracement usually below 50% of the original move . Deep retracements can however

Keltner Trader
79 USD Nesimeye Oswald
Keltner Trader is an indicator designed with the full capabilities to trade the Keltner Channel. This indicator combines price action with the Keltner channel by scanning Pin-Bar and Engulfing Bar patterns around channel lines. The indicator is also equipped with over four filters including Currency Strength Meter to ensure high probability trading. Keltner Channel is a volatility channel formulated with an Exponential Moving Average and an Average True Range indicator. The EMA line typically EM

Bollinger Channel Trader
79 USD Nesimeye Oswald
Bollinger Channel Trader is an indicator designed with the full capabilities to trade the Bollinger Band Channel. This indicator combines price action with the Bollinger channel by scanning Pin-Bar and Engulfing Bar patterns around channel lines. The indicator is also equipped with over 4 filters including Currency Strength Meter to ensure high probability trading. Developed by John Bollinger, Bollinger Band Channels (a.k.a BBands) is a volatility based channel formulated with a Moving Average a

Donchian Channel Trader
79 USD Nesimeye Oswald
Donchian Channel Trader is an indicator designed with the full capabilities to trade the Donchian Channel. This indicator combines price action with the Donchian channel by scanning Pin-Bar and Engulfing Bar patterns around channel lines. The indicator is also equipped with over 4 filters including Currency Strength Meter to ensure high probability trading. Developed by Richard Donchian, Donchian Channel is a price action based channel formulated by taking the highest and lowest price over the l

Volume Strength 28
79 USD Nesimeye Oswald
Version 1.6 ! Volume Strength 28 is better , easier to use and more awesome ! Based on complaint we got from the reviews, we understood many don't know how to really use the time frame setting on the input menu thus they have complaints of volatility, thus we have designed an Automatic Time Frame selection system that is suitable for novice traders.! The design of the indicator has been changed along with some calculation metrics. Based on complaints of high volatility we have been getting ,we h

TRend Ride
79 USD Nesimeye Oswald
This is a simple trend trading system that is designed to be sensitive in real time to trend changes in the FX market. It comes with a volume strength meter to identify the best pairs to trade. To use , first confirm the best trend using the Volume Strength Meter by trading the Strongest Pair against the Weakest Pair. Next enter Volume Strength Meter pairs on trend signals. No Repaint No Back paint Signal on current candle TRADING Step 1; Confirm Pair to trade with Volume Strength Meter ( Trade

MultiTimeFrame Currency Meter
79 USD Nesimeye Oswald
This Currency Meter Calculates Strength Using a currency basket of 28 pairs? This Currency Meter uses a basket of 28 currency pair to define strength. This is very important because it gives an wholesome view of the strength of a currency by considering its reaction to all major currencies paired with it.
This Currency Meter is Multi-timeframe!!! Majority of the currency strength indicators around the market today only has a single time frame view. Even with the so called multi-timeframe versi
Filter:


Benoit Ludovic Codogno
2020.04.04 01:12
#
semble bien fonctionner selon quelques test a voir dans le temps. cependant bon outil merci pour ce travail
Version 1.1
2020.05.21
We have added notification to the indicator . It now has Pop-Up Alert , Push Notification and Email Notification.
semble bien fonctionner selon quelques test a voir dans le temps. cependant bon outil merci pour ce travail