• Overview
  • Reviews (2)
  • Comments (12)

Ez Channel MT5

5

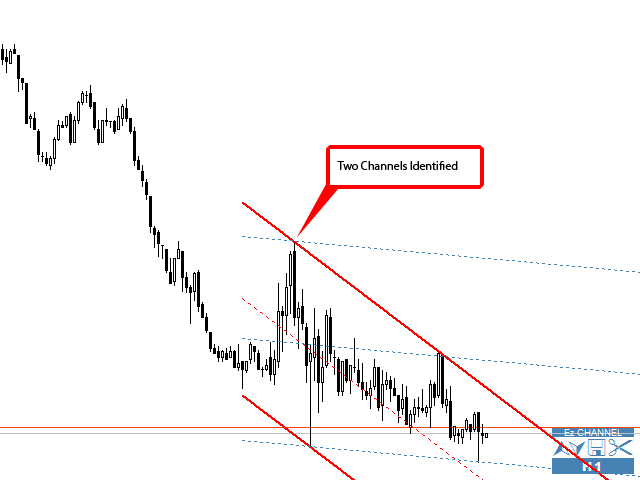
The Ez Channel indicator is an essential tool for trend following traders as it automatically identifies real trend channels in the chart. With this indicator, you no longer have to spend hours manually drawing trend lines on your charts. It saves you time and effort by quickly drawing trend channels for any symbol and time frame.

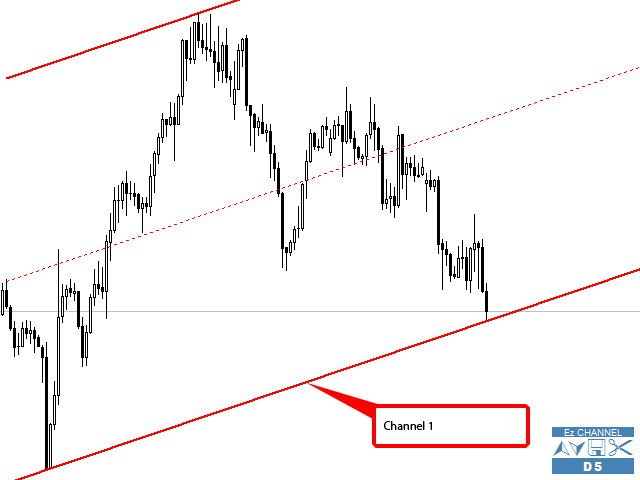
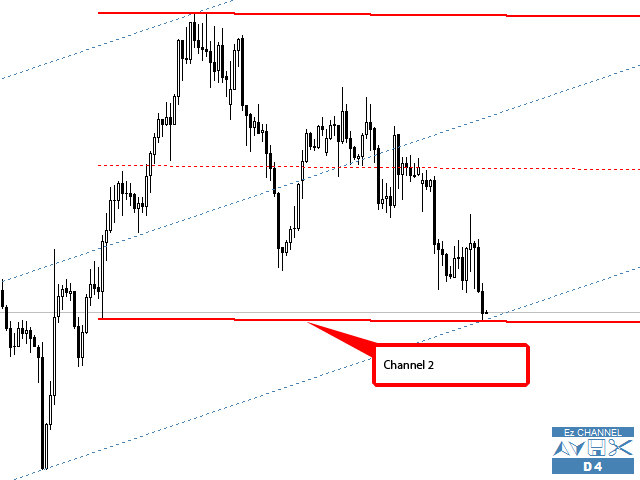
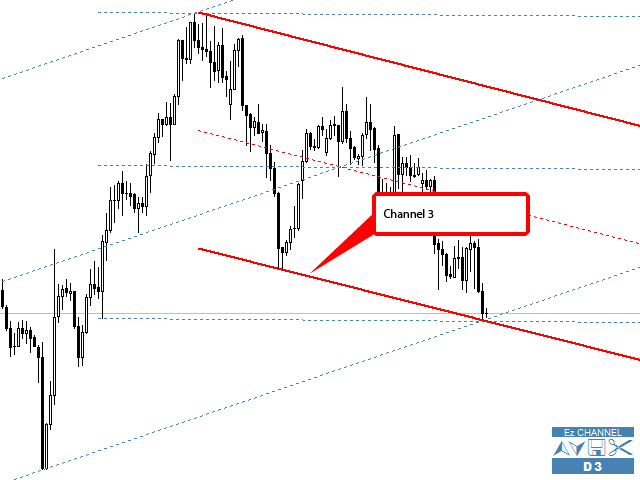
One of the key features of Ez Channel is its mini control panel, which allows you to easily adjust the time periods according to your preference. This control panel also enables you to save identified channels before changes occur with new market movements. This feature ensures that you can easily track and analyze market trends without the hassle of redrawing trend lines.

Ez Channel is suitable for all symbols and time frames, making it versatile and applicable to various trading strategies. It provides you with the convenience of saving identified channels for future use, and you can view these saved channels with any time frame. This functionality allows you to compare and analyze trends across different time frames, enhancing your trading decision-making process.

Whether you are a seasoned trader or a novice, Ez Channel offers a user friendly interface with easy to adjust parameters. It is designed to simplify the trend following strategy, allowing you to easily follow trends and make informed trading decisions. The indicator's accuracy and reliability in identifying trend channels contribute to its effectiveness as a trading tool.

With its powerful features and user friendly design, Ez Channel is a must have tool for any trader who wants to maximize their trend following strategy. Experience the convenience and accuracy of automatic trend channel identification by trying Ez Channel for yourself.
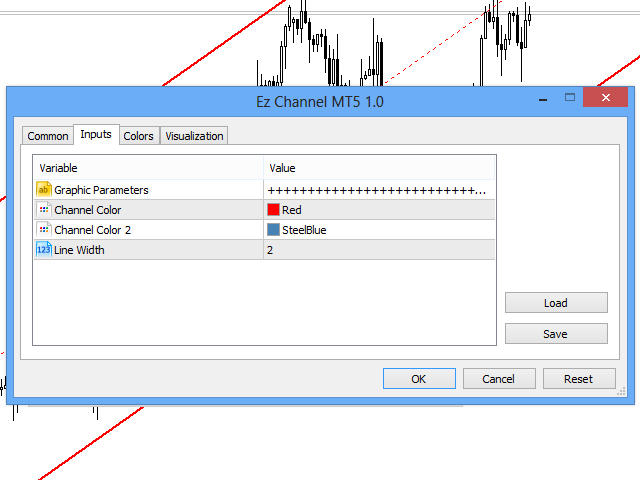
     

Parameters

  • Graphic Parameters
    • Channel Color - Color for Trend Channel
    • Channel Color 2 - Color for saved Channel
    • Line Width - Channel line width


Reviews 2
Ruhail Ashraf Khan
630
Ruhail Ashraf Khan 2020.06.01 13:25 
 

amazing sills

Recommended products
Noize Absorption Index - is the manual trading system that measures the difference of pressure between bears forces and bulls forces. Green line - is a noize free index that showing curent situation. Zero value of index shows totally choppy/flat market.Values above zero level shows how powerfull bullish wave is and values below zero measures bearish forces.Up arrow appears on bearish market when it's ready to reverse, dn arrow appears on weak bullish market, as a result of reverse expectation.
Fibonacci and RSI Demo version MQL5
Carlos Daniel Vazquez Rosas
4 (1)
Fibonacci and RSI. Demo versión only works with GBPUSD. For full version, please, visit visit https://www.mql5.com/en/market/product/52101 The indicator is a combination of the Fibonacci and RSI indicators. Every time the price touches one of the fibonacci levels and the rsi condition is met, an audible alert and a text alert are generated. Parameters number_of_candles : It is the number of candles that will be calculated. If you put 100, the indicator will give you the maximum and min
FREE
Your Trend Friend
Luigi Nunes Labigalini
The trend is your friend! Look at the color of the indicator and trade on that direction. It does not  repaint. After each candle is closed, that's the color of the trend. You can focus on shorter faster trends or major trends, just test what's most suitable for the symbol and timeframe you trade. Simply change the "Length" parameter and the indicator will automatically adapt. You can also change the color, thickness and style of the lines. Download and give it a try! There are big movements
Provided Trend is a complex signal formation indicator. As a result of the work of internal algorithms, you can see only three types of signals on your chart. The first is a buy signal, the second is a sell signal, and the third is a market exit signal. Options: CalcFlatSlow - The first parameter that controls the main function of splitting the price chart into waves. CalcFlatFast - The second parameter that controls the main function of splitting the price chart into waves. CalcFlatAvg - Par
The Antique Trend Indicator is a revolutionary trend trading and filtering solution with all the important features of a trend tool built into one tool! The Antique Trend indicator is good for any trader, suitable for any trader both for Forex and binary options. There is no need to configure anything, everything has been perfected by time and experience, it works great during flats and trends. The Antique Trend indicator is a tool for technical analysis of financial markets, reflecting curre
To download MT4 version please click here . This is the exact conversion from TradingView: "WaveTrend [LazyBear]" By "zeusuk3". One of the coolest indicators out there to detect overbought and oversold zones. It can be used as a part of more complicated strategy and for confirming a potential trade setup. There are buffers to use in EAs also. The indicator is loaded light and non-repaint. - You can message in private chat for further changes you need. Thanks for downloading 
The best time to trade Using this Indicator is when the time reach exactly hour,half,45 minutes,15 minutes and sometimes 5 minutes.. This indicators is helpful to those who trade boom and crash indecies.How to read this indicator first you'll see Blue allow and Red allow all these allows used to indicate or to detect the spike which will happen so the allow happens soon before the spike happen.This indicator works properly only in boom and crash trading thing which you have to consider when
KT Horizontal Lines MT5
KEENBASE SOFTWARE SOLUTIONS
In MetaTrader, plotting multiple   horizontal lines   and then tracking their respective price levels can be a hassle. This indicator automatically plots multiple horizontal lines at equal intervals for setting price alerts, plotting support and resistance levels, and other manual purposes. This indicator is suitable for Forex traders who are new and looking for chances to make quick profits from buying and selling. Horizontal lines can help traders find possible areas to start trading when the
Best SAR MT5
Ashkan Hazegh Nikrou
5 (1)
Description :  we are happy to introduce our new free indicator based on one of professional and popular indicators in forex market (Parabolic SAR) this indicator is new modification on original Parabolic SAR indicator, in pro SAR indicator you can see cross over between dots and price chart, this crossover is not signal but talk about end of movement potential, you can start buy by new blue dot, and place stop loss one atr before first blue dot, and finally you can exit as soon as dots cross
FREE
General Description In the simplest terms this is a contrarian intra-day scalping system. Built to try and let correct trades run as far as possible and flip the trade when indicated. The indicator looks at historical daily trading ranges to lay out levels at which it takes long and short positions based on the statistical levels. The indicator is built around index futures, mainly around S&P and the DOW but can be used an any futures contract mainly using AMP Futures to trade. The indicator is
Was: $249  Now: $99   Market Profile defines a number of day types that can help the trader to determine market behaviour. A key feature is the Value Area, representing the range of price action where 70% of trading took place. Understanding the Value Area can give traders valuable insight into market direction and establish the higher odds trade. It is an excellent addition to any system you may be using. Inspired by Jim Dalton’s book “Mind Over Markets”, this indicator is designed to suit the
The Riko Trend indicator is a revolutionary trend trading and filtering solution with all the important features of a trend tool built into one tool! The Riko Trend indicator is good for any trader, suitable for any trader for both forex and binary options. You don’t need to configure anything, everything is perfected by time and experience, it works great during a flat and in a trend. The Riko Trend indicator is a technical analysis tool for financial markets that reflects the current price
The indicator Supply Demand RSJ PRO calculates and plots the "Supply" and "Demand" zones on the graph, identifying the type of Zone (Weak, Strong, Verified, Proven) and in case of retests of the Zone it shows how many times it was retested. "Supply" Zones are the price zones where more supply than demand has occurred, driving prices down. "Demand" Zones are the price zones where more demand than supply has occurred, pushing prices up. Be sure to try our professional version with configurable f
Liquidity Oscillator
Paolo Scopazzo
5 (1)
A powerful oscillator that provide Buy and Sell signals by calculating the investor liquidity. The more liquidity the more buy possibilities. The less liquidity the more sell possibilities. Please download the demo and run a backtest! HOW IT WORKS: The oscillator will put buy and sell arrow on the chart in runtime only . Top value is 95 to 100 -> Investors are ready to buy and you should follow. Bottom value is 5 to 0 -> Investors are ready to sell and you should follow. Alert + sound will app
Premium level is a unique indicator with more than 80% accuracy of correct predictions! This indicator has been tested for more than two months by the best Trading Specialists! The author's indicator you will not find anywhere else! From the screenshots you can see for yourself the accuracy of this tool! 1 is great for trading binary options with an expiration time of 1 candle. 2 works on all currency pairs, stocks, commodities, cryptocurrencies Instructions: As soon as the red ar
One of the number sequences is called "Forest Fire Sequence". It has been recognized as one of the most beautiful new sequences. Its main feature is that this sequence avoids linear trends, even the shortest ones. It is this property that formed the basis of this indicator. When analyzing a financial time series, this indicator tries to reject all possible trend options. And only if he fails, then he recognizes the presence of a trend and gives the appropriate signal. This approach allows one t
Mine Farm
Maryna Kauzova
5 (1)
Mine Farm is one of the most classic and time-tested scalping strategies based on the breakdown of strong price levels. Mine Farm is the author's modification of the system for determining entry and exit points into the market... Mine Farm - is the combination of great potential with reliability and safety. Why Mine Farm?! - each order has a short dynamic Stop Loss - the advisor does not use any risky methods (averaging, martingale, grid, locking, etc.) - the advisor tries to get
Trend Side - a technical indicator for determining the trend. It is a set of several full-fledged trading strategies. The indicator uses an advanced trend filtering system, has a statistical panel, calculates entry and exit levels, and calculates the dynamic Trailing Stop level. Suitable for any type of symbols, never redraws its signals and results. A comprehensive tool for professional trend trading. The set of the Trend Side indicator also includes Andrews Trend Scanner - a multi-currency
ZigZag with Fibonacci
Rafael Caetano Pinto
This indicator uses the metaquotes ZigZag indicator as base to plot fibonacci extension and fibonacci retracement based in the Elliot waves. A fibonacci retracement will be plotted on every wave draw by the ZigZag. A fibonacci extension will be plotted only after the 2nd wave. Both fibonacci will be updated over the same wave tendency. Supporting until 9 consecutive elliot waves. Parameters: Depth: How much the algorithm will iterate to find the lowest and highest candles Deviation: Amoun
Value Chart Candlesticks
Flavio Javier Jarabeck
4.67 (9)
The idea of a Value Chart indicator was presented in the very good book I read back in 2020 , " Dynamic Trading Indicators: Winning with Value Charts and Price Action Profile ", from the authors Mark Helweg and David Stendahl. The idea is simple and the result is pure genius: Present candlestick Price analysis in a detrended way! HOW TO READ THIS INDICATOR Look for Overbought and Oversold levels. Of course, you will need to test the settings a lot to find the "correct" one for your approach.
FREE
This indicator will show you the TP and SL Values (in that currency) that you already set  for every orders on the charts  ( closed to the transaction/order line)  that will help you a lot to estimated your profit and loss for every order.    And it also show you the PIPs values too.  the shown format  is      " Currency Values of our Profit or Loss /  PIPs values ".    The TP Value will be shown in Green Color and  the SL Value  will be shown in Red Color.  For any question or more information,
Seconds Timeframes Chart MT5
Abdelkhabir Yassine Alaoui
Seconds Chart For MetaTrader 5 The Indicators allows you to create charts in the MetaTrader 5 terminal with a timeframe in seconds. The timeframe on such a chart is set in seconds, not in minutes or hours. Thus, you can create charts with a timeframe less than M1. For example, S15 is a timeframe with a period of 15 seconds. You can apply indicators, Expert Advisors and scripts to the resulting chart. You get a fully functional chart on which you can work just as well as on a regular chart. The t
Stormer RSI 2
Ricardo Rodrigues Lucca
This strategy was learned from Stormer to be used on B3. Basically, 15 minutes before closing the market, it will check RSI and decided if it will open an position. This strategy do not define a stop loss. If the take profit reach the entry price it will close at market the position. The same happens if the maximal number of days is reached. It is created to brazilian people, so all configuration are in portuguese. Sorry Activations allowed have been set to 50.
The new update makes this indicator a complete tool for studying, analyzing and operating probabilistic patterns. It includes: On-chart Multi-asset percentage monitor. Configurable martingales. Twenty-one pre-configured patterns, including Mhi patterns and C3. An advanced pattern editor to store up to 5 custom patterns. Backtest mode to test results with loss reports. Trend filter. Hit operational filter. Martingale Cycles option. Various types of strategies and alerts. Confluence between patter
Pivot Point Fibo RSJ is an indicator that traces the support and resistance lines of the day using Fibonacci rates. This spectacular indicator creates up to 7 levels of support and resistance through Pivot Point using Fibonacci rates. It is fantastic how the prices respect each level of this support and resistance, where it is possible to perceive possible entry/exit points of an operation. Features Up to 7 levels of support and 7 levels of resistance Set the colors of the levels individual
FREE
MTF Lines PRO
Renato Fiche Junior
5 (1)
This indicator was developed to support multiple timeframe analysis. In the indicator settings, the user can set the color, width, and style of the horizontal lines for each timeframe. This way, when the horizontal lines are inserted into the chart, they will be plotted with the timeframe settings. MTF Lines also allows visibility control of another objets like rectangles, trend lines and texts. This is a product developed by Renato Fiche Junior and available to all MetaTrader 4 and 5 users!
How to use Pair Trading Station Pair Trading Station is recommended for H1 time frame and you can use it for any currency pairs. To generate buy and sell signal, follow few steps below to apply Pair Trading Station to your MetaTrader terminal. When you load Pair Trading Station on your chart, Pair Trading station will assess available historical data in your MetaTrader platforms for each currency pair. On your chart, the amount of historical data available will be displayed for each currency pai
Awesome Oscillator by Bill Williams with the ability to fine-tune and replace the averaging algorithms of the indicator, which significantly expands the possibilities of using this oscillator in algorithmic trading and brings it closer in its properties to such an indicator as the MACD. To reduce price noise, the final indicator is processed with an additional Smooth averaging. The indicator has the ability to give alerts, send mail messages and push signals when the direction of movement of th
Tops and Bottoms Indicator
Josue De Matos Silva
4.8 (5)
Tops & Bottoms Indicator FREE   Tops abd Bottoms:   An effective indicator for your trades The tops and bottoms indicator helps you to find  ascending and descending channel formations with indications of ascending and/or descending tops and bottoms. In addition, it  show possibles  opportunities with a small yellow circle when the indicator encounters an impulse formation. This indicator provide to you  more security and speed in making entry decisions. Also test our FREE advisor indicator:
FREE
Market Profile MetaTrader System  — is a classic Market Profile implementation that can show the price density over time, outlining the most important price levels, value area, and control value of a given trading session. This indicator can be attached to timeframes between M1 and D1 and will show the Market Profile for daily, weekly, monthly, or even intraday sessions. Lower timeframes offer higher precision. Higher timeframes are recommended for better visibility. It is also possible to use a
Buyers of this product also purchase
Atomic Analyst MT5
Issam Kassas
5 (13)
First of all Its worth emphasizing here that this Trading Indicator is   Non-Repainting ,   Non-Redrawing   and   Non-Lagging   Indicator, Which makes it ideal from both manual and robot trading.  User manual: settings, inputs and strategy . The Atomic Analyst  is a PA Price Action Indicator that uses Strength and Momentum of the price to find a better edge in the market. Equipped with advanced filters which help remove noises and false signals, and Increase Trading Potential. Using Multiple la
First of all Its worth emphasizing here that this Trading System is Non-Repainting , Non-Redrawing and Non-Lagging Indicator , Which makes it ideal from both manual and robot trading .  Online course, manual and download presets. The Smart Trend Trading System MT5 is a comprehensive trading solution tailored for new and experienced traders . It combines over 10 premium indicators and features more than 7 robust trading strategies , making it a versatile choice for diverse market conditions . Tre
Quantum Trend Sniper
Bogdan Ion Puscasu
5 (39)
Introducing   Quantum Trend Sniper Indicator , the groundbreaking MQL5 Indicator that's transforming the way you identify and trade trend reversals! Developed by a team of experienced traders with trading experience of over 13 years,   Quantum Trend Sniper Indicator   is designed to propel your trading journey to new heights with its innovative way of identifying trend reversals with extremely high accuracy. ***Buy Quantum Trend Sniper Indicator and you could get Quantum Breakout Indicator fo
A key element in trading is zones or levels from which decisions to buy or sell a trading instrument are made. Despite attempts by major players to conceal their presence in the market, they inevitably leave traces. Our task was to learn how to identify these traces and interpret them correctly. Reversal First Impulse levels (RFI)   -  Version MT4                  INSTRUCTIONS                 RUS                 ENG                         R ecommended to use with an indicator   -  TREND PRO  
FX Volume MT5
Daniel Stein
4.94 (17)
Visit our all-new   Stein Investments Welcome Page   to get the latest information, updates and trading strategies. FX Volume is the FIRST and ONLY volume indicator that provides a REAL insight into the market sentiment from a broker's point of view. It provides awesome insights into how institutional market participants, like brokers, are positioned in the Forex market, much faster than COT reports. Seeing this information directly on your chart is the real game-changer and breakthrough solut
Trend Screener Pro MT5
STE S.S.COMPANY
4.87 (62)
Unlock the Power of  Trends trading with Trend Screener Indicator: Your Ultimate Trend Trading Solution powered by fuzzy logic and Multi-currencies System ! Elevate your trend trading with Trend Screener, the revolutionary trend indicator powered by   fuzzy logic.  It is a powerful trend-following indicator that combines over  13 premium tools and features and 3 trading strategies  , making it a versatile choice to   make your Metatrader a Trend Analyzer. LIMITED TIME OFFER : Trend Screener Indi
Dragon Multi Indicator MT5
Mansour Babasafary
5 (1)
74% discount for the next 10 buyers (original price $605): 1 left Get a 50% bonus by buying (or even renting) any of our products. After buying (or renting), send a message for more information. 3 Indicators in 1 indicator Strategy based on price action Made specifically for the best forex currency pairs Can be used in the best time frame of the market at a very reasonable price This indicator is basically 3 different indicatos . But we have combined these 3 indicators in 1 indicator so th
TPSproTREND PrO MT5
Roman Podpora
5 (7)
TPSpro TRENDPRO  - is a trend indicator that automatically analyzes the market and provides information about the trend and each of its changes, as well as giving signals for entering trades without redrawing! The indicator uses each candle, analyzing them separately. referring to different impulses - up or down impulse. Exact entry points into transactions for currencies, crypto, metals, stocks, indices!  -  Version MT4                  DETAILED DESCRIPTION        /       TRADING SETUPS       
Introducing   Quantum Breakout PRO , the groundbreaking MQL5 Indicator that's transforming the way you trade Breakout Zones! Developed by a team of experienced traders with trading experience of over 13 years,   Quantum Breakout PRO   is designed to propel your trading journey to new heights with its innovative and dynamic breakout zone strategy. Quantum Breakout Indicator will give you signal arrows on breakout zones with 5 profit target zones and stop loss suggestion based on the breako
First of all Its worth emphasizing here that this Trading Tool is Non Repainting , Non Redrawing and Non Lagging Indicator , Which makes it ideal for professional trading . Online course, user manual and demo. The Smart Price Action Concepts Indicator is a very powerful tool for both new and experienced traders . It packs more than 20 useful indicators into one , combining advanced trading ideas like Inner Circle Trader Analysis and Smart Money Concepts Trading Strategies . This indicator focus
Introducing the South African Sniper indicator created by a small group of traders with a few years trading trading the financial market profitably . This is a plug and play indicator that provides you with  BUY and SELL (SNIPER ENTRY) signals with TARGET and trail stops. The indicator Works with all MT5 trading instruments. The indicator uses previous  chart data as receipt to speculate on future market moves.
FX Power MT5 NG
Daniel Stein
5 (5)
Trading GOLD, and currencies, with the dog walk strategy  - super smart Trading GOLD, and currencies, with the breakout strategy  - super easy Visit our all-new   Stein Investments Welcome Page   to get the latest information, updates and trading strategies. FX Power MT5 NG  is the next generation of our long-time very popular currency strength meter, FX Power.  And what does this next-generation strength meter offer? Everything you have loved about the original FX Power  PLUS GOLD/XAU st
Top indicator for MT5   providing accurate signals to enter a trade without repainting! It can be applied to any financial assets:   forex, cryptocurrencies, metals, stocks, indices .  Watch  the video  (6:22) with an example of processing only one signal that paid off the indicator! MT4 version is here It will provide pretty accurate trading signals and tell you when it's best to open a trade and close it. Most traders improve their trading results during the first trading week with the help of
Gartley Hunter Multi
Siarhei Vashchylka
5 (7)
Gartley Hunter Multi - An indicator for searching for harmonic patterns simultaneously on dozens of trading instruments and on all classic timeframes: (m1, m5, m15, m30, H1, H4, D1, Wk, Mn). Manual (Be sure to read before purchasing) | Version for MT4 Advantages 1. Patterns: Gartley, Butterfly, Shark, Crab. Bat, Alternate Bat, Deep Crab, Cypher 2. Simultaneous search for patterns on dozens of trading instruments and on all classic timeframes 3. Search for patterns of all possible sizes. Fr
Professional Scalping Tool on Deriv Attention! The indicator will be sold in limited quantities!!! The previous 5 copies were sold for $250 The remaining 4 copies will be sold for $350 The next price is $500 Description: This trading indicator is designed for professional traders focused on scalping. Designed with the market in mind, it provides highly accurate spike trading signals. It works on the M1 timeframe and supports the following symbols: Boom 300 Index, Boom 500 Index, Boom 1000 I
ICT, SMC, SMART MONEY CONCEPTS, SMART MONEY, Smart Money Concept, Support and Resistance, Trend Analysis, Price Action, Market Structure, Order Blocks, BOS/CHoCH,   Breaker Blocks ,  Momentum Shift,   Supply&Demand Zone/Order Blocks , Strong Imbalance,   HH/LL/HL/LH,    Fair Value Gap, FVG, Inversion FVG, IFVG,  Premium  &   Discount   Zones, Fibonacci Retracement, OTE, Buy Side Liquidity, Sell Side Liquidity, BSL/SSL Taken, Equal Highs & Lows, MTF Dashboard, Multiple Time Frame, BigBar, HTF OB
AW Trend Predictor MT5
AW Trading Software Limited
4.77 (56)
The combination of trend and breakdown levels in one system. An advanced indicator algorithm filters market noise, determines the trend, entry points, as well as possible exit levels. Indicator signals are recorded in a statistical module, which allows you to select the most suitable tools, showing the effectiveness of the signal history. The indicator calculates Take Profit and Stop Loss marks. Manual and instruction ->  HERE  / MT4 version ->  HERE How to trade with the indicator:  Trading wit
Blahtech Supply Demand MT5
Blahtech Limited
4.57 (14)
Was: $299  Now: $99   Supply Demand uses previous price action to identify potential imbalances between buyers and sellers. The key is to identify the better odds zones, not just the untouched ones. Blahtech Supply Demand indicator delivers functionality previously unavailable on any trading platform. This 4-in-1 indicator not only highlights the higher probability zones using a multi-criteria strength engine, but also combines it with multi-timeframe trend analysis, previously confirmed swings
Profit from market structure changes as price reverses and pulls back. The market structure reversal alert indicator identifies when a trend or price move is approaching exhaustion and ready to reverse. It alerts you to changes in market structure which typically occur when a reversal or major pullback are about to happen. The indicator identifies breakouts and price momentum initially, every time a new high or low is formed near a possible exhaustion point. The indicator draws in a rectangle on
TrendDecoder Premium MT5
Christophe, Pa Trouillas
5 (2)
Identify ranges  | Get earliest signals of Trends  | Get clear exits before reversal  | Spot the Fibo levels the price will test   |  Non-repainting, non-delayed indicator - ideal for manual and automated trading - for all assets and all time units $69   for launch - then back to >>   $149 After purchase,   please contact me on this channel   for recommended and personalised settings MT4   version:  Click here Get our full method with  BladeSCALPER  and   PowerZONES What is it about? TrendDE
RelicusRoad Pro MT5
Relicus LLC
4.82 (22)
How many times have you bought a trading indicator with great back-tests, live account performance proof with fantastic numbers and stats all over the place but after using it, you end up blowing your account? You shouldn't trust a signal by itself, you need to know why it appeared in the first place, and that's what RelicusRoad Pro does best! NOW $147 (increasing to $499 after a few updates) - UNLIMITED ACCOUNTS (PCs or MACs) **  User Manual + Strategies + Training Videos + Private Group with
XQ Indicator MetaTrader 5
Marzena Maria Szmit
5 (1)
Step into the realm of Forex trading with confidence and precision using XQ, a cutting-edge Forex indicator designed to elevate your trading game to unprecedented heights. Whether you're a seasoned trader or just stepping into the world of currency exchange, XQ Forex Indicator empowers you with the insights and signals needed to make informed trading decisions. The signal conditions are a combination of three indicators, and XQ Forex Indicator only display  medium and long-term trends . The ind
Quantum Heiken Ashi PRO MT5
Bogdan Ion Puscasu
4.5 (8)
Introducing the Quantum Heiken Ashi PRO charts with integrated alerts Designed to provide clear insights into market trends, the Heiken Ashi candles are renowned for their ability to filter out noise and eliminate false signals. Say goodbye to confusing price fluctuations and hello to a smoother, more reliable chart representation. What makes the Quantum Heiken Ashi PRO truly unique is its innovative formula, which transforms traditional candlestick data into easy-to-read colored bars. Red and g
IX Power MT5
Daniel Stein
5 (3)
IX Power   finally brings the unbeatable precision of FX Power to non-Forex symbols. It accurately determines the intensity of short, medium and long-term trends in your favourite indices, stocks, commodities, ETFs, and even cryptocurrencies. You can   analyse everything   your terminal has to offer. Try it out and experience how   your timing improves significantly   when trading. Read about our latest strategic development -  Easy scalping with IX Power Visit our all-new   Stein Investments
Matrix Arrow Indicator MT5
Juvenille Emperor Limited
5 (14)
Matrix Arrow Indicator MT5  is a unique 10 in 1 trend following   100% non-repainting  multi-timeframe indicator that can be used on all symbols/instruments:   forex,   commodities,   cryptocurrencies,   indices,   stocks .  Matrix Arrow Indicator MT5  will determine the current trend at its early stages, gathering information and data from up to 10 standard indicators, which are: Average Directional Movement Index (ADX) Commodity Channel Index (CCI) Classic Heiken Ashi candles Moving Aver
Advanced Supply Demand MT5
Bernhard Schweigert
4.53 (15)
Best Solution for any Newbie or Expert Trader! This indicator is a unique, high quality and affordable trading tool because we have incorporated a number of proprietary features and a new formula. With this update, you will be able to show double timeframe zones. You will not only be able to show a higher TF but to show both, the chart TF, PLUS the higher TF: SHOWING NESTED ZONES. All Supply Demand traders will love it. :) Important Information Revealed Maximize the potential of Advanced Suppl
Auto Order Block with break of structure based on ICT and Smart Money Concepts Futures Break of Structure ( BoS )             Order block ( OB )            Higher time frame Order block / Point of Interest ( POI )    shown on current chart           Fair value Gap ( FVG ) / Imbalance   ,  MTF      ( Multi Time Frame )    Volume Imbalance     ,  MTF          vIMB Gap’s Equal High / Low’s     ,  MTF             EQH / EQL Liquidity               Current Day High / Low           HOD /
TrendLine PRO MT5
Evgenii Aksenov
4.78 (50)
The Trend Line PRO indicator is an independent trading strategy. It shows the trend change, the entry point to the transaction, as well as automatically calculates three levels of Take Profit and Stop Loss protection Trend Line PRO is perfect for all Meta Trader symbols: currencies, metals, cryptocurrencies, stocks and indices Advantages of Trend Line PRO Never redraws its signals The possibility of using it as an independent strategy It has three automatic levels Take Profit and Stop Loss lev
Volume by Price MT5
Brian Collard
5 (3)
The Volume by Price Indicator for MetaTrader 5 features Volume Profile and Market Profile TPO (Time Price Opportunity). Get valuable insights out of currencies, equities and commodities data. Gain an edge trading financial markets. Volume and TPO histogram bar and line charts. Volume Footprint charts. TPO letter and block marker charts including split structures. Versatile segmentation and compositing methods. Static, dynamic and flexible ranges with relative and/or absolute visualizations. Lay
Trend Forecaster
Alexey Minkov
5 (3)
The Trend Forecaster indicator utilizes a unique proprietary algorithm to determine entry points for a breakout trading strategy. The indicator identifies price clusters, analyzes price movement near levels, and provides a signal when the price breaks through a level. The Trend Forecaster indicator is suitable for all financial assets, including currencies (Forex), metals, stocks, indices, and cryptocurrencies. You can also adjust the indicator to work on any time frames, although it is recommen
More from author
BullsBears Action
Thushara Dissanayake
3.91 (22)
The BullsBears Action Expert Advisor is a powerful tool designed to utilize Bulls and Bears volume data for trading decisions. By analyzing the percentage of Bulls and Bears in the market based on candle volume, this EA automatically opens Buy or Sell orders according to user-defined parameters. It provides a user friendly trading solution that incorporates risk management, automatic stop loss adjustment, and customizable settings. One of the key features of this expert advisor is its risk manag
FREE
Candle Power Pro
Thushara Dissanayake
4.33 (6)
Unlock the power of real volume information with the Candle Power Pro indicator. This dynamic tool captures the actual volume data for each candle and presents it as a percentage of the total volume. By doing so, it empowers you to discern the ongoing struggle between buyers and sellers in the market. The Candle Power Pro displays the battle between buyers and sellers as a percentage of the total volume, giving you valuable insights into market dynamics. You can easily confirm breakouts by anal
Volume Percentage Line Graph
Thushara Dissanayake
4.75 (4)
The Volume Percentage Line Graph is an indicator designed to provide volume data insights. It retrieves total volume information for each candle and presents it as a percentage of the overall volume. The indicator displays this data as graph lines in a separate window, allowing users to easily visualize the battle between buyers and sellers. One of the key features of this indicator is its ability to show the volume percentage as graph lines. By representing the volume distribution between selle
FREE
Extract Candle Power
Thushara Dissanayake
5 (2)
Extract Candle Power is a real time volume extractor indicator that provides valuable insights into the behavior of sellers and buyers during each candle. By analyzing the volume data, traders can make more informed decisions about market trends and potential reversals, surpassing the capabilities of traditional Moving Average indicators. This powerful tool allows you to extract and analyze the sellers and buyers volume of the current candle, as well as compare it with the volume of previous can
Ms Fibonacci
Thushara Dissanayake
3.75 (8)
Introducing Ms. Fibonacci , a powerful and free indicator designed to simplify the process of drawing and adjusting Fibonacci levels on your chart. This indicator automatically identifies and marks the new highest and lowest Fibonacci levels, ensuring accurate and precise placement. One of the key features of Ms. Fibonacci is its ability to draw Fibonacci levels correctly, point to point, and mark the corresponding price levels. This feature saves you time and effort, allowing you to focus on an
FREE
The   RSI Crossover Alert   is a powerful notification system designed specifically for traders who utilize the   Relative Strength Index (RSI)   in their trading strategies. This indicator focuses on identifying RSI crossovers, which occur when the fast RSI line crosses above or below the slow RSI line. By combining these crossovers, the indicator effectively filters out false signals, allowing traders to make more accurate trading decisions. The RSI Crossover Alert offers several key features
Fibo Scalper Pro
Thushara Dissanayake
2.33 (3)
The Fibo Scalper Pro Expert Advisor is a powerful tool designed to automate popular Fibonacci Trading Strategies . It simplifies the trading process by automatically drawing and adjusting Fibonacci levels on the chart. This feature provides convenience and accuracy for traders who utilize Fibonacci retracements and extensions in their analysis. One of the key features of the Fibo Scalper Pro is its customization facility. It allows professional traders to enable or disable each Fibonacci leve
Breakout Robot
Thushara Dissanayake
4.5 (4)
Introducing the Breakout Robot Expert Advisor , a revolutionary tool designed to automate the highly sought-after EURJPY Breakout Strategy with unparalleled ease. This powerful EA features a simple yet effective system that effortlessly draws a box using high and low values between 22:00 - 02:00 GMT. It then automatically executes BUY/SELL orders when price breaks above/below the box, all optimized for the M15 time frame. With complete customization capabilities, you have the flexibility to tail
Mr Fibonacci
Thushara Dissanayake
5 (2)
Introducing Mr. Fibonacci , an amazing indicator designed to simplify the process of drawing and adjusting Fibonacci levels on your chart. This indicator offers exceptional customization options for professional traders, allowing them to draw any Fibonacci level with precision. Additionally, it provides mobile notifications, email alerts, and pop-up alerts when price enters Fibonacci levels, ensuring you never miss potential trading opportunities. Using this indicator, you no longer have to cons
Candle GAP
Thushara Dissanayake
4.33 (3)
The Candle GAP indicator is an essential tool for traders utilizing Gap Trading Strategies as it automatically identifies candle gaps for each day of the week. A gap refers to a price level difference between the close and open of two consecutive days. This indicator recognizes four types of gap patterns: Common, Breakaway, Continuation, and Exhaustion. By incorporating this indicator into any chart, traders can validate their signals and enhance their trading decisions. One of the key features
FREE
Three MA Alert
Thushara Dissanayake
The Three MA Alert indicator is an essential tool for traders who rely on the Moving Averages Crossover Strategy . It simplifies your trading life by sending notifications to your mobile device, email, and displaying pop-up alerts with sound whenever there is a crossover of three moving averages. By following this widely used technique, you can ensure that you are always on the right side of the trend and avoid trading against the prevailing market direction. With the Three MA Alert indicator, y
Two MA Crossover
Thushara Dissanayake
5 (3)
The Two MA Crossover is a powerful notification system designed specifically for traders who rely on the Moving Average Crossover Strategy . This fully automated indicator serves as a comprehensive alert system, ensuring that you never miss a crucial trading event. It sends notifications to your mobile device, email, and displays pop-up alerts with sound on your computer, all when it detects a moving average crossover based on your preferred parameters. One of its notable features is its compati
Pivot Bro
Thushara Dissanayake
5 (1)
The Pivot Bro technical indicator is a powerful tool designed to identify retracement areas using Pivot, Fibonacci, ATR, and ADR levels. It goes beyond that by also recognizing price action based reversal candlestick patterns . Additionally, the Currency Meter is a valuable companion for assessing the true strength of major currencies. By analyzing 28 currency pairs and displaying their strength on the chart with color changes, it enables traders to make informed decisions on entry and exit poin
ReversalPatterns
Thushara Dissanayake
This technical indicator automatically identifies and analyzes price action using a variety of Reversal Candlestick Patterns on the chart. It conveniently draws arrow signs along with the corresponding pattern names, making it easy to spot the latest reversal candlestick patterns. With this indicator, you can quickly identify and compare chart analysis with previously identified candle patterns. The indicator includes a range of implemented candlestick patterns, both simple and complex, such as
Reversal Alert Pro
Thushara Dissanayake
2.5 (2)
The Reversal Alert Pro indicator is a powerful tool designed to automatically detect reversal areas in the market. It offers convenient notifications sent directly to your mobile device and displays pop-up alerts with sound. By incorporating this indicator into your trading strategy, you can effectively filter trade positions. Furthermore, the indicator provides the option to utilize CCI, RSI, and Stochastic indicators to further refine the generated signals, enhancing its versatility and applic
Currency Strength 7
Thushara Dissanayake
The Currency Strength 7 technical indicator is a powerful tool designed to help traders gauge the strength of the seven most popular currencies. By analyzing the strength of AUD, USD, EUR, GBP, JPY, CHF, and CAD, this indicator provides valuable insights into currency dynamics. It represents currency strength on the chart using lines, allowing traders to quickly assess the relative strength of different currencies. One of the standout features of this indicator is its ability to draw an extended
Crossover Action
Thushara Dissanayake
The Crossover Action Expert Advisor is an advanced tool designed to automate one of the most popular trading strategies, the M oving Average Crossover Strategy . With its intuitive interface and powerful features, this expert advisor takes the complexity out of manual trading and executes trades automatically based on moving average crossovers. One of the key features of this expert advisor is its proper risk management system, ensuring that trades are executed with appropriate lot sizes and max
CCI Action
Thushara Dissanayake
The CCI Action Expert Advisor is a powerful tool designed to automate the CCI (Commodity Channel Index) Strategy , allowing traders to capitalize on CCI level touches. With its user friendly settings and robust risk management system, this EA provides a reliable and efficient solution for traders looking to incorporate the CCI indicator into their trading approach. One of the key features of this Expert Advisor is its proper risk management system, which helps traders maintain control over their
News Robo
Thushara Dissanayake
2 (1)
The News Robo Expert Advisor is a powerful tool designed to assist news traders in opening pending orders with hidden stop loss during news releases. It offers several features that enhance your trading experience and protect your trades. One of the key features of News Robo is the hidden stop loss, which is ideal for news traders who prefer to conceal their stop loss from market maker brokers. The stop loss is automatically revealed once a profitable position is achieved, allowing you to secure
RSI Action
Thushara Dissanayake
3.67 (3)
The RSI Action Expert Advisor is a powerful tool that automates popular RSI (Relative Strength Index) strategies, allowing for efficient and accurate trading. By utilizing overbought and oversold levels, this EA identifies optimal entry points for buy and sell orders. It also offers various signal filtering options to enhance trading precision, including RSI reversal points, pending orders, major trend identification, and Moving Average Crossover signals. Additionally, it incorporates a modern
TPSL Driver
Thushara Dissanayake
Introducing the TPSL Driver Utility , a powerful tool designed to enhance your trading experience by automating Stop Loss and Take Profit management. This utility caters to every trader who desires seamless order management and advanced profit protection techniques. With the TPSL Driver Utility, you have the flexibility to choose between two modes of order management: Hidden and Visual. The Hidden mode allows you to hide the Take Profit and Stop Loss levels, providing a discreet approach to mana
Entry Point
Thushara Dissanayake
Introducing the Entry Point , a powerful technical indicator designed to provide Buy/Sell notifications. This indicator analyzes 5 moving averages, CCI, RSI, Stochastic, Bill Williams, and volume indicators across 3 different time frames to generate accurate signals. It offers unlimited customization options for professional traders, allowing them to tailor the indicator based on their experience and strategies. The Entry Point sends signals to users via mobile devices, email, and pop-up alerts
Entry Point Dashboard Ultimate
Thushara Dissanayake
4 (5)
Introducing the Entry Point Dashboard Ultimate , a powerful technical indicator designed to provide Buy/Sell notifications for 6 currency pairs. This indicator analyzes 5 moving averages, CCI, RSI, Stochastic, Bill Williams, and volume indicators across 3 different time frames to generate accurate signals. It offers unlimited customization options for professional traders, allowing them to tailor the indicator based on their experience and strategies. The Entry Point Dashboard Ultimate sends sig
Introducing the Fibo Channels Ultimate technical indicator, a powerful tool designed to revolutionize your Fibonacci trading strategy. With its advanced functionality, this indicator automatically draws all past Fibonacci channels on your chart, saving you time and effort. What sets the Fibo Channels Ultimate apart is its exceptional customization capabilities, allowing professional traders to draw any Fibonacci level they desire. This level of flexibility ensures that you can tailor the indicat
The Crossover Tactics Ultimate Expert Advisor is a powerful tool designed to automate popular Moving Average Crossover Strategies . It excels at identifying optimal entry points based on the intersection of three moving averages, while employing advanced filtering techniques to enhance the reliability of signals. However, what sets this EA apart is its comprehensive trade management system, known as the TPSL Driver Utility algorithm. One of the standout features of this expert advisor is its abi
Introducing the DFP Reconnoiter Ultimate , a technical indicator specifically designed for Daily Fibonacci Pivot Strategy traders. This indicator incorporates standard Fibonacci retracements, daily Pivot levels, Candlestick patterns, ATR and ADR levels to identify reversal and exit areas, resulting in well-timed entries. Key Fibonacci retracement levels of 38.2%, 50.0%, or 61.8% are preferred in conjunction with the daily central pivot. The strategy involves monitoring the Average True Range (AT
Currency Heat Wave Ultimate
Thushara Dissanayake
5 (1)
The Currency Heat Wave Ultimate technical indicator is a valuable tool that provides traders with real time insights into the strength of major currencies. With its analysis of 28 currency pairs, it offers a comprehensive overview of currency strength directly on the chart, making it incredibly convenient to use. By dynamically changing colors, it enables traders to quickly identify the positions of currencies and make informed decisions. One of the notable features of Currency Heat Wave is its
Exit Area Ultimate
Thushara Dissanayake
3 (1)
The Exit Area Ultimate is a technical indicator designed to enhance trading decisions by indicating the daily Average True Range (ATR) and Average Daily Rate (ADR) levels on the chart. By understanding these levels, traders can easily assess the average movement of an asset throughout the day. This versatile indicator serves multiple purposes for day traders, aiding in order placement, identifying intraday tendencies, setting trailing stop loss levels, and establishing daily take profit levels.
Level Scanner
Thushara Dissanayake
The Level Scanner indicator is a powerful tool designed to automate the identification of Higher and Lower areas on the chart, along with all Support and Resistance levels . It incorporates the use of the Hull Moving Average to provide a clearer and smoother representation of the real trend. This indicator operates with remarkable speed, enabling traders to quickly identify key areas of interest and make more informed trading decisions. One of the standout features of the Level Scanner is its ve
The Infinity Oscillators Ultimate is an all inclusive OSCI-KIT designed to enhance the trading experience for traders utilizing RSI, Stochastic, MACD, CCI, and Volume strategies. With its comprehensive range of features, this indicator offers a powerful toolset to analyze market trends, identify reversals and retracements, calculate intraday targets using ATR, and stay informed about crucial trading events. One of the standout features of this indicator is its ability to consolidate the most po
Filter:
Mario Oliver Schwarz
289
Mario Oliver Schwarz 2021.06.10 08:50 
 

Failed to access history data [D1]. Indicator doesn't work properly. Error Code = 4401 I have this error Message. Bought some days ago, the vendor not answer my chat. I have reduced only to hourly, but same error. The channel not plot correct.

Ruhail Ashraf Khan
630
Ruhail Ashraf Khan 2020.06.01 13:25 
 

amazing sills

Reply to review