• Overview
  • Reviews
  • Comments

Adaptive SSA

SSA stands for 'Singular Spectrum Analysis'. It combines elements of classical time series decomposition, statistics, multivariate geometry, dynamical systems and signal processing.
SSA decomposes time series into a sum of components (ETs), with each component representing a lower smoothing, using several SVD (Singular Value Decompositions).

It is a powerful filtering process used in many fields of research (climatology, biomedical, aerospace, etc), where high quality forecasting and smoothing of data is important.

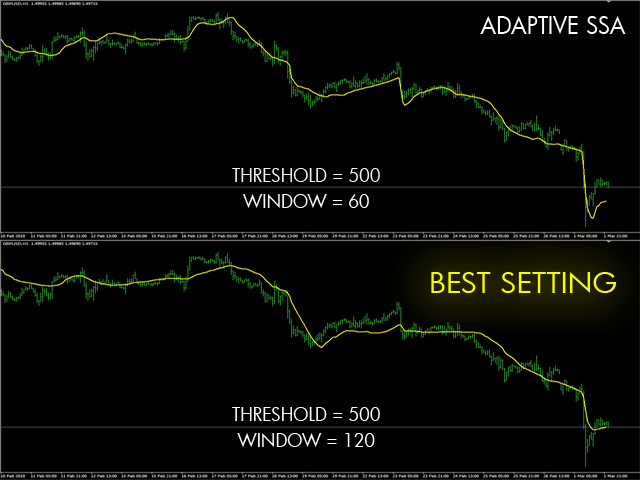
The SSA is adaptive in nature, but this Adaptive Version takes it to the next level, by adding a better fit to the data, while keeping smoothness to its maximum.


YOU NEED A HIGH-END CPU TO USE THIS INDICATOR, SPECIALLY IN ADAPTIVE AND REALTIME MODE. THIS IS AN OPTIMIZED VERSION.


HOW TO USE IT:
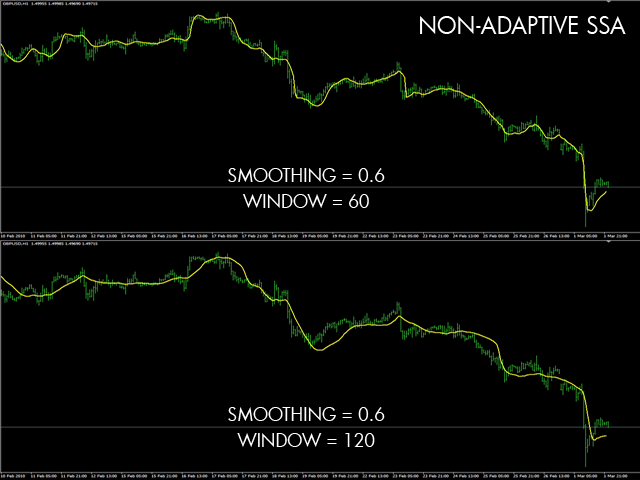
  1. First Set your Window Size. The higher the size, the higher the smoothing capability, but it is also slower to process.
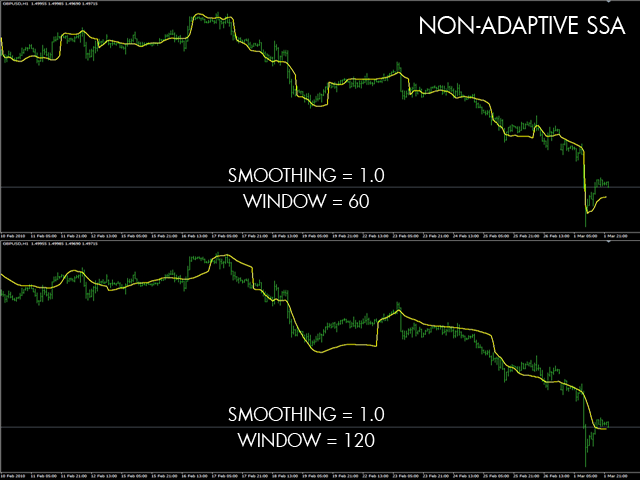
  2. Select the ET bins you like. If you want more smoothing select only 'Bin 1', but 'Both Bins' is often the best choice. Bin 1 selection is often best for the Non-Adaptive mode.
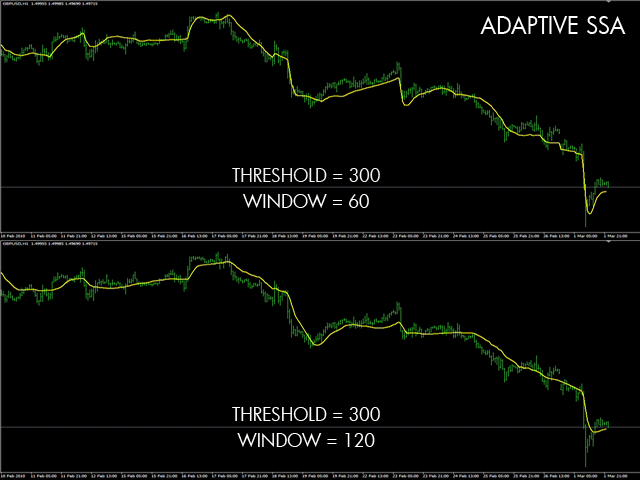
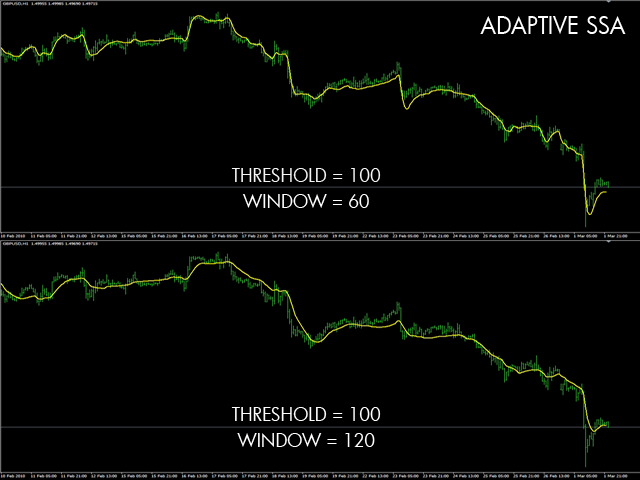
  3. Set the Threshold to a high value (for example 800.0) and lower it step by step until you're satisfied with the adaptiveness of the curve. A value too low and there is no smoothing, A value too high and there is too much smoothing and no adaptiveness, so you have to find the right value for your trading style.


WHAT TO DO IF YOU HAVE A SLOW PC :

If the processing of N past bars is cut short because of the time limit set in the parameters, you can do several things:
  1. use a VPS
  2. Make the processing time limit higher ('Max Computation Time').
  3. Lower the Smoothing factor.
  4. Lower the Window Size (less smoothing but faster processing).
  5. Use only ET Bin 1 only.
  6. Raise the 'Step' parameter in Adaptive Mode.
  7. Disable 'Extra Precision'.

As a rule of thumb, the bigger the 'Window Size', the better the smoothing, but also requires more processing power.

If your computer is not powerful enough to process Realtime tick data :
This indicator has been made to be used at the close of the bar. The computation happens only once per bar, at the close of the bar.
Another way is to use the 'extrapolate last bar' function : It will compute the SSA for the last bar at the open.

PARAMETERS DESCRIPTION
  • Threshold -- the smoothing is lowered step by step until the difference with the signal is under the 'Threshold' value.
  • Smoothing Start  [0..1] 
  • Smoothing Stop  [0..Smoothing Start]
  • Adaptive Step [1..window] -- The 'Smoothing Start' value is lowered step by step (using the 'Adaptive Step' value), until it reaches the 'Smoothing Stop' value.
  • Extra Precision
  • Extra Precision Threshold [0..1] -- If 'Extra Precision' is set to 'True', the step value is lowered to the smallest value possible.
Global Parameters :
  • ET -- You can select the 'Bin 1', the 'Bin 2' or 'Both'. 'Bin 1' is smoother than 'Bin 2' but sometimes you need both, specially in the 'Adaptive Mode'.
  • Window Size -- Higher Size = more smoothing but also is lower to process.
  • Realtime Mode (recomputes SSA on every tick) -- this mode requires a high-end CPU and is not really necessary because it's better to wait the end of the bar before deciding if there is a reversal.
  • Max Realtime Tick Computation Time (in seconds) -- This value is the maximal duration of the processing of ONE window. If the processing takes longer, 'Realtime Mode' processing is not possible, because ticks will arrive faster than the processing of the data is possible.
  • Extrapolate last bar -- Forecast of the next value based on the past values and the Open of last bar ('Realtime Mode' must be 'OFF').
  • Use Additional Memory -- More memory is used but this speeds up the processing of the SVDs.
  • Bars to compute -- Number of past values to compute.
  • Max Computation Time (in seconds) -- If the processing of the 'Bars to compute' past values takes more time than that value, the process will be stopped.
Alerts :
  • Display Current Slope Value -- true/false. Will print out the slope of the current bar in the "Experts" or "Log" tab.
  • Alert on Reversal
  • Minimum reversal amount (in points) -- the minimum amount a price has to pull back before an alert is sent.
  • Alert on Slope
  • Minimum Slope amount -- the minimum slope of the SSA before an alert is sent.
  • Use MT4 Sound Alerts
  • Use Email Alerts
  • Use Push Alerts 


Recommended products
Advanced SSA
Jean Francois Le Bas
SSA stands for 'Singular Spectrum Analysis'. It combines elements of classical time series decomposition, statistics, multivariate geometry, dynamical systems and signal processing. SSA decomposes time series into a sum of components (ETs), with each component representing a lower smoothing, using several SVD (Singular Value Decompositions). It is a powerful filtering process used in many fields of research (climatology, biomedical, aerospace, etc), where high quality forecasting and smoothin
125 USD
The Trend Professor is a moving average based indicator designed for the purpose of helping the community of traders to analyse the price trend. The indicator will be displayed in the main chart as it is indicated on the screenshot section. How it works The indicator has lines of moving averages and colored histograms to depict the direction of the trend. There will be a fast signal line colored blue/yellow/red at some points. The red/yellow colored lines stands for bearish trend/signal while th
250 USD
Emergencys
Tatiana Savkevych
The Emergency indicator shows potential market reversal points. The main use of the indicator is to generate buy and sell signals. Determining the market trend is an important task for traders. The intelligent algorithm of the indicator determines the trend well, filters out market noise and generates entry and exit levels. Implements an advanced algorithm for visualizing the market trend. The indicator is designed to determine either a trend or short-term buy or sell signals. The indicator will
139 USD
XFlow4
Maxim Kuznetsov
XFlow shows an expanding price channel that helps determine the trend and the moments of its reversal. It is also used when accompanying transactions to set take profit/stop loss and averages. It has practically no parameters and is very easy to use - just specify an important moment in the history for you and the indicator will calculate the price channel. DISPLAYED LINES ROTATE - a thick solid line. The center of the general price rotation. The price makes wide cyclical movements around the
250 USD
Neon Bot EA
Aleksandr Ivanov
5 (1)
They say that currency market is flat most of the time.  NEON Bot EA based on this principle namely on the logic price's return to average value with filtering entry due to custom indicator. EA uses the strategy of martingale therefore it sets stop-loss for each position separately. Also the quantity of orders in the grid is limited. Don't try to change recommended MM to avoid a large drawdown.  Signals:   https://www.mql5.com/ru/users/samivanov/seller !Attention! EA is sensitive to chart peri
468 USD
Please contact me at telegram  https://t.me/smartforex7 After purchasing SmartForex Indicator then Use This Indicator...................... SMART EXIT PROFIT LINE Indicator is very Helpful with SmartForex Indicator ........................................ SMART EXIT PROFIT LINE Indicator Attach with SmartForex Indicator after then Red Line Show Exit buy Profit , Green Line show Exit Sell Profit................
FREE
Dragoinoid Expert
BILLY ARANDUQUE ABCEDE
Setfile Here : https://drive.google.com/file/d/1Hu3Df8iq2fOtZ8o-_VV3JaLRa8Foniok/view?usp=sharing Dragonoid Expert is based on Price Action Strategy. Fast In Fast Out Transactions, High Frequency Trading, Use ECN Accounts. Risk Warning: Trading financial products on margin carries a high degree of risk and is not suitable for all investors. Losses can exceed the initial investment. Please ensure you fully understand the risks and take appropriate care to manage your risk.
1 999 USD
This indicator is a perfect wave automatic analysis indicator for practical trading! The standardized definition of the band is no longer a wave of different people, and the art of man-made interference is eliminated, which plays a key role in strict analysis of the approach. Increase the choice of international style mode, (red fall green rise style) The  purchase discount is currently in progress! Using this indicator is equivalent to enhancing the aesthetics of the trading interface and
188 USD
Drawing Pack
John Louis Fernando Diamante
4 (1)
This indicator provides several drawing tools to assist in various methods of chart analysis. The drawings will keep their proportions (according to their handle trendline) across different chart scales, update in real time, and multiple drawings are supported. # Drawing Option Description  1 Grid box draggable boxed grid, user defines rows x colums, diagonal ray option  2 Grid partial or fullscreen grid, sized by handle line  3 Grid flex a diagonal grid, sized and sloped by handle line
99 USD
100% non-repaint MT4 indicator with advance pre alert Pros: Neural Network based Advance price action algorithms Pre-alert (get ready) signals Non-delay indications 24/7 signals Can do Auto-trading  100% Non repaint 100% No lag No recalculating Lifetime license Cons: Very few signals Instructions to use: #1 Do not enter a trade if pre-alert appears on a hammer type candle. #2 Do not trade when market is making very small candles (indecision candles- dash
FREE
Macro
Andriy Sydoruk
A simple indicator algorithm with the highest accuracy generates input signals by intersecting lines. Strategy for trading by trend, filtering and all the necessary functions built into one tool! The principle of the indicator is to automatically determine the current state of the market when it is placed on a chart, analyze historical data, based on historical data and display instructions to the trader for further actions. The system itself shows in the form of intersection of lines when to bu
83 USD
Impulse fractals indicator - is counter-trend oriented complex market fractal pattern.  Market creates bull/bear impulse, trend starts, fractals on impulsed wave are an agressive pullback signals. Buy arrow is plotted when market is bearish and it's impulse showed up-side fractal, and sell arrow is plotted when market is bullish and it's impulse showed dn-side fractal. Main indicator's adjustable inputs : impulsePeriod - main period of impulse histogram  filterPeriod  - smoothes impulse accordi
199 USD
Trend Ranger XO
Aleksandr Martynov
Индикатор разработан на основе https://www.mql5.com/ru/market/product/46814. Адаптирован для отображения другого популярного индикатора представленного на рисунке в подвале. Важно! Сигнальным является 0 бар - не перекрашивается!  Параметры индикатора: Zone Range (Pips)   - размер зоны в пипсах без учета количества знаков; Line or Histogram Width   - ширина линий или гистограммы;    Zone Draw Type  - способ отрисовки зон: в виде гистограммы или линий на графике; Up Zone Color   -  цвет зоны BUY;
150 USD
!! FLASH SALE !!   Over 75% off !!     For ONE week only. Now only $57 - normally $297! Ends on 31 March - Don't miss it! Buy and Sell Arrows when price breaks out from Consolidation. It Also Alerts – On MT4 To Your Phone To Your Email Does not repaint . Works ony any Forex pair/timeframe -  Ajust the settings for your pair/timeframe. 10 Activations See example of Alerts from today (23 May 22) using this and 2 other of my indicators  here . MT5 Version here .  What is Consol
57 USD
Stable Pulse
Ivan Simonika
The work of the Stable Pulse bot is displayed in the form of several key mmoments, which can be seen in the screenshots. This development is a scalping system. You can download and test the bot for free this way by yourself making sure of its capabilities. The bot can be tested on different currency pairs and different periods. The main thing is to set the tester settings as shown in the screenshot, for correct testing. You need to trade on timeframes M1-M15. Expert Advisor is designed to trade
500 USD
Pinnacle
Mpendulo Chiliza
The Pinnacle expert adviser is based off the Three Peaks Indicator ( Read More ). I have received a lot of reviews so here it is, I've finally got the time to develop the Three Peaks Expert Adviser version namely Pinnacle . Pinnacle can trade in both directions(up or down). I have spent a lot of time to figure the right ratio of  TakeProfit against StopLoss . Based of popular belief the TakeProfit is twice as the StopLoss. a 2:1 Relationship, you can set your own ratio by using n_tp and n_sl . /
250 USD
The basis of the indicator is based on my trading strategy, according to which I trade daily. I automated my system so that it would learn on the market independently. The indicator will not show transactions on the history of the chart, since all calculations of the trading system are in real time. Differences from other indicators: Real time calculations Dynamic Take Profits Dynamic Signals Trend Signals Ideal for beginners Any Currency Pair Any TimeFrame Suitable for scalping To
230 USD
Moving Pivot Average    The indicator uses very flexible algorithm for pivot value calculating. It allows you to allocate in days a certain time intervals (custom bars) and calculate the average pivot value based on High, Low and Close prices of these bars. The duration of custom bars is set by the "Day Minutes" setting - it can take values from one minute to one day (1440 minutes). How many custom bars will be taken into account is determined by the "Days" setting. The pivot line can be conside
60 USD
Market Pulse EA
Evgenii Golovanets
5 (3)
Market Pulse is a unique author's algorithm that combines a simple strategy for breakout levels, combined with a multi-level system of filters and modules.  If you noticed that 90% of authors in MQL have real monitoring of their experts is rarely more than $100-$500. But in strategy tester, their EAs bring millions of dollars in profit. However, nobody asks why they sell these EAs, if they can become a millionaire in one year. I offer you a different approach to forex trading, a realistic profes
2 000 USD
SmartScalper
Oleg Borisov
3.67 (3)
The easy-to-use trading system SmartScalper generates the following signals: BUY SELL close BUY close SEEL SmartScalper works on the М15 timeframe and is optimized to work on GBPUSD, XAUUSD, GBPJPY, EURJPY, EURUSD. 12 different sets of trading algorithms are designed for trading (6 buy and 6 sell trades), which can be quickly selected by the trader using buttons in the indicator window, or are set in the input dialog. The efficiency of the trading algorithms chosen by the trader is measured in r
82 USD
Ska ZigZag BuySell
NKATEKO VUKOSI LEROY MASANGO
Ska ZigZag BuySell indicator determines the overbought and oversold regions within a trend. The indicator determines the overbought region by the candlestick high and the oversold region by the candlestick low. This indicator only gives signals with arrow and audible alerts each and every time when a new candlestick appear. To utilize the full strategy i recommend using "Ska ZigZag BuySell" together with "Ska ZigZag Line". The Ska ZigZag Line indicator is available for free. NOTE: Indicator is h
55 USD
Smart trends view
Maria Cristina Sabatini
Clear trend filter   This is a filter-trend indicator.  From the settings you can select to use more filter or less. The very interesting part of the indicator comes out using with all the filter. In this way you can follow the trend easily even when the market is without a strong trend, but is instead more flat. I personally use it on 1 minutue timeframe with  MORE FILTER (you can select it from the input setting) in order to have an overlook of trend in the market.   Added: - Sound Notificatio
30 USD
KT Forex Trend Rider MT4
KEENBASE SOFTWARE SOLUTIONS
KT Forex Trend Rider uses a trend following algorithm developed specifically for the Forex market to provide reliable buy & sell signals across the major currency pairs. It works best on major FX pairs and all time-frames. Features It comes with a Multi-Timeframe scanner that can search for upcoming signals across all the time-frames. It comes with four preset profiles to facilitate trading for scalpers, tick-trend, swing, and trend traders. It marks the potential reversal points in the mark
30 USD
INTRODUCING WORLD'S FIRST  Auto Scale MT4 Naveen's Geometric Box  To Analyze Markets Geometric Relationship. Naveen's Geometric Box has some of the most impressive features you will ever find Auto scaling of chart any time frame any symbols. The Naveen's Geometric Box is a Tool to Drawing offset angles,squares and circles.Mr. M.S jenkins followed  offset squaring methods.Their is 3 dividers -33.3,66.6 also known as WD.Gann 33.3,66.6 method,4 dividers 25%,50%,75% to find out Timing Reversal/tu
999 USD
This unique auto trend line drawing indicator works on all time frames which can help you to easily trade short term trend reversals as well as  as well as short term trend breakouts indicating the stronger asset in the market. It uniquely allows you to get in EARLY for heavy swings. Inputs include:  - Max Candles Look Back for Trend Lines - Line Type and Color - Max Distance to Outer Band and Band Period - Options to Auto Re-Draw Trend Line off of the Pivot When a Confirmation Candle or
1 000 USD
CSS " currency strength slope "  is a a multi currency strength indicator that use Forex major currencies, EUR, USD, CAD, AUD, NZD, JPY, CHF, GBP. it use 28 major pairs to calculate the power of every currency using a based moving averages algorithm : you will see volatility clearly between currencies. input: MA Fast & Slow. - MA Mode : simple, exponential, smoothed, linear weighted - Applied Price : close, open, high, low, median price, typical price, weighted price.
30 USD
Market Chopper Indicator - is the manual system for market scalping. Indicator uses most accurate points to enter, when current trend has lost it's power and new one starts. Indicator shows : Enter points(buy/sell arrows), Exit points(Stoploss/Takeprofit arrows). Indicator makes market analysis and adapts to any market, any timeframe showing most relevant strategy for exact conditions. Main Indicator's Features Signals are NOT repaint, late or disappear; Every signal comes at the open of new bar
199 USD
Trend Sim
Ivan Simonika
This is a professional Trend Sim indicator. The intelligent algorithm of the Trend Sim indicator accurately detects the trend, filters out market noise and generates input signals and exit levels. Functions with advanced statistical calculation rules improve the overall performance of this indicator. The indicator displays signals in a simple and accessible form in the form of arrows (when to buy and when to sell). Knowing the entry point of each of the currencies is very important for every
129 USD
TIO Wizard
Ihar Tsitou
Классическая Торговая стратегия возврата к среднему. Что мы имеем: 1-Индикатор Standard Deviation переводится как среднеквадратичное отклонение – математический термин, описывающий показатель рассеивания (дисперсии) значений случайной величины. Она полностью идентична расчету среднеквадратичного отклонения, определяемого относительно периода n как квадратичная разница текущей цены закрытия свечи Close и значения простого скользящего среднего выбранного n-периода, деленного на количество свеч
1 300 USD
This strategy is characterized by simplicity and rudeness. Simple things, it is widely applicable, durable, strong stability. This is an advantage to having a certain amount of money, because the demand for big money is stable. The need for small capital is efficiency. Efficiency requires Intensive farming. There are a lot of things you can refine to increase your efficiency. But I’m not sure I can build a sophisticated EA money machine. Efficiency and stability are a dialectical relationship. H
1 000 USD
Buyers of this product also purchase
Ultimate Sniper Dashboard
Hispraise Chinedum Abraham
4.78 (18)
Discounted at $299! Prices may increase in the future! Read description below! Best Entry System for Ultimate Sniper Dashboard: ULTIMATE DYNAMIC LEVELS. (Please Check my products) The Ultimate Sniper Dashboard ONLY works on live markets due to MT4 multicurrency testing limits. Introducing the Ultimate-Sniper Dashboard! Our very best which contains both HA-Sniper, MA-Sniper. and many special modes. The Ultimate Sniper Dashboard is an absolute beast! Best Solution for any Newbie or Expert Trad
299 USD
FFXMV Dashboard Plus
Opengates Success International
Full Forex Market View Dashboard Plus This is a custom indicator created to give Traders a full view of what is going on in the market. It uses a real time data to access the market and display every bit of information needed to make successful trading. The PLUS there to produce the kind of RESULTS as you see in the SCREENSHOTS, I added a MultipleOrder Utility EA with it with instructions on how to use it with FFXMV Dashboard. INSTALLATION : Read the MANUALS that comes with the rest of the
850 USD
Ns_Geometric Chart Scale for MT4-Gann Grid,Gann Square & Gann box...To Draw any Geometric Shapes and Gann grid. #Forex Currecnies Pairs-Place same number & decimal in Gann Grid. if Commodities & Cryptocurrencies chart scale shows 0.66/66 same Scale for GannGrid ,for Gann square/Gann scale-66/660 Box only Numbers. #If Stocks & Index sale display - 3.03 that means Same scale input 3.03 for  Gann Grid and 303 for Gann Square & Gann Box Scale. Video Links :- https://youtu.be/Wnzq2-65GG4           
599 USD
Please send me Direct message on MQL5 CHAT after purchasing the Indicator for Training and Installation Support There are some additional files that is important to use with the Indicator . So be sure to contact me after purchasing the Indicator So that I can add you for training and support . If you find any difficulty with installation then send me Direct message here So that I can connect with you via Anydesk or Teamview for the product installation. " Smart Order Block Indicator " to find
249 USD
Weis Wave with Alert
Panagiotis Diamantopoulos
4.78 (18)
20% Off from 499$ to 399$, offer end 31/3/2023    https://youtu.be/RjSSW0byp-I ** NEW PLUTUS SIGNALS and ALL IN ONE ** Wychoff's UpThrust + Spring, Fake Breaks and Plutus  trading signals added (for more info visit  http://www.tradethevolumewaves.com  ) Different Wave Types, choose what your cumulative Histogram diplays: Volume, Pips, Progressive Volume Rate, Time or Emphasized Volume Waves  **IF YOU PURCHASE DO NOT FORGET TO CONTACT ME BECAUSE THERE IS MORE: Two Hrs Webinar + Training Room
399 USD
The breakout algorithm is a technique based on price, price features, to shape a breakout strategy. The strategy in this indicator will not be redrawn (none-repaint indicator), it is suitable for short or long term traders In the screenshot is the EURUSD pair, these currency pairs, commodities or stocks, it have similar strength *Non-Repainting (not redrawn) *For Metatrader4 Only *Great For Scalping *Great For Swing Trading *Arrow Entry, Green is Long, Red is Short *Works On Any Timeframe *Work
9 900 USD
Full Forex Market View Dashboard
Opengates Success International
5 (2)
FULL FOREX MARKET VIEW Dashboard Indicator This is a custom indicator created to give Traders a full view of what is going on in the market. It uses a real time data to access the market and display every bit of information needed to make successful trading. INSTALLATION : Before attaching this Indicator to your window chart, go to your MT4's Market Watch panel and HIDE all the Currency pairs you don't need or trade and leave the rest there. The reason is that FFMV Dashboard will DISPLAY ALL the
650 USD
Gann Dynamic Square
Naveen Saroha
5 (1)
INTRODUCING WORLD'S FIRST MT4 & MT5  Gann Dynamic Square, Circle and Equilateral Triangle  To Analyze Market Geometric Relationship. Gann Dynamic Square  has some of the most impressive features you will ever find in Gann & Geometric Analysis world. The Gann Dynamic Square is a tool to draw offset Square,Equilateral Triangle & Circle.Most charting software or MT4/MT5 market indicators don't have these features. You will be able draw your Geometric shapes like a professional geometric analys
399 USD
WORLD'S FIRST AUTO SCALED GANN PERCENTAGES CHANEL AND GANN GRID                                                                     W.D. Gann Grid With auto Scale & Percentage Change.. Gann Grid is unique concept to finding major turning points  and Support/resistance level Our tools has additional feature for Scale point input method and price percentage method to use any stock and commodities charts scale. Normally people are using fix grid for a
300 USD
VTrende Pro mt4
Andrey Dyachenko
VTrende Pro MT4 - MTF indicator for trend trading with a display panel for MT5 *** Videos can be translated into any language using subtitles (video language - Russian) Although the signals of the VTrende Pro indicator can be used as signals of a full-fledged trading system, it is recommended to use them in conjunction with the Bill Williams TS. VTrende Pro  MT4 is an extended version of the VTrende indicator. Difference between Pro version and VTrende: - Time zones - Signal V - signal 1-
697 USD
The Nihilist 5.0 Indicator includes Forexalien and Nihilist Easy Trend trading strategies and systems. It is composed of an MTF Dashboard where you can analyze the different input possibilities of each strategy at a glance. It has an alert system with different types of configurable filters. You can also configure which TF you want to be notified on your Metatrader 4 platform and Mobile application The indicator has the option to view how could be a TP and SL by using ATR or fixed points, even
299 USD
Introduction to X3 Chart Pattern Scanner X3 Cherart Pattern Scanner is the non-repainting and non-lagging indicator detecting X3 chart patterns including Harmonic pattern, Elliott Wave pattern, X3 patterns, and Japanese Candlestick patterns. Historical patterns match with signal patterns. Hence, you can readily develop the solid trading strategy in your chart. More importantly, this superb pattern scanner can detect the optimal pattern of its kind. In addition, you can switch on and off individu
250 USD
The Hurricane Indicator
Paul Nicholas Clevett
5 (1)
Currently switched to the 4 hour chart - but use other time frames for confirmation. :-)  I change my main time frame based on the market movement at the time. The Hurricane Forex Indicator is a multi time frame indicator that includes such things as Trade Notifications, Trade Calculator, Momentum Indicator, risk reward and much more. We have a free Trade room for our users as well. Please check out the video for full details of how this indicator works as it has over 15 years worth of developme
599 USD
Naked Forex Kangaroo Tail Pro Indicator Kangaroo Tail Pro Indicator is a pattern recognition indicator for Forex, Stocks, Indices, Futures, Commodities and Cryptos. The Kangaroo Tail is a multi-bar pattern. The Kangaroo Tail pattern is very effective and is very simple to trade. The strategy that comes with the Kangaroo Tail is based on price action. The indicator does what it was designed for: displaying Kangaroo Tail patterns.   Don't expect to follow the up and down arrows and make mo
299 USD
This indicator uses support and resistance, volume and some special formula to calculate the volume to filter the candles. If the volume reaches a specific value, And at the same time, Candle breaks the support/resistance line, There would be a signal and we can enter the market. Signals appear when the current candle closes. then you can enter the trade when a new candle appears. Please don't forget to follow your money management plan. MT5 Version Support/Resistance Breakout MT5 :   https:
299 USD
This is an indicator with real-time reminder function, which can realize real-time monitoring of four harmonic patterns of multiple cycles (30 minute chart, 1 hour chart, 4 hour chart, 1 day chart), and help traders to have insight into market reversal opportunities. Gartly Bat Butterfly Cypher Before loading into the chart, you need to manually input the switch parameters, which are the harmonic patterns   and time period you want to monitor: M30 / H1 / H4 / D1. It is on  when the corresponding
499 USD
A. What is A2SR ?   * It's a leading technical indicator (no repaint, no lagging). -- Guidance : -- at   https://www.mql5.com/en/blogs/post/734748/page4#comment_16532516 -- and  https://www.mql5.com/en/users/yohana/blog A2SR has a special technique in determining the levels of Support ( demand ) and Resistance ( supply ) . Unlike the ordinary way that we seen on the net, A2SR has a original concept in determining actual SR levels. The original technique was not taken from the internet,
376 USD
FTU Predictor A unique indicator for buy low, sell high strategies -- high precision future price predictor for high or low of any product for Weekly, Daily, 4hr and even 1hr charts. https://youtu.be/40oOn45Nv58 This  Indicator is for mt4 platform only, can be used solely for trading or with a combination of other indicators and strategies Providing high and low price levels for expected target and turning points, unique support and resistance -- see my videos for examples Want to know which day
800 USD
CFF Dark M Volume This is the most accurate Volume Reversal & Trend Following System for MT4 providing accurate signals to enter a trade without redrawing or delays.   It can be applied to:  All MT4 Charts . . The best results are on the timeframe 1H & 4H    | Our MQL5 Channel   IMPORTANT! Contact me after your purchase to get the detailed guide.   Most traders are %99 accurate with the help of CFF Dark Money Volume System.    Benefits of CFF Dark M Volume System  Entry signals  ba
1 313 USD
A percent graphic is a type of graph or chart used to represent data as a percentage of a whole. Percent graphics are often used to illustrate how a given set of data is distributed between different categories or how certain trends have changed over time. Percent graphics can be used to show the composition of a dow jones , or the performance of a company over a given period of time   d1 percet  w1 perncet  m1 percent  y1 percenty
500 USD
Witch Hat for Binary Options is an indicator for binary options based on analysis of Bollinger Bands and RSI, using a modulated strategy with indicator settings using complex filters. This indicator never repaints, it has an almost accurate answer for you to make the entries. There are two ways for you to analyze your entry, when an arrow appears you have more than 90% chance of hits, and the other way is the lines that it automatically draws and its trend line. It has surprisingly strong s
900 USD
Algo Trading Indicaor  With this indicator , you’ll have zones and trends that hight probability the price will reverse from it. so will gives you all the help that you need  Why should you join us !?  1-This indicator is logical since it’s working in previous days movement , to predict the future movements. 2-Algo trading indicator will help you to draw trends which is special and are too strong than the basics trend , trends will change with the frame time that you work on . 3-We can
249 USD
AAA Traders Tools
Lyubomir Kratinov
5 (1)
AAA Traders Tools One of the most desirable talents a trader can have, is an ability to see near-term activity in a long-term context. Exceptional traders know when to enter the market and how long to hold position.  When you know how the market works and you have a big picture which identifies critical price levels, you can react quickly to capitalize on current activity. Professional Traders Only!  Education included **** you will need an additional file snd.ex4 to your indicator fo
3 000 USD
EZT Trend
Tibor Rituper
4.5 (2)
The EZT Trend indicator will show you the trend, the pullback and the entry opportunities. Optional filtering and all type of alerts are available. E-mail and push notification alerts are added. We are also developing an EA based on this indicator, which will be available soon. It is a multi-functional indicator consisting of two color histograms and a line. It is a visual representation of a trend direction and strength, also you will find divergence many times, either on the line or on the his
320 USD
Precautions for subscribing to indicator This indicator only supports the computer version of MT4 Does not support MT5, mobile phones, tablets The indicator only shows the day's entry arrow The previous history arrow will not be displayed (Live broadcast is for demonstration) The indicator is a trading aid Is not a EA automatic trading No copy trading function The indicator only indicates the entry position No exit (target profit)  The entry stop loss point is set at 30-50 PIPS Or the front
1 800 USD
Gartley Projection D
Oleksandr Medviediev
4.17 (6)
The indicator identifies the harmonic patterns (XABCD) according to developments of H.M.Gartley ( "Profits in the Stock Market" , 1935г). It projects D-point as a point in the perspective projection (specify ProjectionD_Mode = true in the settings). Does not redraw. When a bar of the working timeframe closes, if the identified pattern point has not moved during Patterns_Fractal_Bars bars, an arrow appears on the chart (in the direction of the expected price movement). From this moment on, the ar
300 USD
#1 Trading Indicator - ADTS - Advanced Dynamic Trend-Trading System For Professionals Traders ONLY! Education included.  Meet the Evolution of trading indicators  Unlock unlimited trading opportunities and take advantage of any Market moves. Setting up ADTS MT4:   https://youtu.be/K50HT1xTaYI ADTS basics. How to read and trade with ADTS:   https://youtu.be/F3t0rnofgKQ //----------------------------------------------------------------------------------------------- //---------- NOTE!...  YOU N
3 000 USD
AURUS Arrow
Dmitriy Soldatenko
Индикатор AURUS Arrow предусматривает возможность выявления различных особенностей и закономерностей в динамике цен, которые не видны невооруженным глазом. AURUS Arrow — индикатор, показывающий стрелки покупки-продажи, которые определенно помогут каждому трейдеру, который не знает как торговать. На основании этой информации, трейдеры могут предположить дальнейшее движение цены и корректировать свои стратегии, соответственно. Буферная стрелка покупки-продажи с сигнальным алертом. Тайм-фре
279 USD
Offer 249 down from 350 for the next 3 copies. then back to 350 $ Are you tired of using outdated indicators that leave you guessing where to set your profit targets? Look no further than the AK CAP Opening Range Breakout Indicator. This powerful tool is backed by a US patent and has already helped countless traders pass funded challenges like FTMO. We use it daily on our prop traders and internal funds, and now it's available to you as well. The calculation behind the indicator is incredibly
249 USD
Prometheus Trade Engine is an indicator that combines price action, ratio based indicator with custom indicators& other lagging indicators to create this leading indicator that has a multi-timeframe approach to trading so that you are able to see what other timeframes are doing all in one chart and give you high probability trade setups to assist you to make a prediction on what is MOST likely to happen in the market going foward Chart Features 1. Reversal Zone It is the rectangular box on
250 USD
More from author
Tick Sound
Jean Francois Le Bas
Tick Sound will play a different sound each time a tick is triggered. When the tick is higher than the previous one, an "UP" sound is triggered When the tick is lower than the previous one, a "DN" sound is triggered The sound i chose is a Sheppard Tone : it's an audio effect that simulates and endless ramping sound up or down which is perfect for this task. There are three main parameters for Tick Sound Ask : will play a sound each time a new Ask value is output. Bid : will play a sound each t
35 USD
Fisher Reversals
Jean Francois Le Bas
This indicator weigth the actual close price with the high and the low of past values then it is computed by a simple 1 lag IIR filter before being processed by a final logarithmic algorithm to order the data. This Indicator is perfect to find precise reversals. Rules of Trading :  1) Be sure that the yellow line is in overbought/oversold (above +5 or under -5) The higher/lower, the better. 2) Wait for the gray line to touch the yellow line then separate from it : this is the signal. 3) If t
67 USD
Trend Range detector
Jean Francois Le Bas
1 (1)
Trend/Range Detector is an indicator that allows to determine with accuracy if the future price will range or trend in the following bars. The Indicator is drawn in a separate window where two lines are displayed : the crossing of the main signal (blue) with a moving average (orange) will determine if each zone is a trending or ranging market. Parameters : period : the number of bars to look back (default = 20) type : type of the main signal (trend or range) (default = RangeDetector) Moving av
67 USD
Trended Digital Oscillator
Jean Francois Le Bas
4 (1)
Oscillators are, by nature, exemple of any trend information. This indicator is "trended", meaning is it reacting to trend as well: if the oscillator is in the UPPER part of the window, then trade only BUYs. if the oscillator is in the LOWER part of the window, then trade only SELLs; You can also choose to start trading when the trend begins (see Alerts) Parameter description: lookbackOsc : Period of the yellow line (the digital oscillator). (default = 14) DSFast :  Fast Period of the oscillat
67 USD
Advanced SSA
Jean Francois Le Bas
SSA stands for 'Singular Spectrum Analysis'. It combines elements of classical time series decomposition, statistics, multivariate geometry, dynamical systems and signal processing. SSA decomposes time series into a sum of components (ETs), with each component representing a lower smoothing, using several SVD (Singular Value Decompositions). It is a powerful filtering process used in many fields of research (climatology, biomedical, aerospace, etc), where high quality forecasting and smoothin
125 USD
TenFold
Jean Francois Le Bas
4 (1)
9 out of 10 copies left at $100 after that price will double ($200) ! so hurry This indicator is a mean-reversal type of indicator. Meaning it will not follow a trend but rather make profit from a change in price direction, when the price extends from it mean, but to come back to it later on. This indicator is 100% NON REPAINT and will not redraw its arrows once they appear. Each arrow is drawn at the close of the candle, not during the life of the candle. No parameters, only alert parameters.
100 USD
Focus
Jean Francois Le Bas
This indicator is profitable on 28/28 forex pairs on H1 timeframe WITHOUT SPREAD. You need to substract the spread to the profit amounts shown The code is robust with a high chance to continue being profitable no matter how the price action evolves.  But profitable on 28 pairs doesn't mean you should trade all the pairs all the time:  On less popular ones, liquidity is low, so spread will usually be high and will eat all the profits. You have to be careful and trade only when the spread is low
110 USD
TrueRSI
Jean Francois Le Bas
Built-in RSI indicator has an error in the algorithm. I spotted the error while working on a modified RSI where i needed the original algorithm with special input I started with the official formula and were having different curves from the built-in indicator. after thinking I had made a mistake in the algorithm, I realized the orginal indicator is wrong by looking at the code. So here is the real RSI, computed from the original formula, so you know it's the real indicator.
30 USD
Early Trends
Jean Francois Le Bas
Early Trends finds trends early, when price is still squeezed inside price action, which is the best time to spot a trend. When the price action makes higher highs or lower lows within the first bars back, while no HH or LL has been triggered on higher period bars back, then a trend is potentially beginning You can also take signals only in the direction of the trend, with the trend filter. Many parameters : Number of Bars Displayed Number of Bars Back HHLL Number of Bars Back Multiplier Perio
60 USD
Filter:
No reviews
Reply to review