Thermometer of Market
- Indicators
- Wen Cheng Wen
- Version: 1.5
- Updated: 13 May 2020
- Activations: 5
Measure the temperature of the market Like a thermometer .The function of this indicator is to measure the temperature of the market ,it is just like that using a thermometer to measuring water temperature, directly to show where the market is running and where it is likely to reach.
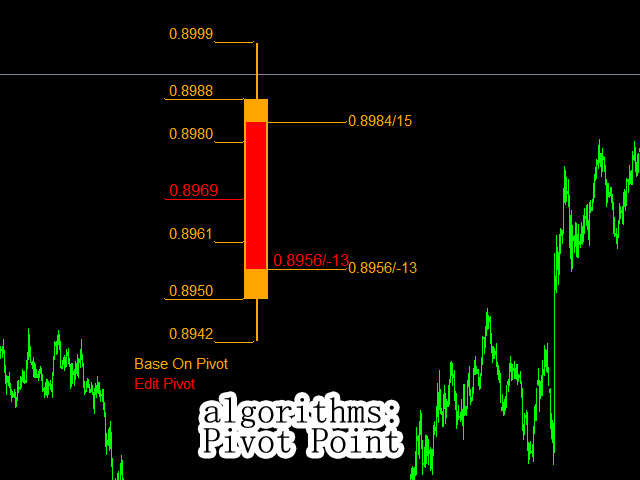
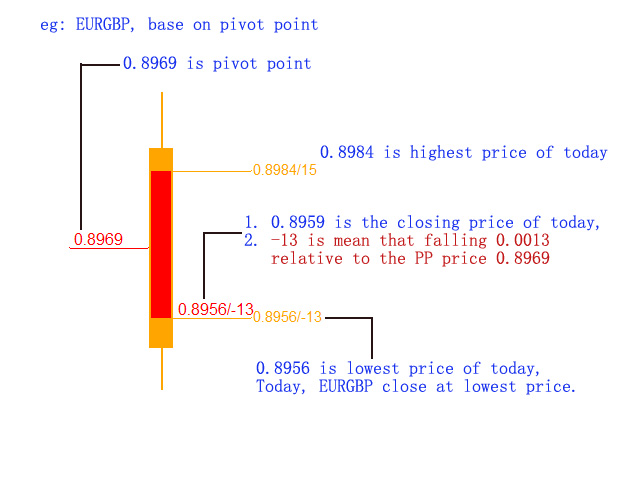
- Pivot Point is a resistance and support system. It has been widely used at froex,stocks, futures, treasury bonds and indexes. It is an effective support resistance analysis system.
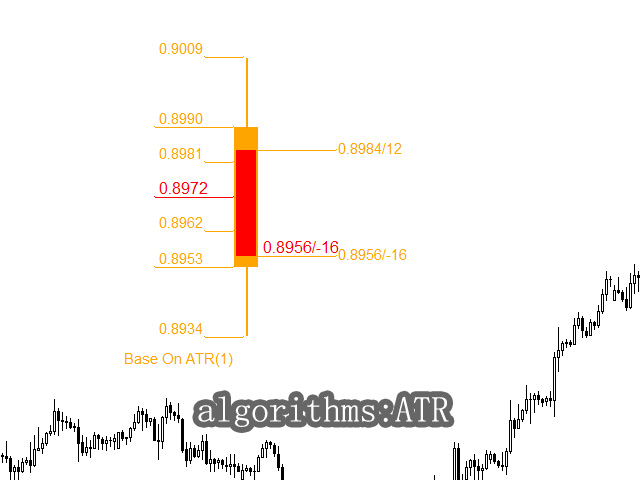
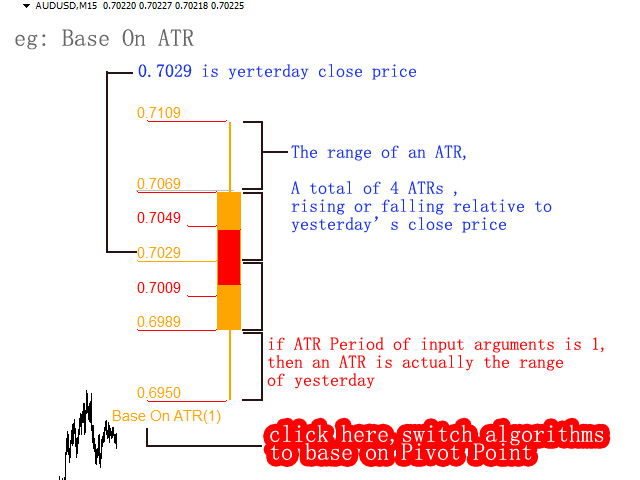
- Average True Range(ATR) is used to measure the volatility of market prices. ATR represents the actual situation of the market in the past period of time, and in many cases reflects the energy of the recent market.
- Mraket has its own rules,sometimes the market is very gentle, sometimes is very strong waves. Based on Pivot Point and ATR, we can predict the where the market is most likely to go and where it is most likely to back.
This indicator provide two algorithms, Pivot Point and ATR, you can switch between the two algorithms at any time.
Pivot Point
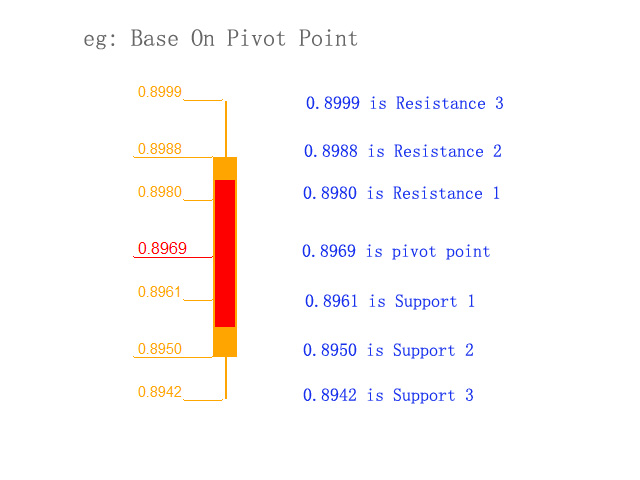
- Support Levels
- P=(LastClose+LastHigh+LastLow)/3;
- S1=2*P-LastHigh;
- S2=P-(LastHigh-LastLow);
- S3=(2*P)-((2*LastHigh)-LastLow);
- Resistance Levels
- R1=2*P-LastLow;
- R2=P+(LastHigh-LastLow);
- R3=(2*P)+(LastHigh-(2*LastLow));
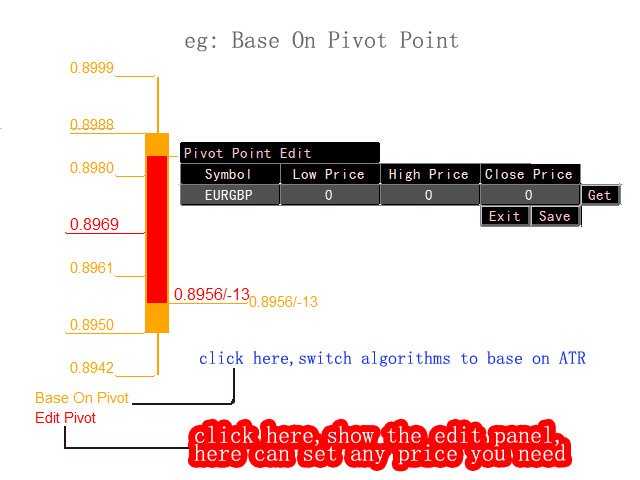
the defaut is yersterday's prices, and there have a modified interface to set any price you need.
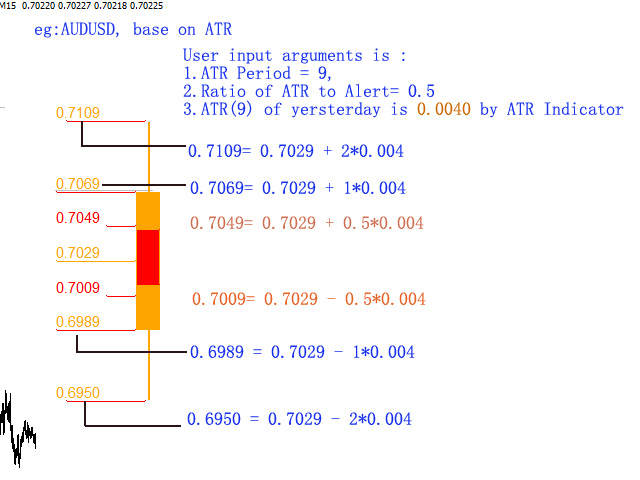
ATR: The ATR value takes yesterday's value and the chart period is D1. it is represents recent market volatility. by the input argument, can set the period of ATR.
User Inputs
- ATR Period - set here the Average True Range period , it can be 1,2,3..14. .
- Ratio of ATR to Alert - set here the ratio you want to show in the monitor,default is 0.5, more than 0,and not greater than 2
- X Distance - set here the x distance.
- Y Distance - set here the y distance.
- Thermometer Height - set here the Thermometer height.
- Thermometer Width - set here the Thermometer width.
- Thermometer0 color - set here the color.
- Thermometer1 color - set here the color.
- Font color1 - set here the color.
- Font color2 - set here the color.
Notice: Sometimes, the base data for this indicator cannot load immediately and correctly ,when you first load it on a chart. If this happens, change the period of current chart to give the indicator an opportunity to update,it will know to refresh it's base data again.
Notice:
Sometimes, the base data for this indicator cannot load immediately and correctly ,when you first load it on a chart.
If this happens, change the period of current chart to give the indicator an opportunity to update,it will know to refresh it's base data again.