PD Reversal Patterns
- Indicators
- Denis Povtorenko
- Version: 3.0
- Updated: 13 July 2019
- Activations: 5
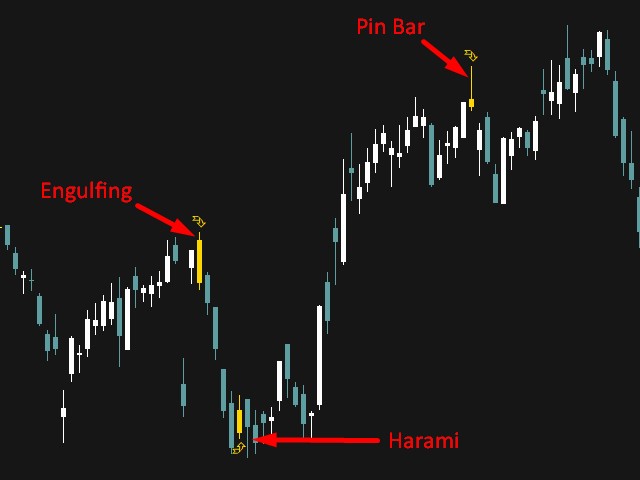
Технический индикатор "Reversal patterns" является математической интерпретацией классических разворотных паттернов: Pin Bar, Harami и Engulfing. То есть «Разворотного бара», «Харами» и «Поглощения». Данный индикатор позволяет определить момент разворота котировок на основе рыночной динамики и победителя между «быками» и «медведями».
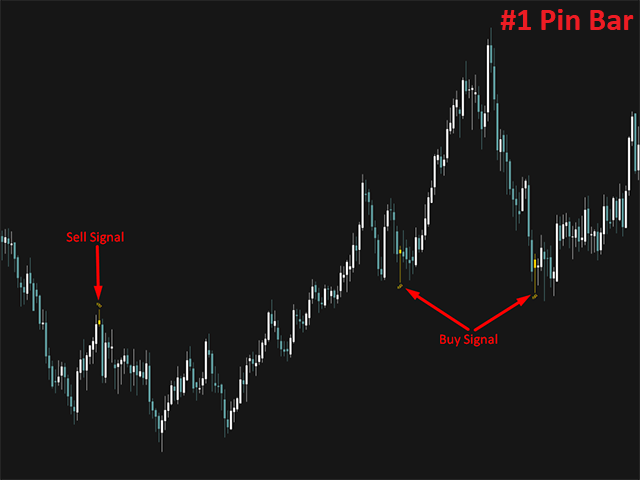
Индикатор отображает момент разворота на локальных максимумах и минимумах графика любого таймфрейма, что позволяет повысить точность сигнала. Также индикатор имеет широкий перечень параметров, что дает возможность адаптировать Reversal patterns под любые условия и торговую систему. Встроенный алерт и звуковое оповещение позволят открыть позицию сразу после образования разворотного сигнала.
Способ применения:
Если котировки достигают локального максимума/минимума и образовывается сигнал по индикатору Reversal patterns, а также по осциллятору формируется зона перекупленности/перепроданности, можно открыть позицию под Low/High значением сигнальной свечи. Stop Loss в таком случае станет обратный локальный максимум/минимум.
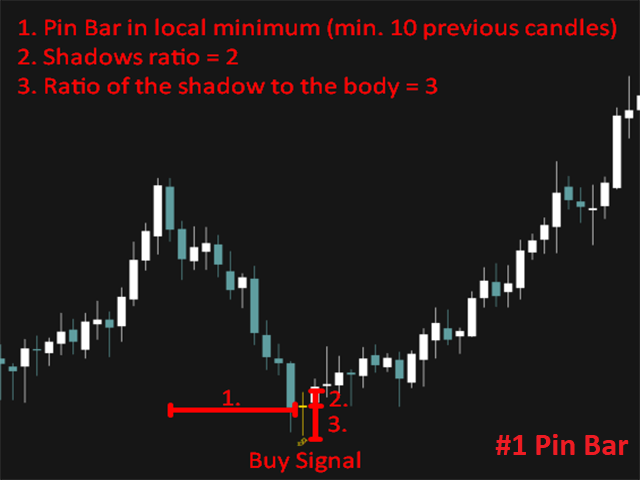
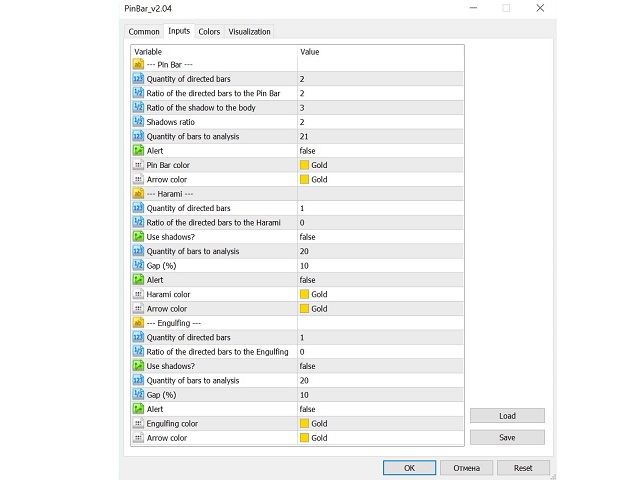
Параметры Pin Bar:
- Quantity of directed bars: отображает количество направленных баров для дополнительного анализа.
- Ratio of directed bars to the Pin Bar: Указывает на соотношение размера тел между направленными барами (трендовыми), а также телом разворотного бара (pin bar).
- Ratio of the shadow to the body: Коэффициент соотношения тела к тени.
- Shadows ratio: соотношение теней low и high значения.
- Quantity of bars for analysis: позволяет произвести расчёт количества баров для определения локального максимума или минимума.
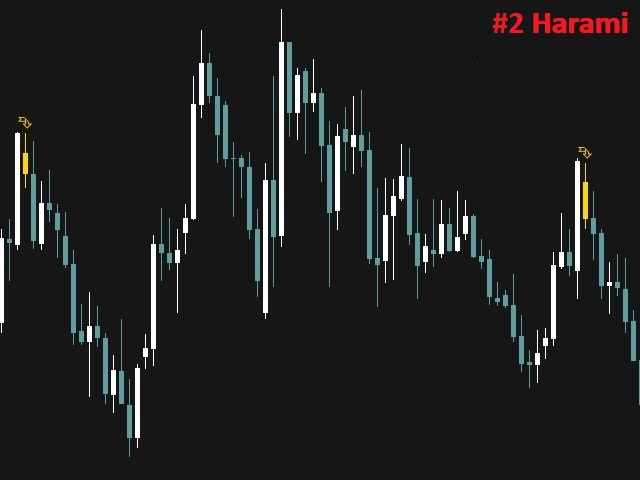
Параметры Harami:
- Quantity of directed bars: отображает количество направленных баров для дополнительного анализа.
- Ratio of the directed bars to the Harami: Указывает на отношение тела разворотной свечи к трендовой. По дефолту = 0. Если 0, то этот параметр не учитывается. Если 1, то разворотная свеча должна быть просто меньше чем трендовая. Если 2, то разворотная свеча должна быть в 2 раза меньше, чем трендовая (и тд.).
- Use shadows? – false/true. Переключатель. По дефолту = false. Что это? Этот параметр для принципа расчета паттерна. По дефолту трендовый бар должен полностью перекрывать параметры разворотного именно телом. То есть тело трендового больше чем тело разворотного + тени. При включенной настройке "Use shadows?" = true тогда тело+тень сигнальной свечи должно не превышать тело+тень трендовой и при этом иметь гэп от закрытия предыдущей (параметр ниже «Gap (%)»).
- Quantity of bars for analysis: позволяет произвести расчёт количества баров для определения локального максимума или минимума.
- Gap (%): Считает процент при котором разворотная свеча должна открыться выше/ниже от трендовой свечи. То есть процент в пунктах от предыдущей.
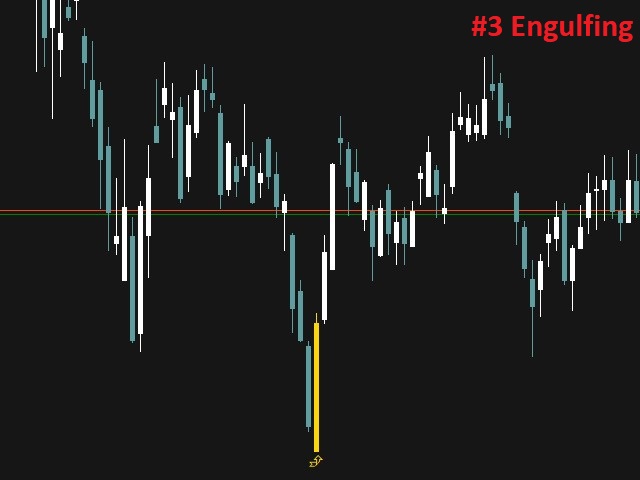
Параметры Engulfing:
- Quantity of directed bars: отображает количество направленных баров для дополнительного анализа.
- Ratio of the directed bars to the Engulfing : Указывает на отношение тела разворотной свечи к трендовой.
- Use shadows? – false/true. Переключатель. По дефолту = false. Что это? Этот параметр для принципа расчета паттерна. По дефолту трендовый бар должен полностью «поглощаться» разворотным именно телом. То есть тело+тени трендового меньше чем тело разворотного. Если же параметр = true, то тела двух фигур могут быть одинаковыми, но тогда приоритет будет именно на тени.
- Quantity of bars for analysis: позволяет произвести расчёт количества баров для определения локального максимума или минимума.
- Gap (%): Считает процент при котором разворотная свеча должна открыться выше/ниже от трендовой свечи. То есть процент в пунктах от предыдущей.
Индикатор отображает сигнал и алерт по закрытию свечи
Совет:
Рекомендую использовать дополнительные индикаторы из группы осцилляторов для подтверждения торгового сигнала. Также сигнал данного индикатора отлично работает с дивергенцией по AO или MACD.