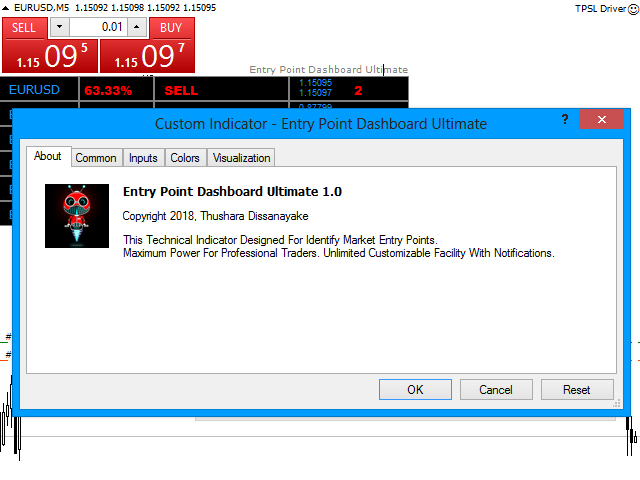
Entry Point Dashboard Ultimate
- Indicators
- Thushara Dissanayake
- Version: 1.0
- Activations: 20
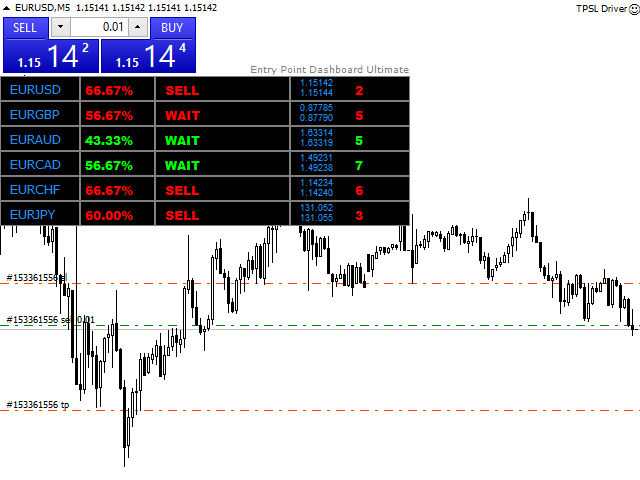
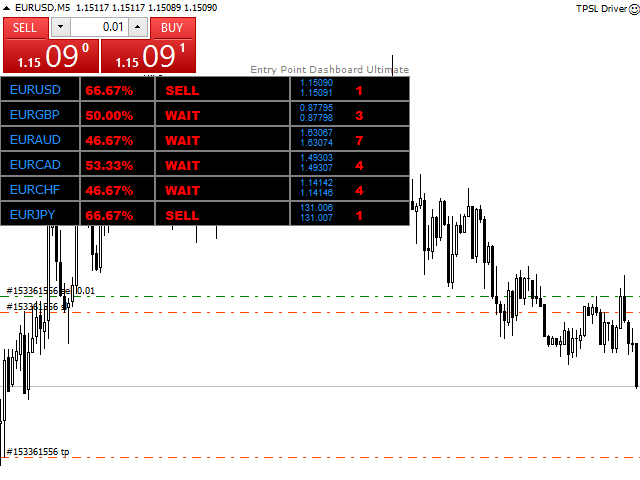
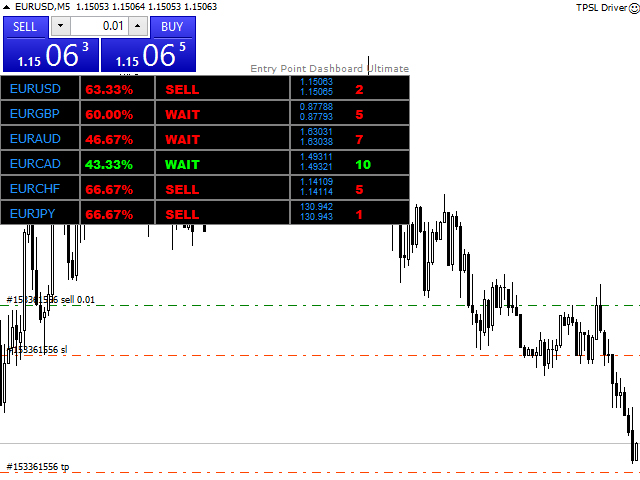
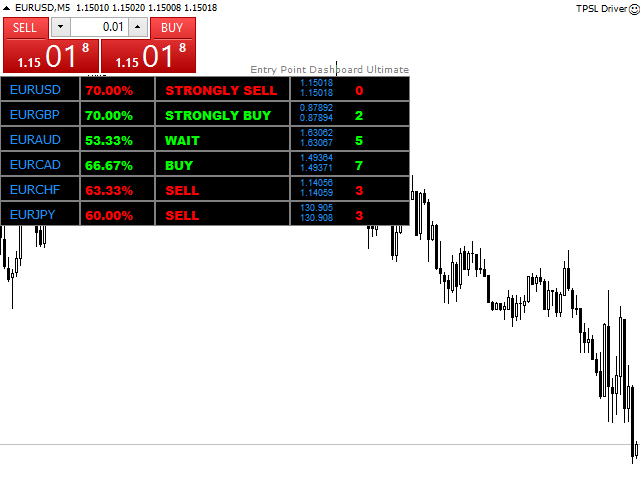
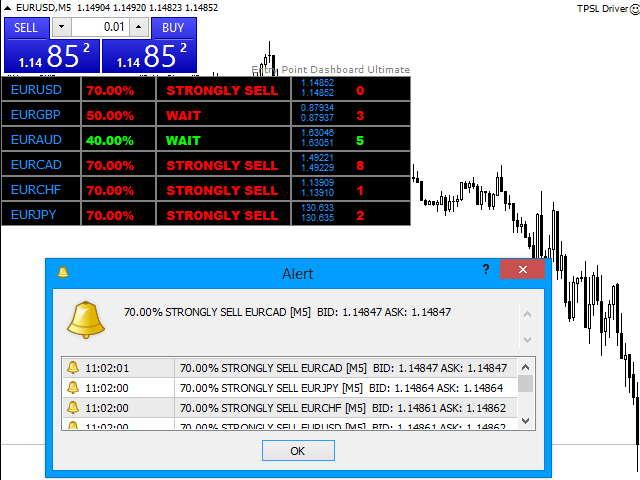
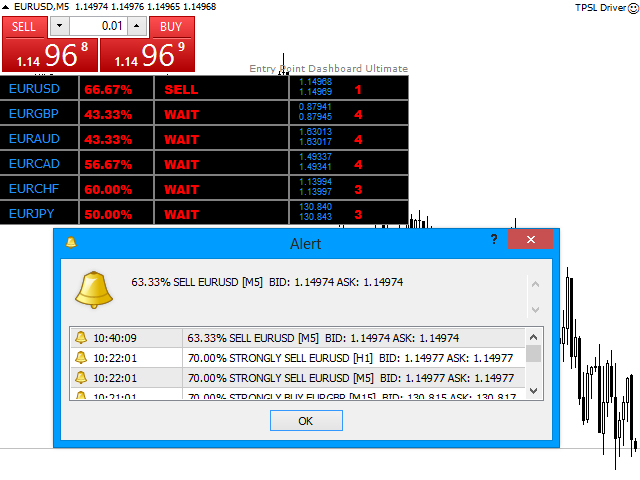
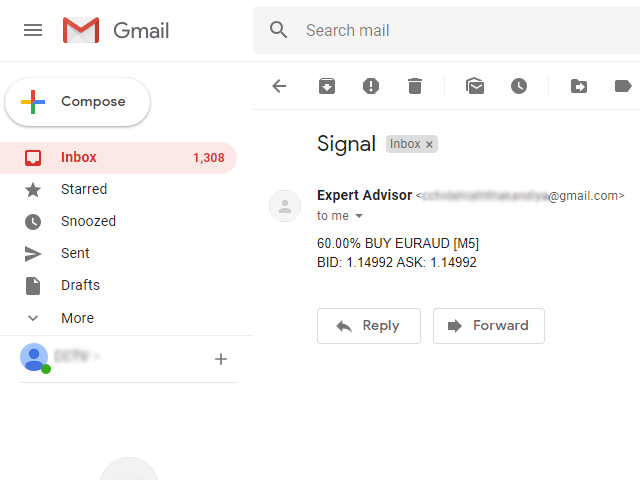
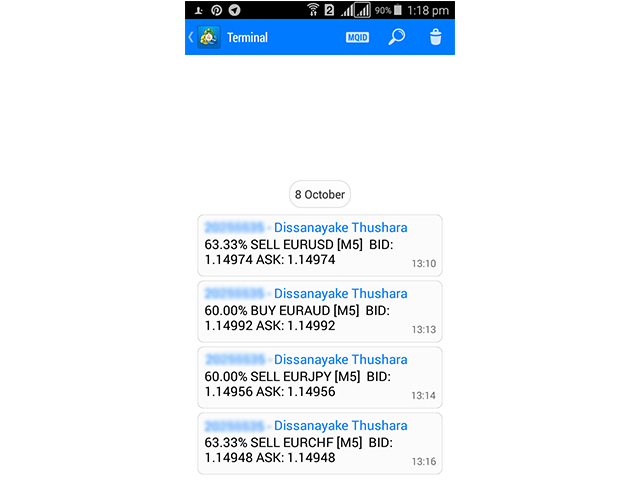
Introducing the Entry Point Dashboard Ultimate, a powerful technical indicator designed to provide Buy/Sell notifications for 6 currency pairs. This indicator analyzes 5 moving averages, CCI, RSI, Stochastic, Bill Williams, and volume indicators across 3 different time frames to generate accurate signals. It offers unlimited customization options for professional traders, allowing them to tailor the indicator based on their experience and strategies. The Entry Point Dashboard Ultimate sends signals to users via mobile devices, email, and pop-up alerts with sound.
The main signal of the indicator is determined based on the combination of signals from different time frames. For example, if M1, M5, and M15 all indicate a Sell signal, the main signal would be classified as Sell or Strongly Sell.
With a wide range of features, the Entry Point Dashboard Ultimate is a comprehensive tool for traders. It includes 6 popular indicators, enables analysis across 3 time frames, and offers a choice of 6 currency pairs for the dashboard. The indicator's parameters are user-friendly and fully customizable, allowing traders to align it with their own strategies. It is suitable for use with any symbol and time frame, providing flexibility in trading decisions.
The Entry Point Dashboard Ultimate swiftly indicates all signals and provides notifications through mobile devices, email, and pop-up alerts with sound. Users have the option to activate or deactivate each notification type based on their preferences.
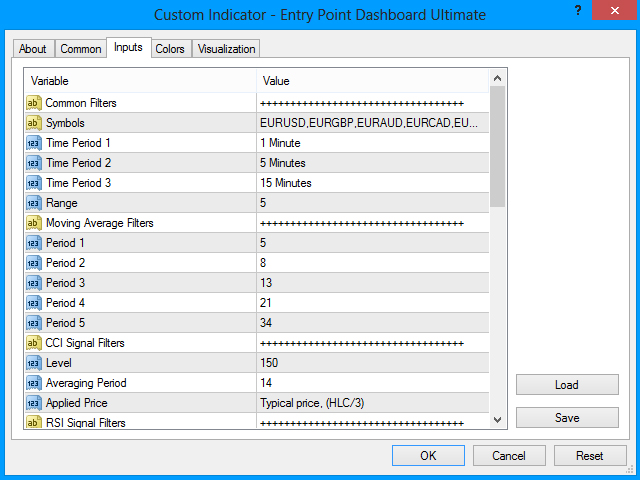
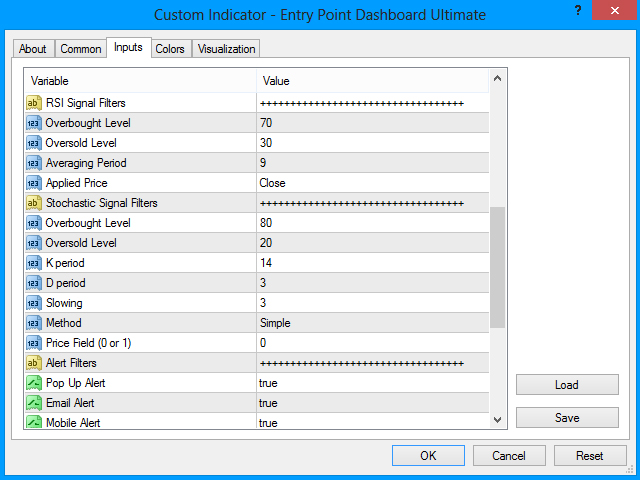
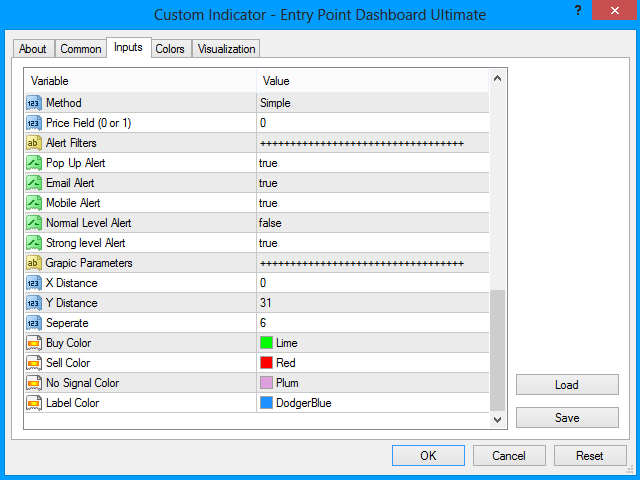
The indicator's parameters cover various filters for each indicator, including symbols, time periods, moving averages, CCI, RSI, and Stochastic signal filters. Alert filters allow users to activate or deactivate pop-up alerts, email alerts, and mobile notifications. Different levels of alerts are available for normal and strong signal levels.
In terms of graphic parameters, the Entry Point Dashboard Ultimate provides customization options such as X and Y distances for dashboard placement, columns for separating symbols, and color settings for buy signals, sell signals, and wait signals. Label colors can also be adjusted to meet individual preferences.
Overall, the Entry Point Dashboard Ultimate offers a comprehensive solution for traders seeking accurate signals across multiple currency pairs and time frames. With its user friendly interface and customizable features, this indicator enhances the trading experience and provides valuable insights for effective trading strategies.
Parameters
- Common Filters
- Symbols - Currency pair list.
- Time Period 1 - Lower time period for analyze indicator data.
- Time Period 2 - Normal time period for analyze indicator data.
- Time Period 3 - Higher time period for analyze indicator data.
- Range - Use candle data between [x] to 0 candle.
- Moving Average Filters - Filter signals using 5 moving averages.
- CCI Signal Filters - Filter signals using CCI indicator.
- RSI Signal Filters - Filter signals using RSI indicator.
- Stochastic Signal Filters - Filter signals using Stochastic indicator.
- Alert Filters - Customize alerts for specific conditions.
- Graphic Parameters - Customize visual appearance and colors.


Seller was very responsive to my questions and requests. He is a true professional. He helped me to understand how signals are generated. Good job !!