MACD Alert Series
- Indicators
- Eadvisors Software Inc.
- Version: 140.400
- Activations: 5
The Moving Average Convergence Divergence Indicator (MACD) is both a trend–seeking and momentum indicator which uses several exponential moving averages set to closing prices to generate trading signals.
We added several types of alerts to aid in your search for better opportunities in the market.Product Features
- Email Alert
- Sound alert
- Push Notification (Alerts can be sent to your mobile phone)
- Signs on chart
- Alert box
- Possibility to work with both histogram and visual line
- Alert on zero histogram cross or line sign cross.
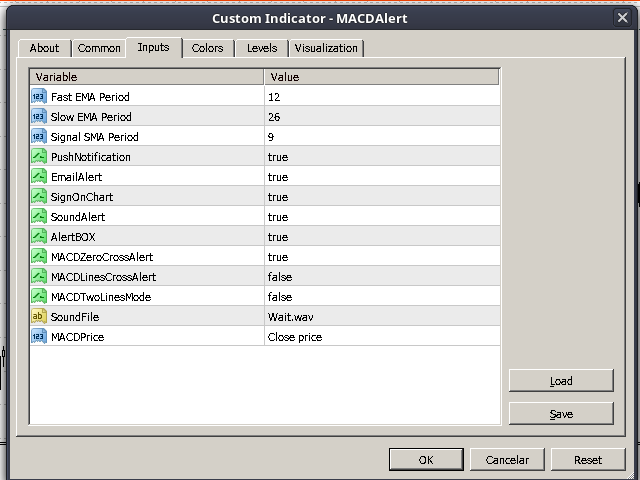
Indicator Parameters
- Push Notification - This option enables your MetaTrader 4 to send alerts to your smartphone (IOS or Android).
- Email Alert - Configure your alerts to receive in your e-mail address.
- SignOnChart - Enable drawing alerts on your chart.
- Sound Alert - Enable sound alert on cross or level mode.
- Alert Box - Enable simple alert box on events.
- UpLevelAlert / DwLevelAlert - Configure the range Max and Min of indicator level to alert you.
- LevelAlert - Enable alert on crossing the levels configured above.
- SoundFile - File that you like to play on sound alert mode.
- MACDZeroCrossAlert - Enable alert on zero line cross indicator.
- MACDLineCrossAlert - Enable alert on Line x Sign cross indicator.
- MACDPrice - Possibility to change price type used on indicator calc.