DYJ T3ModeMA
- Indicators
- Daying Cao
- Version: 1.46
- Updated: 20 January 2024
- Activations: 5
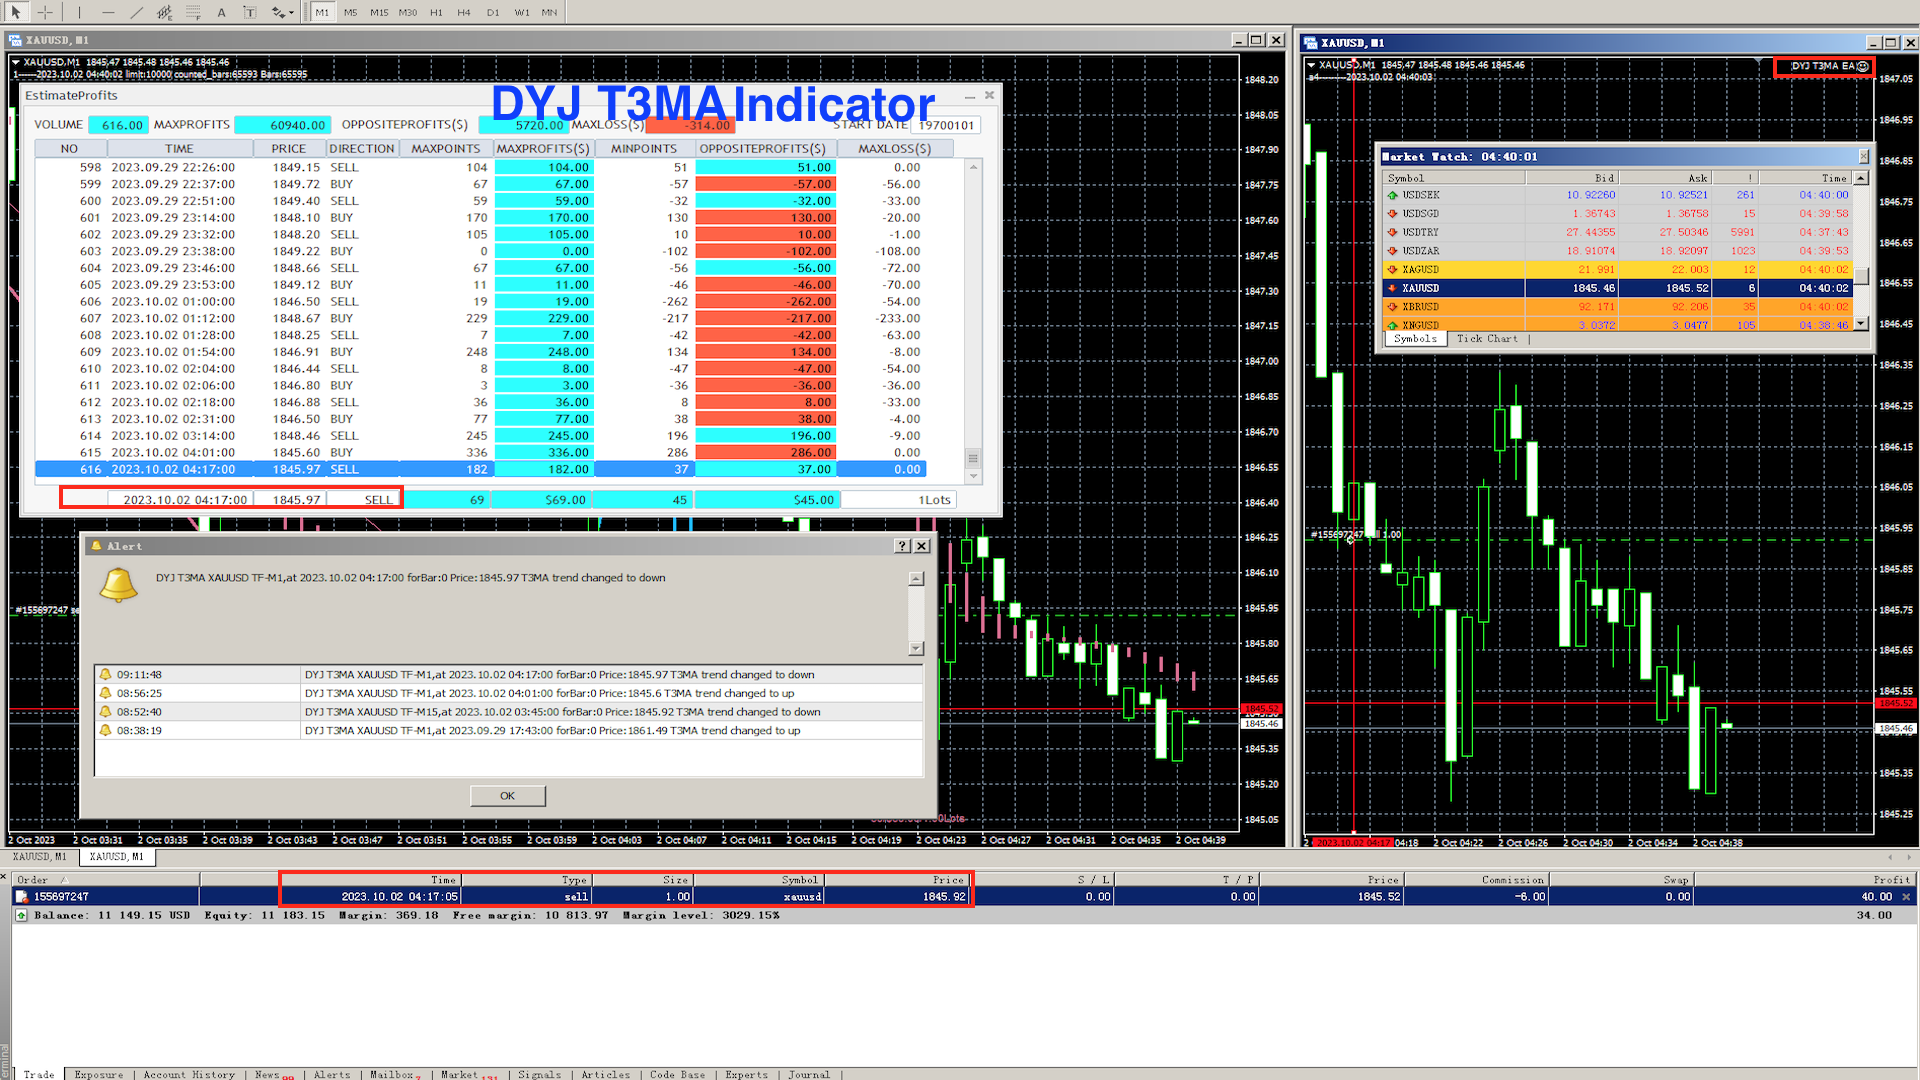
DYJ T3ModeMA is based on T3 algorithm.
T3 algorithm is technically analyzed in the article Better Moving Averages published in TASC magazine.
T3 can smooth the price line and reduce the lag of trend tracking.
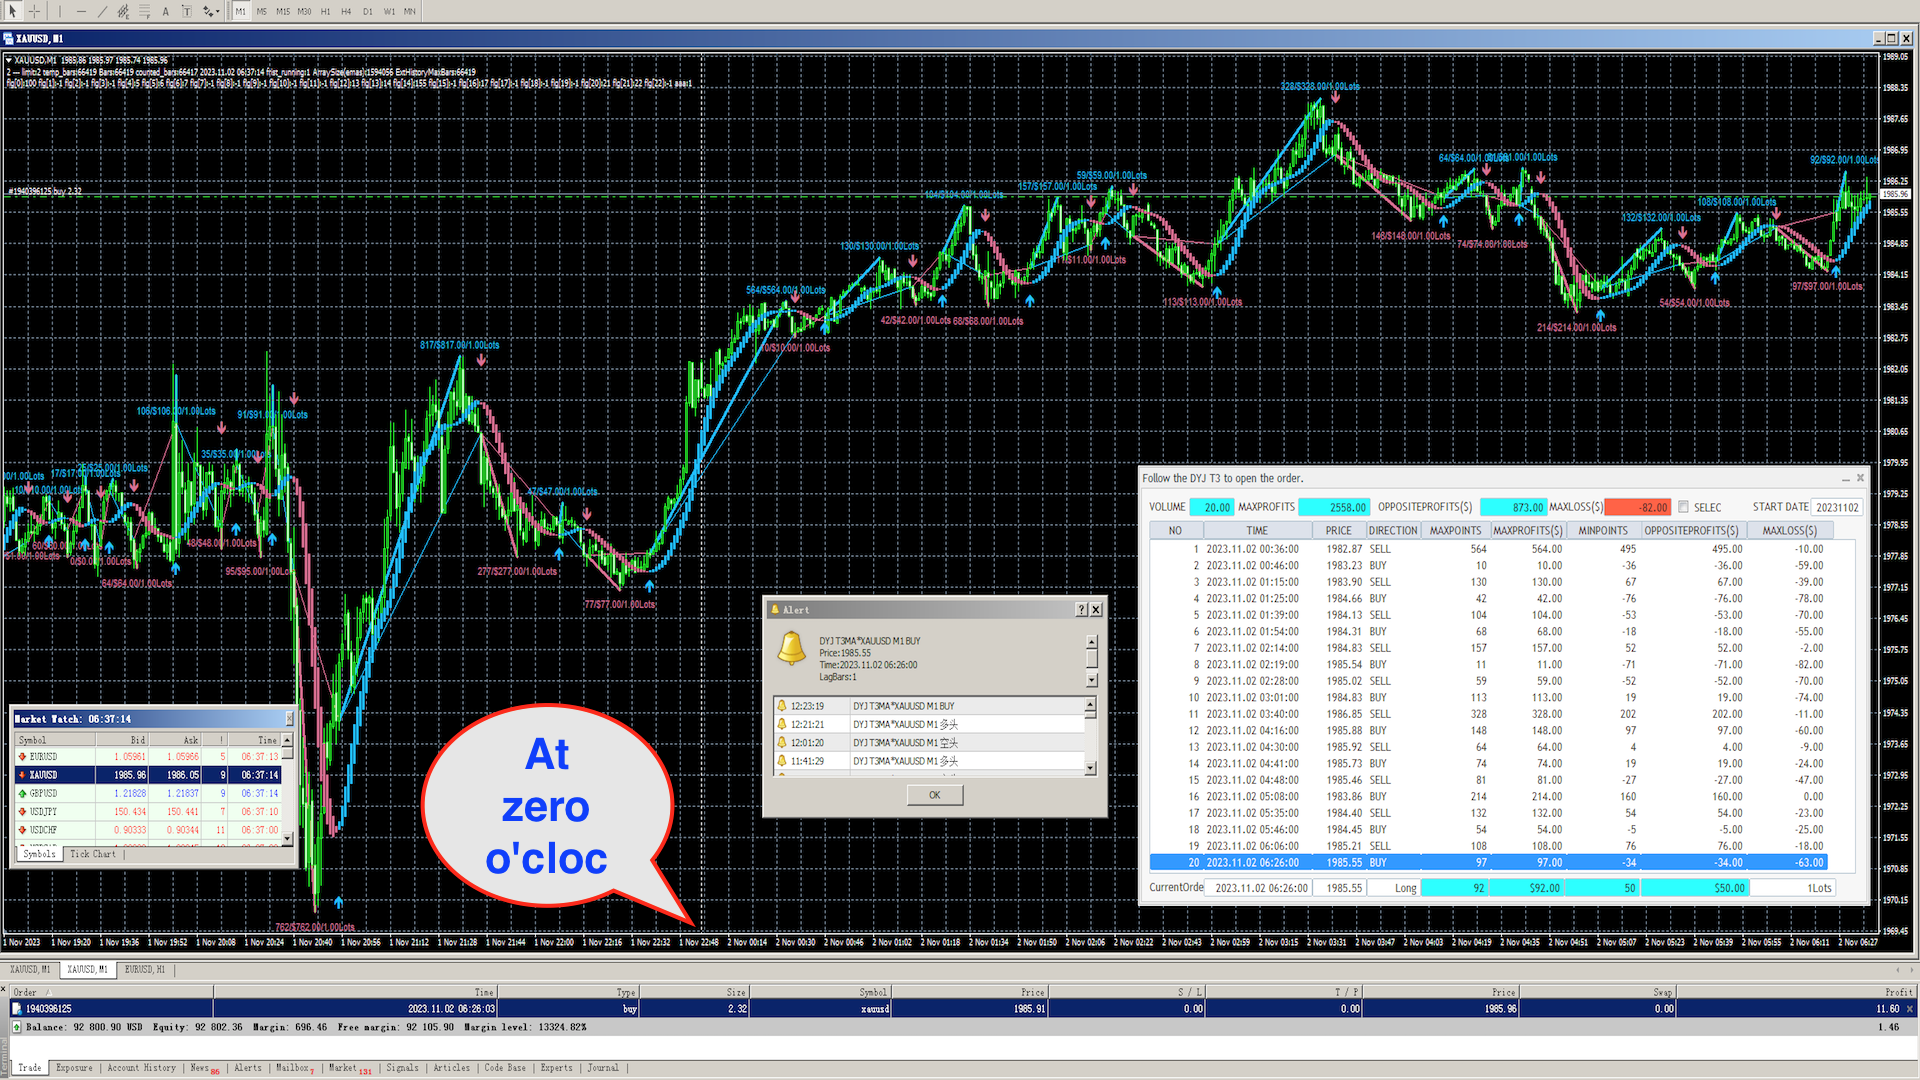
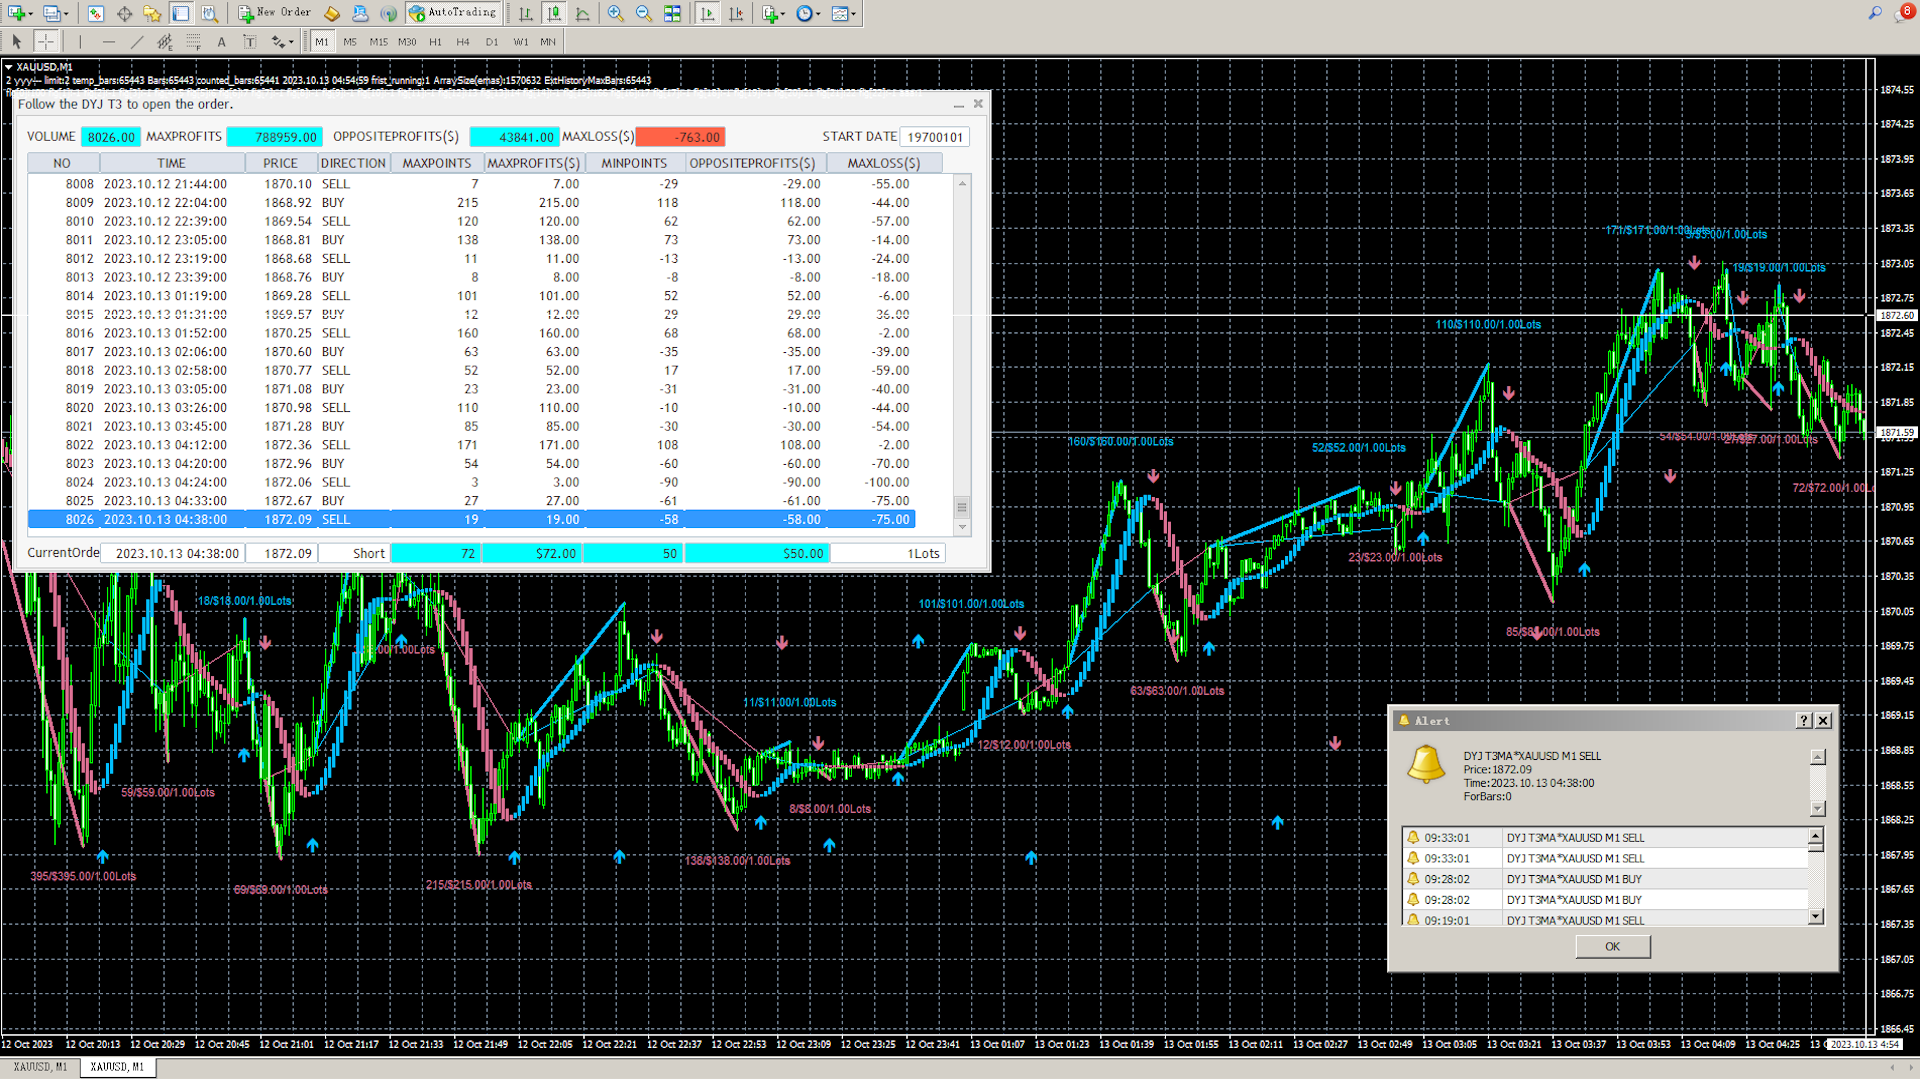
The indicator uses analog trading technology,
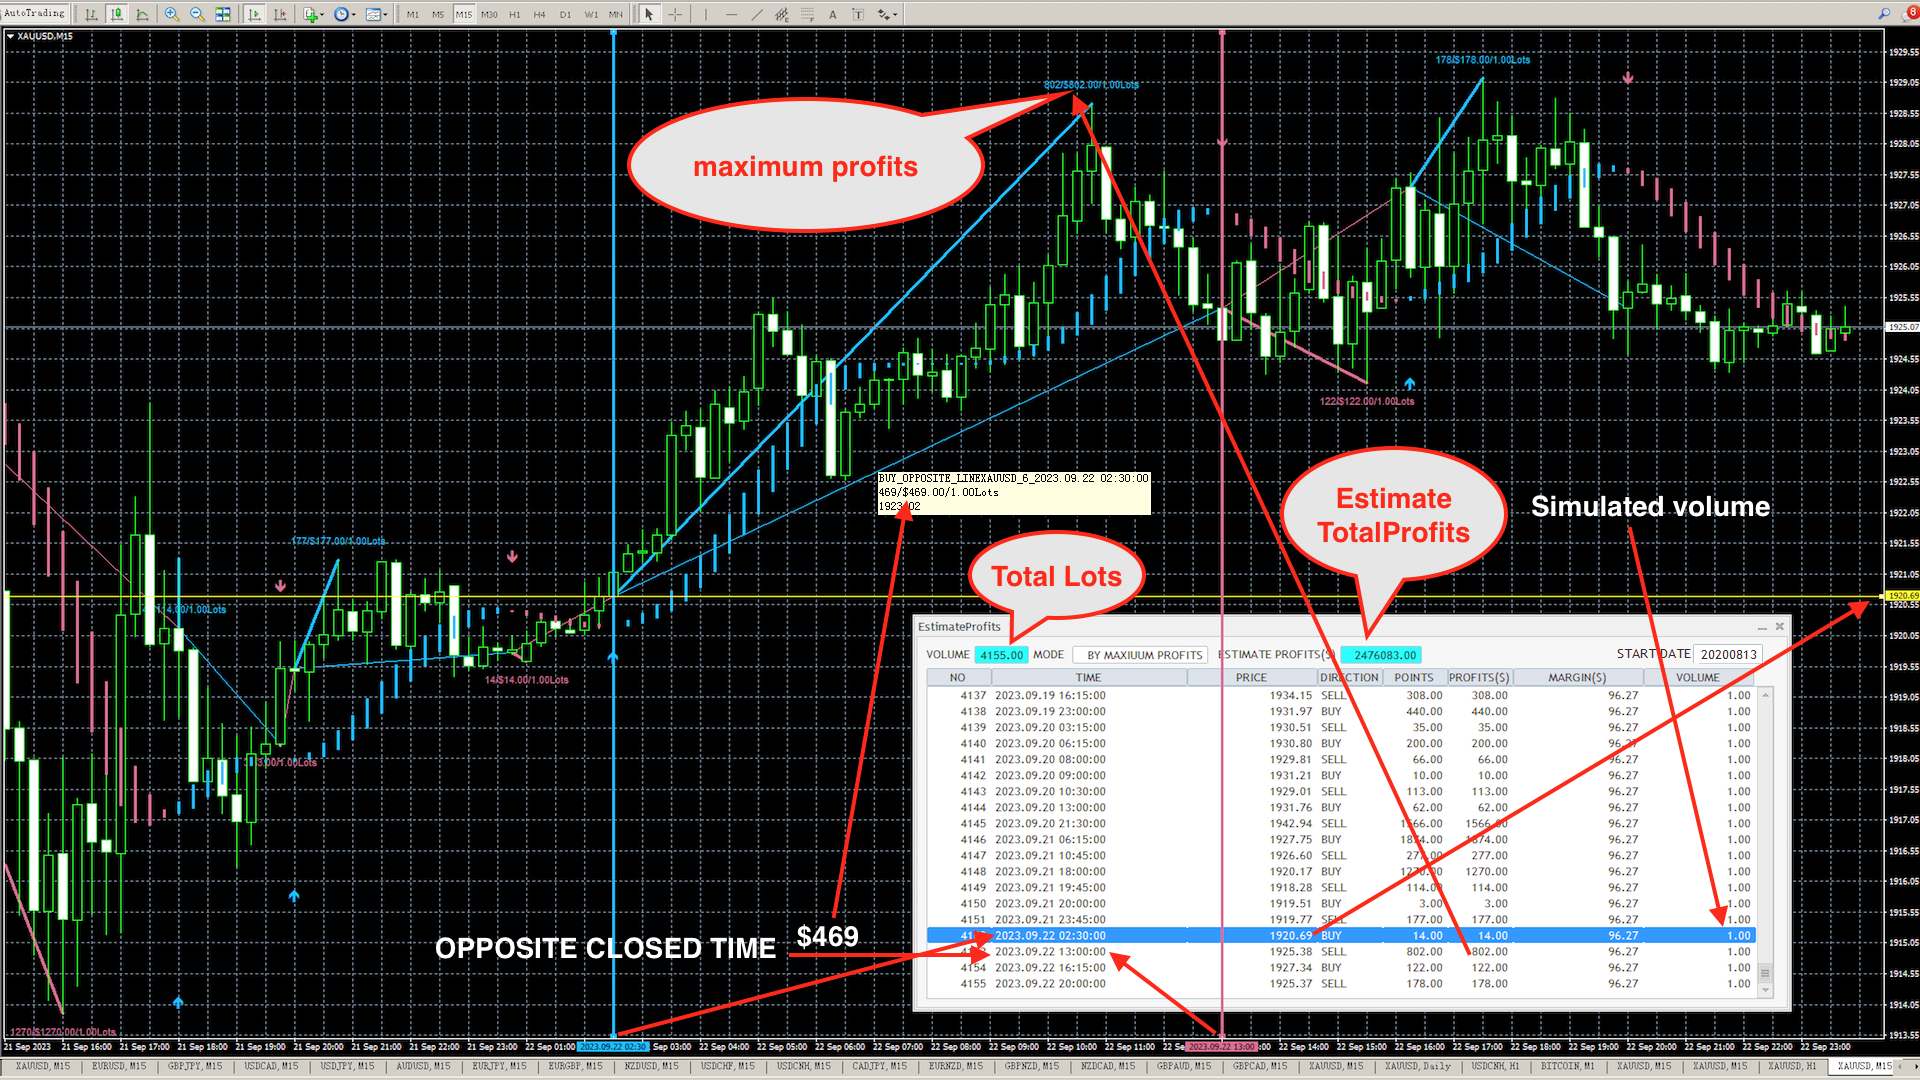
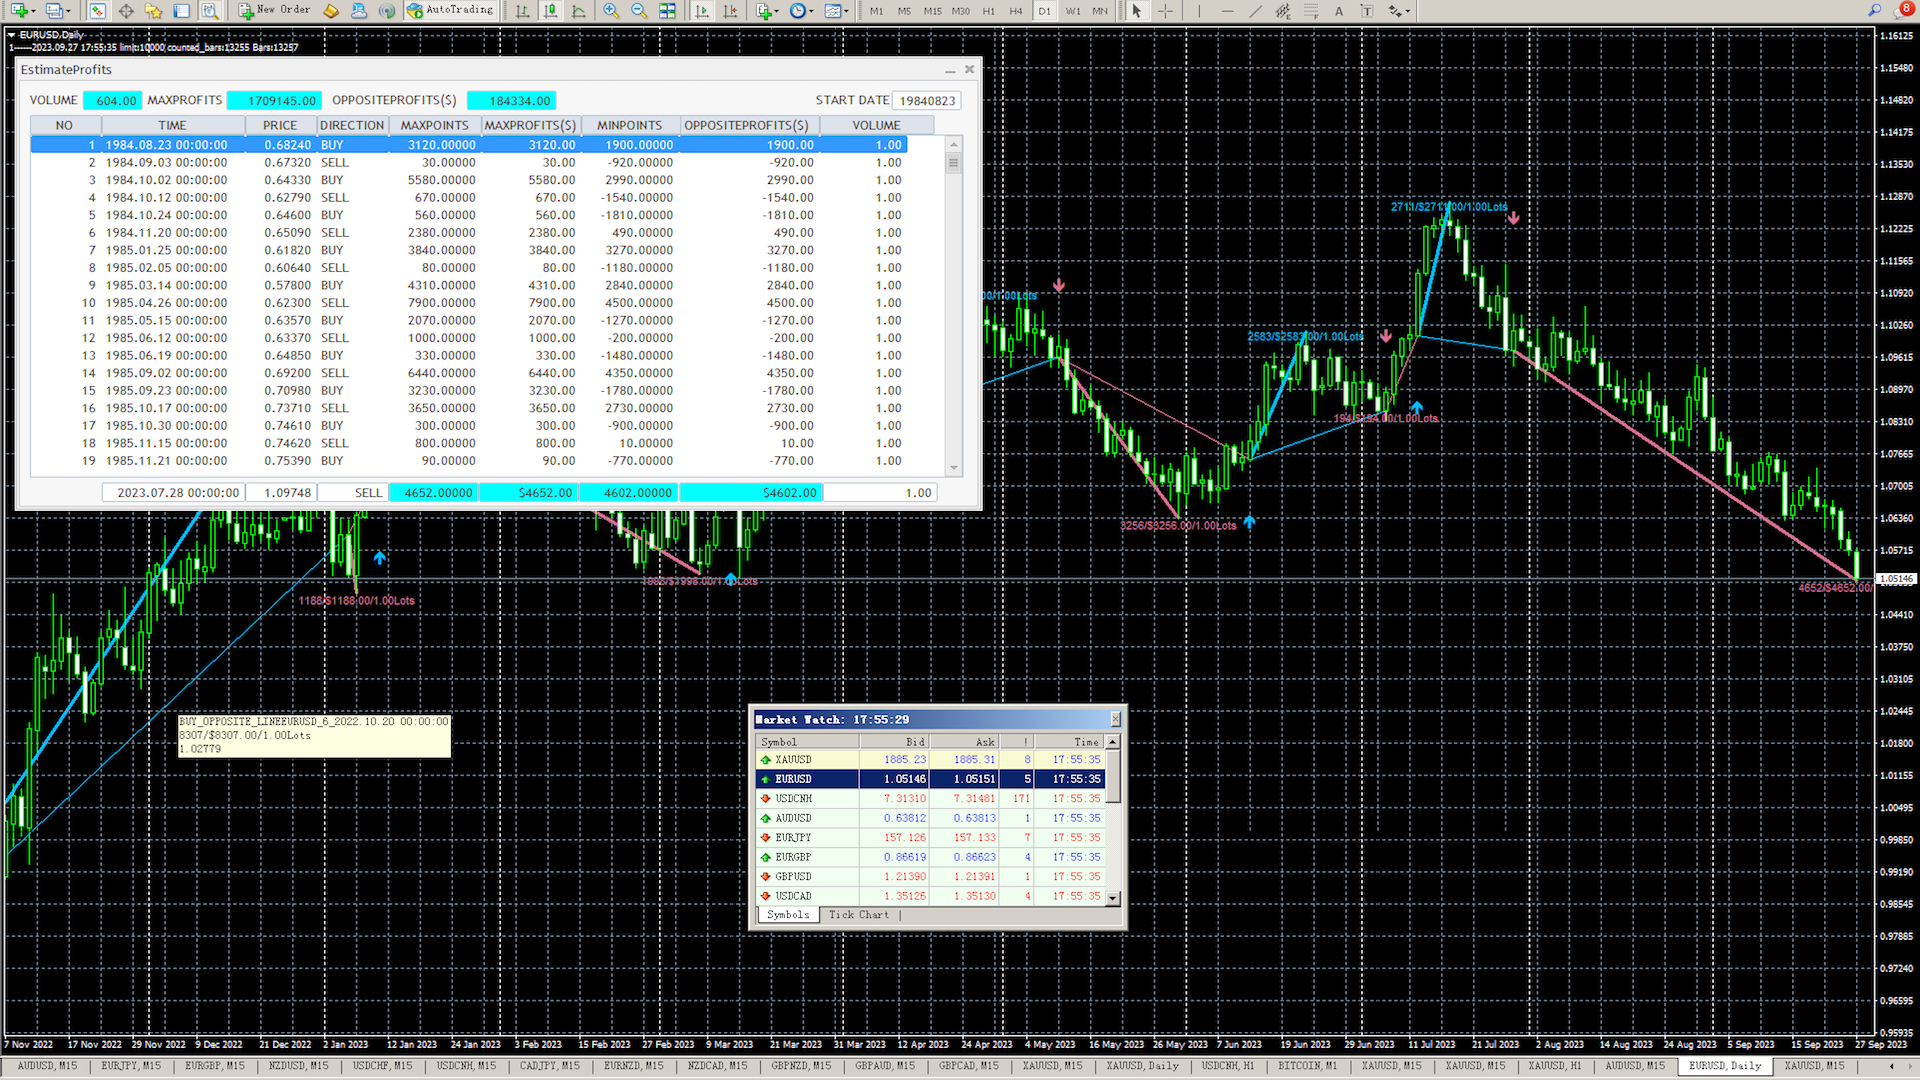
Provide you with indicators to evaluate the overall profit of the opening signal and closing signal.
It is very convenient for you to use which evaluation mode to trade.
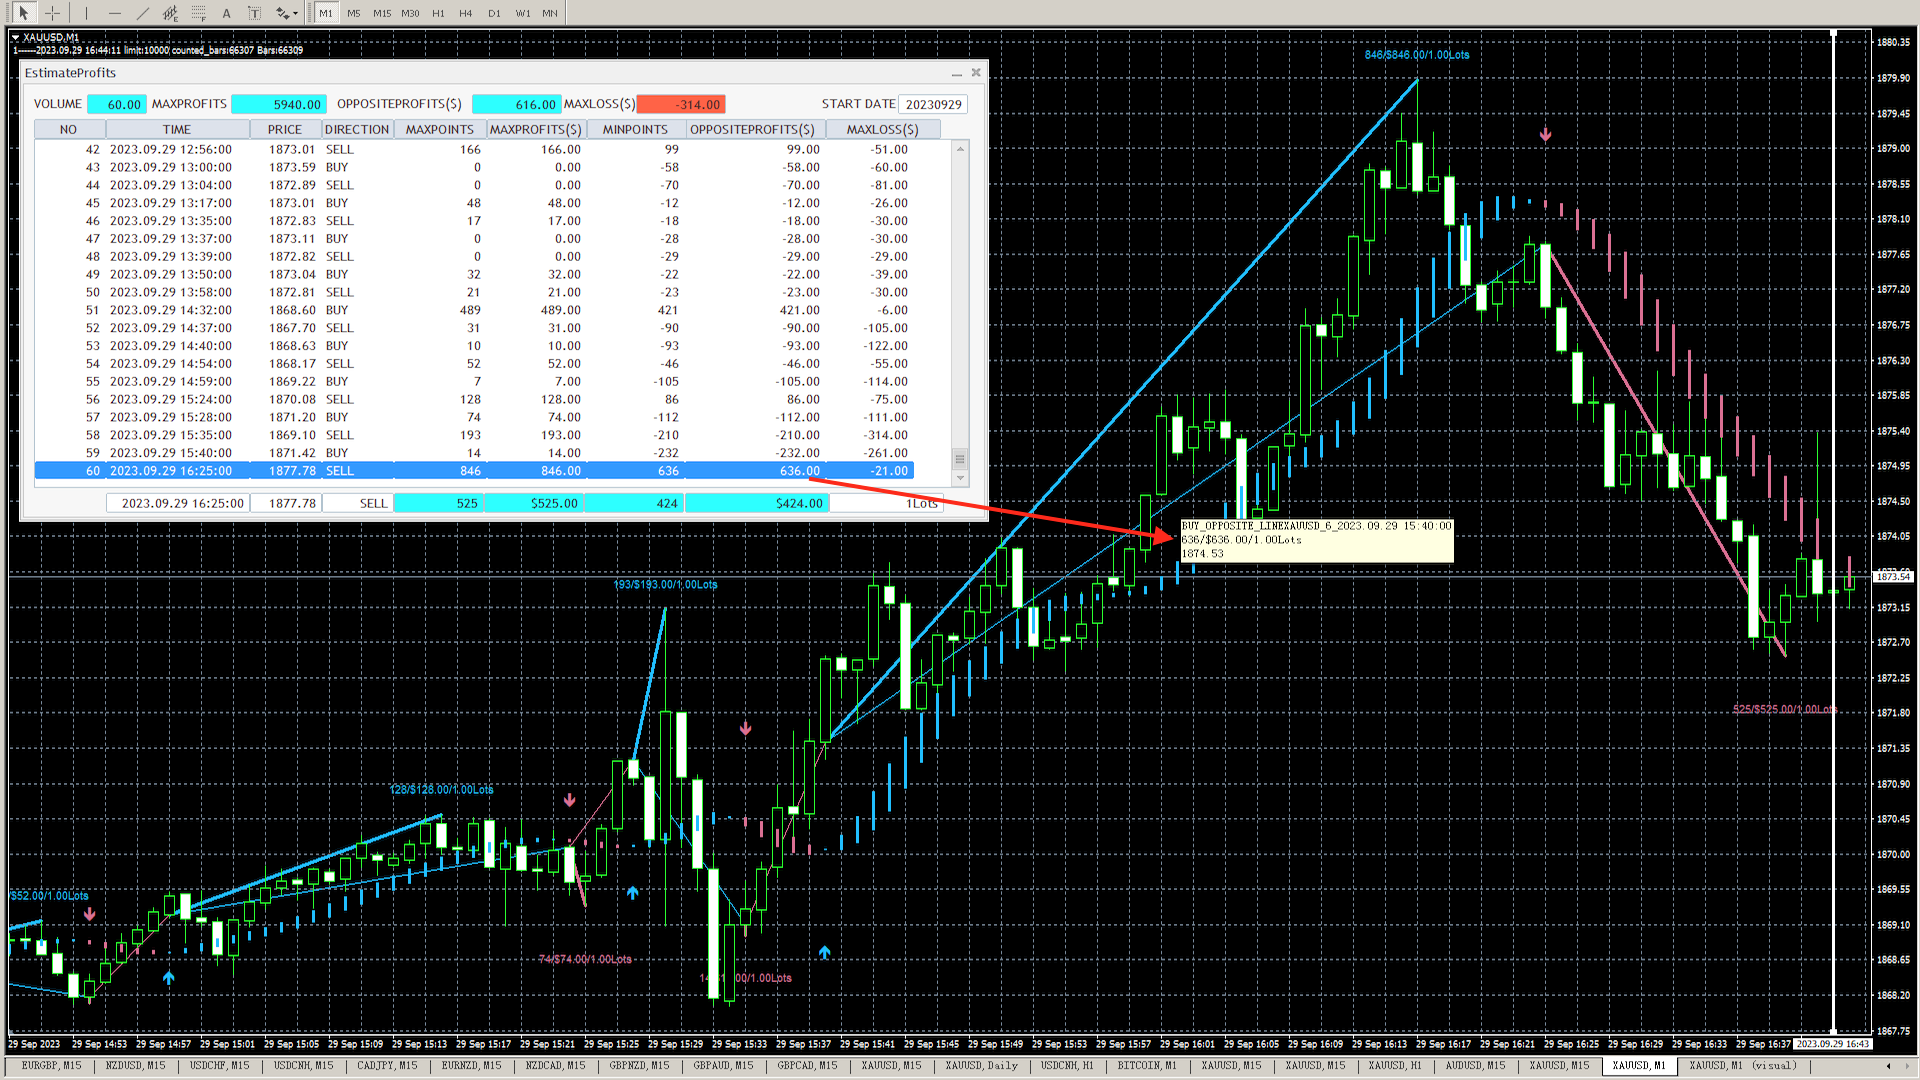
When you choose the maximum profit model evaluation model,
It is recommended that you use the tracking stop loss function.
This can track the trend profit to the maximum extent.
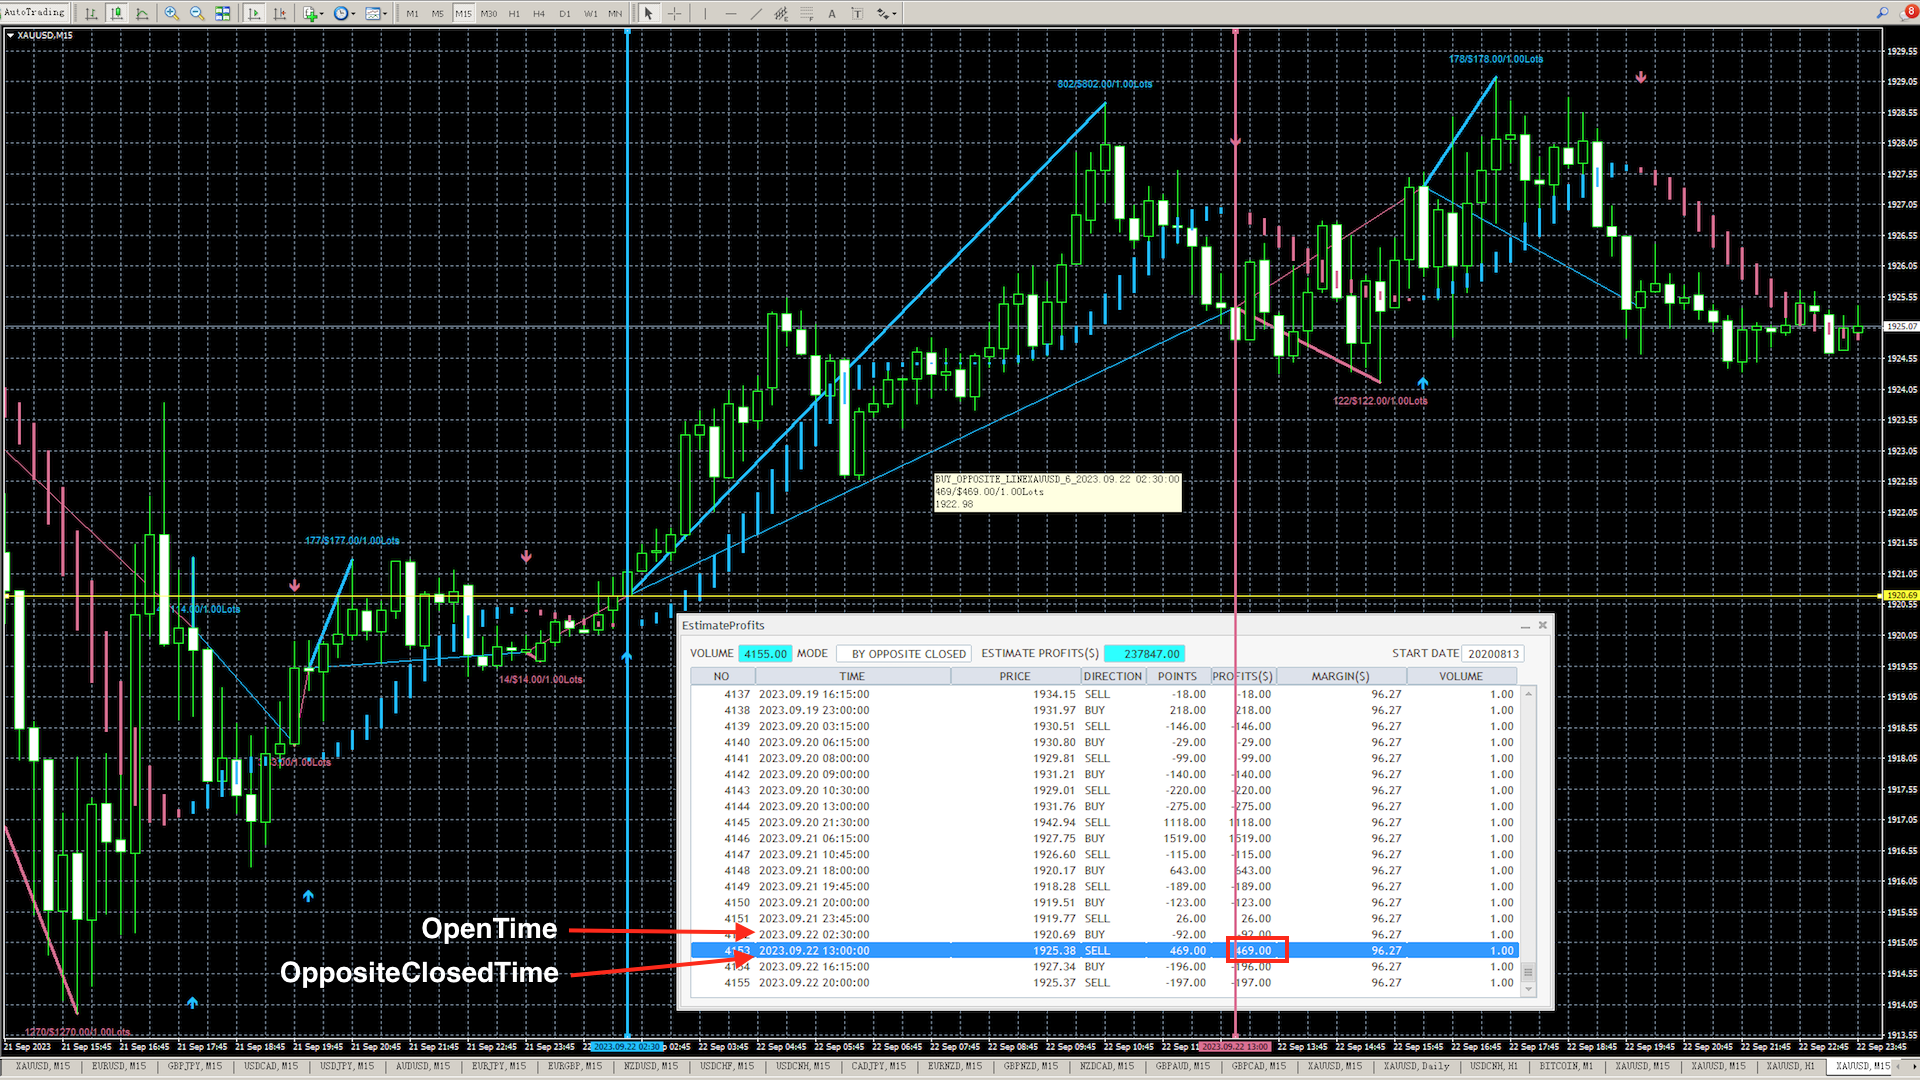
When you select the opposite signal to turn off the evaluation mode,
It is recommended that you wait patiently for the opposite signal to appear and then close it.
This can always wait for the trend to really end and make a profit.
If you need to automatically follow the index to open and close the warehouse, please download the utility software DYJ Follow Me.
Input
[Indicator]
InpMaPeriod = 6 -- MA Period
InpT3Period = 9 -- T3 algorithm period
InpT3Hot = 0.70 -- T3 Polynomial coefficient
InpShowArrows = true
InpAlertsOn = true
ArrowUpClr = DeepSkyBlue -- Arrow Up Color
ArrowDnClr = PaleVioletRed -- Arrow Down Color
InpIsDisplayIndicatorLine = true -- Display Line Of Indicator
[EstimateProfits]
InpSimulatedVolume = 1 -- SimulatedVolume . 0.01Lots or more
InpOnlyOppositeClosedLine = false -- Only the OppositeClosed line is displayed.
InpIsDisplayChartText = true -- Hide All Text Of Chart
InpIsDisplayProfitsLine = true -- Hide All Line Of Chart
MaxProfitsTextHigh = 40 -- Maximum profit label height
MaxProfitsTextLow = 20 -- Minimum profit label height(opposite)
InpIsEstimateDialog = true -- Hide Or Show EstimateDialog
InpModeProfits = ByMaxProfits -- ByMaxProfits or ByOppositeClosed
InpStartDate = "19700101" -- Statistical start date