• Overview
  • Reviews
  • Comments (40)
  • What's new

Three MA Alert

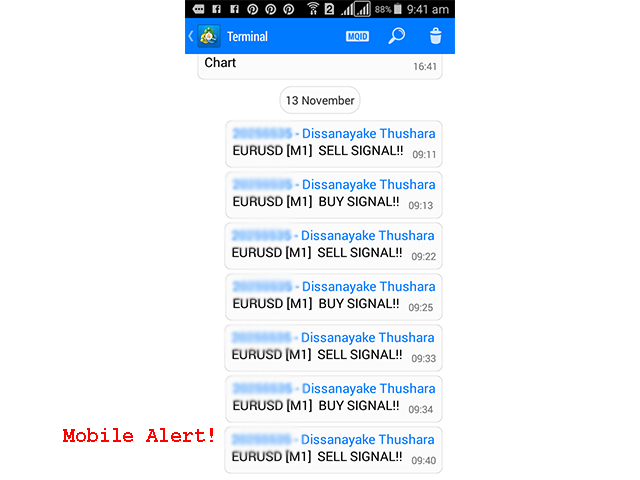
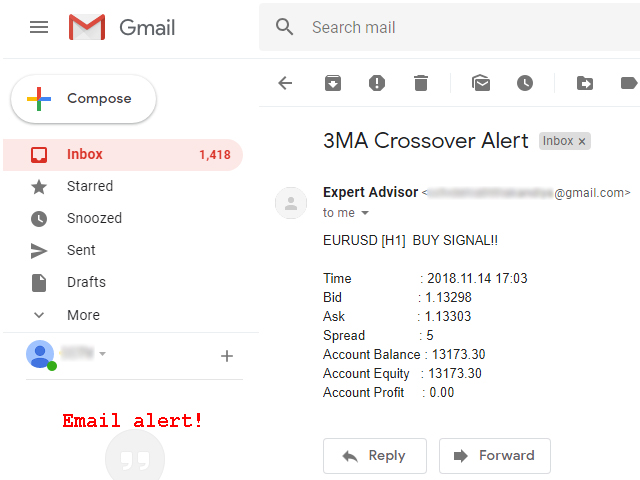
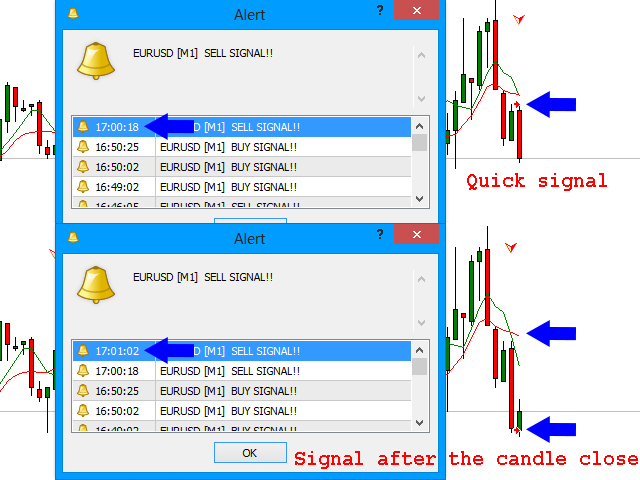
The Three MA Alert indicator is an essential tool for traders who rely on the Moving Averages Crossover Strategy. It simplifies your trading life by sending notifications to your mobile device, email, and displaying pop-up alerts with sound whenever there is a crossover of three moving averages. By following this widely used technique, you can ensure that you are always on the right side of the trend and avoid trading against the prevailing market direction.

With the Three MA Alert indicator, you no longer need to sit and wait for moving average crossovers. You can spend quality time with your family or engage in other activities while waiting for the notification to arrive on your mobile device and play a sound alert. The indicator's default settings are perfectly suitable for timeframes of 30 minutes and above, particularly for the EUR/USD currency pair.

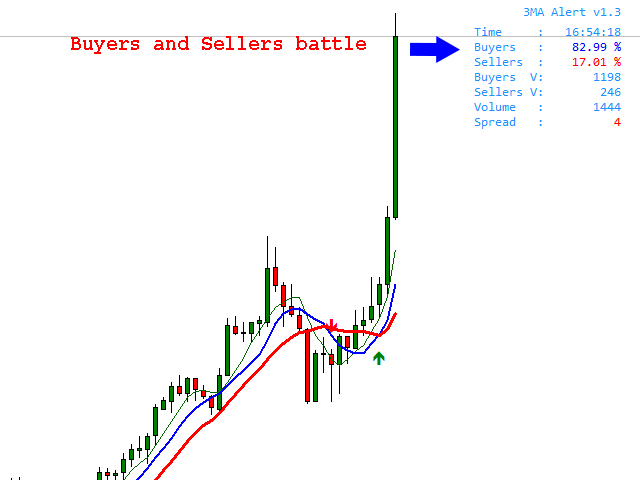
An amazing and valuable feature of this indicator is its ability to grab real volume information of each candle. It calculates the battle between buyers and sellers as a percentage of the total volume and displays it on the chart. This information is instrumental in confirming breakouts, identifying trends, and recognizing potential reversals before entering a trade.

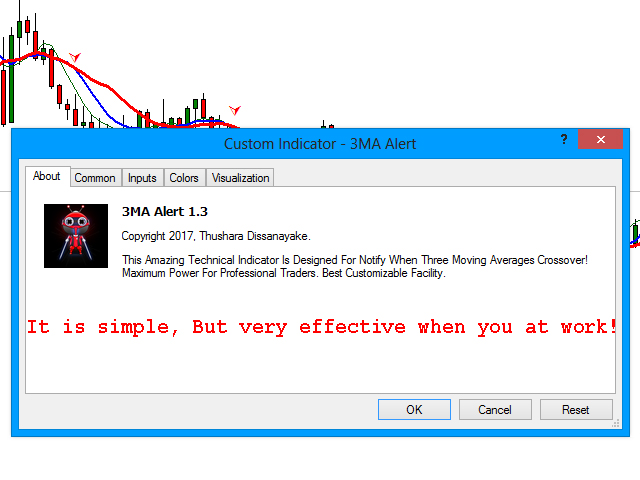
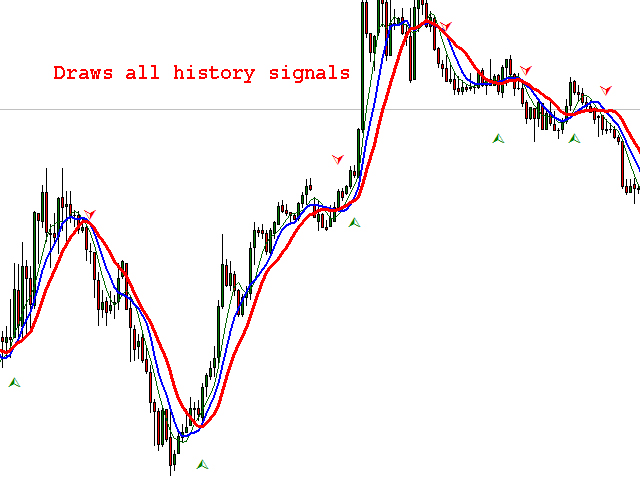
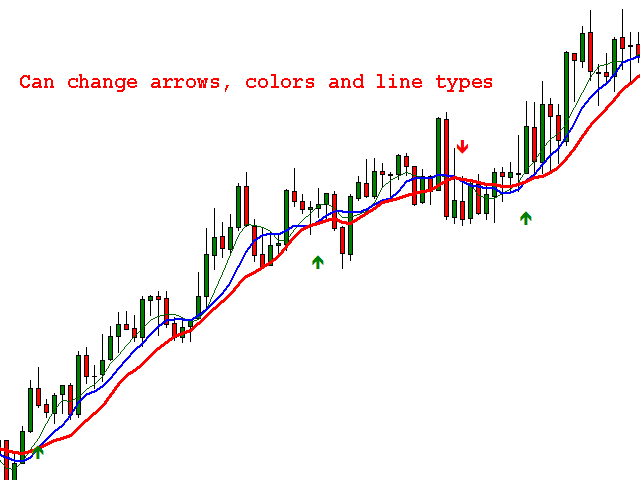
The indicator offers several noteworthy features to enhance your trading experience. It provides comprehensive notifications that include essential details such as the time frame, signal, bid and ask prices, spread, account balance, equity, and profit. You have the flexibility to activate or deactivate each notification method according to your preference. Additionally, the indicator quickly draws signals on the chart, allowing you to visually identify crossover events. Customization options such as font, font size, and color are available to ensure a better view and personalized appearance.

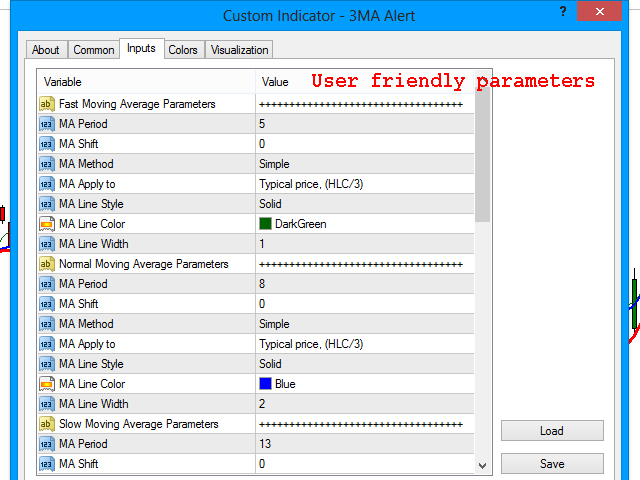
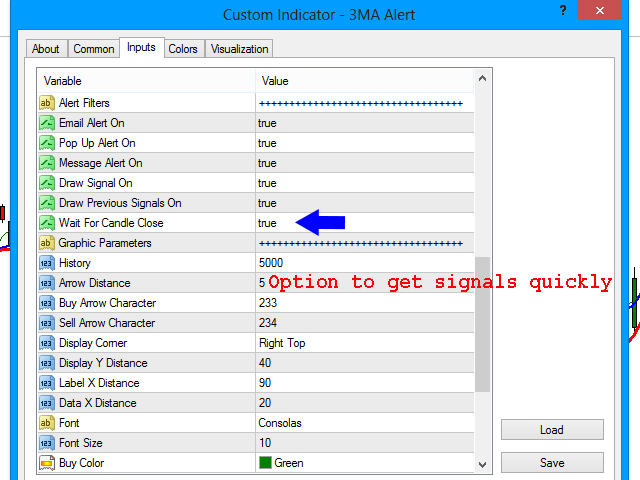
The parameters of the indicator can be adjusted to meet your specific requirements. You can set the moving average periods, choose from different smoothing methods, and define the applied price constants. The indicator also allows you to customize the style, color, and width of the moving average trend lines. Alert filters provide control over email alerts, pop-up message alerts, mobile push notifications, and drawing arrow signals on the chart. There is an option to delay notifications until the candle is closed, ensuring accuracy in signal generation.

Graphical parameters allow you to determine the number of bars to display for history data and the distance of the arrows from the candle's high or low. You can choose characters for buy and sell signals, specify the display corner and distances, and customize the font and size of the information panel. The colors of arrows, labels, and volume display can be adjusted to your liking.

In summary, the Three MA Alert indicator is a powerful tool that streamlines your trading process by providing timely notifications and valuable insights derived from moving average crossovers. It empowers you to make informed trading decisions, follow market trends, and capitalize on profitable opportunities.


    Parameters

    • Moving Average Parameters - Customize Moving Average indicator for specific conditions.
      • Alert Filters - Customize alerts for specific conditions.
      • Graphic parameters - Customize visual appearance and colors.
      Recommended products
      Oscillator helps determine the direction of the market Shows the direction of the price movement and is painted in the appropriate color. Allows you to conduct trend and counter trend trading It works on all timeframes, on any currency pairs, metals and cryptocurrency Can be used when working with binary options Distinctive features Does not redraw; Simple and clear settings; It works on all timeframes and on all symbols; Suitable for trading currencies, metals, options and cryptocurrency (Bitco
      Waves Follower
      Mihails Babuskins
      Contact me after payment to send you the User-Manual PDF File. This indicator gives a signal when the probability of starting a trend is high. To calculate entry points, it uses a combination of some indicators like "Moving Average", "ADX", RSI with support and resistance points. This indicator is a trend follower and it doesn't determine that TP because it is not necessary, it uses the stop-loss trailing system (Of course, the indicator determines the SL, but you have to move it yourself becau
      Awesome Oscillator by Bill Williams with the ability to fine-tune and replace the averaging algorithms of the indicator, which significantly expands the possibilities of using this oscillator in algorithmic trading and brings it closer in its properties to such an indicator as the MACD. To reduce price noise, the final indicator is processed with an additional Smooth averaging. The indicator has the ability to give alerts, send mail messages and push signals when the direction of movement of th
      BreakoutSR shows you possible breakouts for current/following day . With integrated Support and Resistance lines and a menu you have a better overview of the chart. If the candle closes above "LONG" go long , if the candle closes below "SHORT" go short . Same is for SHORT/LONG Breakouts. Quick and easy to understand - tool, perfect for all types of traders. BreakOutSR Inputs MT4 Alert - Alerts you on ur MT4 Terminal Broker GTM - your Broker GTM BreakOuts: Draw Breakouts - Draw the Breakout lin
      Analyzing multiple time frames of a currency pair in one window can make you confused. To analyze multiple time frames, you need reliable indicators. One of them is using 9TF STOCH RSI . I've been working day and night to create code that is simple but reliable and covers all nine time frames in just one indicator .  Let's look at some of the advantages of this indicator: Colorful histogram . The color of the curve in each timeframe is different from one another.  Arrows indicating the crossing
      Cloud Power
      Andriy Sydoruk
      Implementation of indication of trend movement with moments for potential stops in the Cloud Power indicator. The transition to the shadow warns of a possible reversal. The entry of the price inside the shadow speaks of a flat movement. The indicator tracks the market trend with unmatched reliability, ignoring sharp market fluctuations and noise around the average price. Simple, visual and efficient use. The indicator does not redraw and does not lag. It can be easily used as an independent
      This EA is an extension for the free trade indicator Trend Mate . https://www.mql5.com/en/market/product/50082 The main idea is to support your decision to  trade  according to the current trend. It is possible to configure alert and push notification to receive when entering to first candle for bull / bear trend. For this extension of the free indicator now it is possible to filter the current trend info with other timeframes. For example show trend for timeframe M5 considering also timefra
      Analyzing multiple time frames of a currency pair in one window can make you confused. To analyze multiple time frames, you need reliable indicators. One of them is using 9TF STOCH RSI LIMITED BAR . I've been working day and night to create code that is simple but reliable and covers all nine time frames in just one indicator .  Attention! When first installed, the indicator does not look intact. Changing the timeframe will solve the problem. Let's look at some of the advantages of this indicat
      Multiphase
      Ivan Simonika
      Multiphase is a non-redrawing channel indicator based on moving averages. The key difference between the Multiphase indicator and other channel indicators (for example, from the same Bollinger Band) is that Multiphase takes into account not simple moving averages, but double-smoothed ones, which, on the one hand, makes it possible to more clearly determine the market movement, but, with on the other hand, it makes the indicator less sensitive.
      This Indicator will notified you when time to entry into the market, build with double william percent range strategy.  --> Buy Notification will flag with the blue arrow --> Sell Notification will flag with the red arrow After Flag Appear, the market usually explode but carefully you must performs double check because weakness of this indicator when in the end of the trend
      Support And Resistance Screener is in one level indicator for MetaTrader that provide multiple tools inside one indicator. The available tools are :  1. Market Structure Screener. 2. Bullish Pullback Zone. 3. Bearish Pullback Zone. 4. Daily Pivots Points 5. weekly Pivots Points 6. monthly Pivots Points 7. Strong Support and Resistance based on Harmonic Pattern and volume. 8. Bank Level Zones. Key Features All in one level indicator. All types of alerts ( Pop-up alert, puss notification aler
      Ophiuchus Paid Version
      Limitless Trading Enterprise
      4.4 (10)
      Ophiuchus is the 13th zodiac and it is also the name for this EA as   13   is the key elements for this trading strategy. Trading Strategy The following are the main characteristic of this EA. Martingale based strategy. Only open more trades when it is on the right direction. earn small profit for each trades but a lot of volume everyday. Profit from the volatility of the market. Tested and Proved to be able to profit on EURUSD trading with M1 timeframe. Back Test Result Back test result are
      An indicator of patterns #45 and #46 (Three Falling Peaks and Three Rising Valleys) from Encyclopedia of Chart Patterns by Thomas N. Bulkowski. Parameters: Alerts - show alert when an arrow appears   Push - send a push notification when an arrow appears (requires configuration in the terminal) PeriodBars - indicator period K - an additional parameter that influences the accuracy of pattern shape recognition. The smaller the value is, the smoother the row of peaks/valleys should be, so fewer patt
      FIBOChannels
      Hafis Mohamed Yacine
      Fibonacci Channel What is a Fibonacci Channel? The Fibonacci channel is a technical analysis tool that is used to estimate support and resistance levels based on the Fibonacci numbers. It is a variation of the Fibonacci retracement tool, except with the channel the lines run diagonally rather than horizontally. It can be applied to both short-term and long-term trends, as well as to uptrend and downtrends. Lines are drawn at 23.6, 38.2, 50, 61.8, 78.6, 100, 161.8, 200, 261.8, 361.8 and 423.6
      Mongol Indicator2
      Sumiyabazar Buyanjargal
      It's a variation of mid of HH and LL since it compares the higher of HH or LL against a period and twice the number of bars back to avoid whipsaws. I used to display this against lines on a chart, but made a histogram out of it and it looks interesting. It looks good at gauging trend strength and general turns (see image below). The name of the indicator is BAM, which is an acronym for "Below and Above Mid". Ways to use it: 1. To see general trend on longer TFs (more than 30 ba
      The Market Structures Pro indicator finds and displays 5 (five) patterns of the Smart Money Concepts (SMC) system on the chart, namely: Break Of Structures (BoS)       Change of character (CHoCH) Equal Highs & Lows Premium, Equilibrium and Discount zones with Fibo grid High-high, Low-low, High-low and Low-high extremes Patterns are displayed for two modes - Swing and Internal and are easily distinguished by color on the chart. Internal mode features higher contrast colors, finer lines, and sm
      Rira Renko
      Vitor Palmeira Abbehusen
      RENKO on Time Chart This indicator is an enhanced Renko, so you can watch the Renko bricks on the chart to understand price movement more clearly the other improvement is automated box size according to ATR (Average True Range) period you can set the ATR number as you want and the box size of Renko changes automatically based on price movement Inputs Mode: Box size is the input to specify the size of the Renko box you want to print on the chart. This input lets you choose the fixed b
      Introducing Daily Hedge - Your Advanced Custom Hedge System for Forex Trading Unleash the Power of Daily Hedge - Your Ultimate Trading Companion Experience the next level of trading sophistication with Daily Hedge, an advanced custom hedge system designed to revolutionize your Forex trading experience. With its cutting-edge features and intelligent algorithms, Daily Hedge empowers you to make informed decisions and seize profitable opportunities like never before. Unlocking Advanced Trading Str
      This indicator shows the current market situation relative to the price volatility channel, its external and internal boundaries, displays the last direction of the price movement. The main purpose of the indicator is to identify the trend movement and its boundaries. With a wide channel, it can be used for determining the initial price movement waves. It works on any instrument and any time frame of the chart. It works in 2 different modes: The first mode shows any changes in the channel when t
      SL Trend Screener
      Chalin Saranga Jayathilake
      5 (4)
      if you want more information please  pm me HI guys this my developing indicator 1st version alert logic work well.. this indicator using can you stronger currency and top weaker currency find well,this;s indicator multy MTF time frame strength work.very good for SL trend screener intraday trader and long time trader, very easily can you watch stronger and weaker index.I hope to more improve this future further,thank you
      DTM Hypertrend
      Gabor Bocsak
      5 (1)
      AFTER PURCHASE LEAVE A MESSAGE i WILL SEND THE BONUS EA TRADE ASSISTANT! Hypertrend is a very powerful visual indicator which will color the candles according to the strength of the trend . NON REPAINTING!  Works on all pairs and timeframes! Check the screenshots( GIF)! The indicator is using a special RSI setup with a MACD algorythm and market structure brakes. Settings: Just change the colors to your preference and choose the alerts.Set up your preferences in the trade assistant EA  panel ( Fi
      Introduction This indicator detects volume spread patterns for buy and sell opportunity. The patterns include demand and supply patterns. You might use each pattern for trading. However, these patterns are best used to detect the demand zone (=accumulation area) and supply zone (=distribution area). Demand pattern indicates generally potential buying opportunity. Supply pattern indicates generally potential selling opportunity. These are the underlying patterns rather than direct price action. T
      MFI Speed mq
      DMITRII GRIDASOV
      Forex Indicator "MFI Speed" for MT4 The calculation of this indicator is   based on equations from physics . MFI Speed is the   1st derivative of MFI   itself  Money Flow Index (MFI)  is a technical oscillator which uses  price and volume data  for identifying oversold and overbought zones MFI Speed is   good for scalping momentum entries   into the direction of main trend Use it   in combination   with suitable   trend indicator , for example standard EMA (as on pictures) MFI Speed indicator
      MoveWave
      Andriy Sydoruk
      MoveWave - Moving waves are very handy indicators for determining pivot levels. Most Forex traders make decisions based on technical analysis. This type of analysis determines patterns and trends in the market. With the help of complex mathematical equations that are combined and made out in the form of this indicator, the trader will be able to more accurately determine the price reversal levels. Wave theory mathematically represents various behavioral models of the market. It is used as the ba
      The indicator automatically sets trendlines on the really important points directly on the chart. Timeframe, color and style of the lines can be adjusted. Notification of a breakout above or below the line via a smartphone is possible. Input Parameters TimeFrame : Choose timeframe AppliedPrice : Choose close , open, high, low, median, typical or weighted price Formation : Choose swing, Shoulder head shoulder or long term formation Alerts : true = alert is on SendEmail : Send message to email a
      Visual guide which divides the 24 hours into three trading sessions. The default setting is to show   Asian ,   London   and   New York   sessions. But, the session start and end hours can be adjusted as required.  The indicator is useful to develop trading strategies by making it easy to see the market behavior during the three sessions.  Inputs Time Zone Start and End hours (Please provide values in HH:MM format, like 02:00, not like 2:00. Both the hours and minutes should have 2 digits)
      Skan
      Niravkumar Maganbhai Patel
      4.67 (3)
      SKAN   This indicator helps you to scan all symbols which are in the Market Watch window and filter out a trend with alerts. It works on five most effective indicators which are used by most of traders for trading: Moving Average Super Trend (ST) Bolinger Band (BB) OPRC BFD It calculates two bars for scanning. When box colour changes to coral or royal blue colour, it indicates you for trend change for long and short entry. And also you will get alert on screen. When it changes to royal blue, it
      FREE
      It is a secure automated market trading software. The architecture is a fully automatic autonomous expert robot capable of independently analyze the market and make trading decisions Efficient. It is an advanced and professional trading system. Requirements Supported currency pairs: CADJPY,GBPCHF,AUDJPY,USDCHF,EURCAD,EURNZD,NZDJPY; Best Pair CAD/JPY; Timeframe: H1; The EA may not be sensitive to spread and slippage. I advise you to use a good broker convenient for you; The adviser must work c
      The Levels ResSup MT4 trading indicator independently builds support and resistance lines on the price chart, as well as the expected additional channel lines. INFORMATION ABOUT THE INDICATOR The indicator has support levels (indicated in blue) and resistance levels (indicated in red). The indicator also has more forming support levels (such levels come in strokes with the colors mentioned earlier). There are also internal support levels (marked in green) and resistance levels (marked in pi
      Price Statistics
      Miguel Antonio Rojas Martinez
      This indicator works only 5 digits Brokers. It is impossible to talk about the study of the Forex market or any market without considering of that market statistics. In this case, our indicator "price statistics" we have a new way to study our chart, giving information of the price in a range of pips you want to study for example, can we know how many times the price closes or opens into spaces 10, 20, 30, 50, 100 pips or more; and know them not only in numbers but also draws this relationship a
      Buyers of this product also purchase
      Gann Made Easy
      Oleg Rodin
      4.85 (82)
      Gann Made Easy is a professional and easy to use Forex trading system which is based on the best principles of trading using the theory of mr. W.D. Gann. The indicator provides accurate BUY and SELL signals including Stop Loss and Take Profit Levels. You can trade even on the go using PUSH notifications. PLEASE CONTACT ME AFTER PURCHASE TO GET MY TRADING TIPS PLUS A GREAT BONUS! Probably you heard already many times about Gann trading methods. Usually Gann's theory is very complex thing not only
      TPSpro RFI Levels
      Roman Podpora
      4.82 (22)
      Reversal First Impulse levels (RFI)    INSTRUCTIONS        RUS       -       ENG              R ecommended to use with an indicator   -   TPSpro  TREND PRO -  Version MT5 A key element in trading is zones or levels from which decisions to buy or sell a trading instrument are made. Despite attempts by major players to conceal their presence in the market, they inevitably leave traces. Our task was to learn how to identify these traces and interpret them correctly. Main functions: Displaying activ
      Gold Stuff
      Vasiliy Strukov
      4.89 (238)
      Gold Stuff is a trend indicator designed specifically for gold and can also be used on any financial instrument. The indicator does not redraw and does not lag. Recommended time frame H1. At it indicator work full auto  Expert Advisor EA Gold Stuff. You can find it at my profile. Contact me immediately after the purchase to get   personal bonus!  You can get a free copy of our Strong Support and Trend Scanner indicator, please pm. me! Settings  and manual here   SETTINGS Draw Arrow - on off. dra
      Atomic Analyst
      Issam Kassas
      5 (2)
      First of all Its worth emphasizing here that this Trading Indicator is   Non-Repainting , Non Redrawing and Non Lagging Indicator   Indicator, Which makes it ideal from both manual and robot trading.  User manual: settings, inputs and strategy . The Atomic Analyst  is a PA Price Action Indicator that uses Strength and Momentum of the price to find a better edge in the market. Equipped with Advanced filters which help remove noises and false signals, and Increase Trading Potential. Using Multipl
      Trend Punch
      Mohamed Hassan
      4.95 (19)
      This indicator is unstoppable when combined with our other indicator called  Support & Resistance . After purchase, send us a message and you will get it   for  FREE as a BONUS! Introducing Trend Punch , the revolutionary forex trend indicator that will transform the way you trade! Trend Punch is uniquely designed to provide precise buy and sell arrows during strong market trends, making your trading decisions clearer and more confident. Whether you're trading major currency pairs or exotic sym
      TPSproTREND PrO
      Roman Podpora
      4.79 (19)
      TPSpro TRENDPRO  - is a trend indicator that automatically analyzes the market and provides information about the trend and each of its changes, as well as giving signals for entering trades without redrawing! The indicator uses each candle, analyzing them separately. referring to different impulses - up or down impulse. Exact entry points into transactions for currencies, crypto, metals, stocks, indices!  Version MT5             DETAILED DESCRIPTION              R ecommended to use with an indi
      Trend Screener
      STE S.S.COMPANY
      4.8 (87)
      Unlock the Power of Trends Trading with the Trend Screener Indicator: Your Ultimate Trend Trading Solution powered by Fuzzy Logic and Multi-Currencies System! Elevate your trading game with the Trend Screener, the revolutionary trend indicator designed to transform your Metatrader into a powerful Trend Analyzer. This comprehensive tool leverages fuzzy logic and integrates over 13 premium features and three trading strategies, offering unmatched precision and versatility. LIMITED TIME OFFER : Sup
      FX Power MT4 NG
      Daniel Stein
      5 (12)
      Trading GOLD, and currencies, with the dog walk strategy  - super smart Trading GOLD, and currencies, with the breakout strategy  - super easy Visit our all-new   Stein Investments Welcome Page   to get the latest information, updates and trading strategies. FX Power MT4 NG  is the next generation of our long-time very popular currency strength meter, FX Power.  And what does this next-generation strength meter offer? Everything you have loved about the original FX Power  PLUS GOLD/XAU stre
      FX Volume
      Daniel Stein
      4.58 (33)
      Visit our all-new   Stein Investments Welcome Page   to get the latest information, updates and trading strategies. FX Volume is the FIRST and ONLY volume indicator that provides a REAL insight into the market sentiment from a broker's point of view. It provides awesome insights into how institutional market participants, like brokers, are positioned in the Forex market, much faster than COT reports. Seeing this information directly on your chart is the real game-changer and breakthrough solut
      Scalper Inside PRO
      Alexey Minkov
      4.73 (56)
      An exclusive indicator that utilizes an innovative algorithm to swiftly and accurately determine the market trend. The indicator automatically calculates opening, closing, and profit levels, providing detailed trading statistics. With these features, you can choose the most appropriate trading instrument for the current market conditions. Additionally, you can easily integrate your own arrow indicators into Scalper Inside Pro to quickly evaluate their statistics and profitability. Scalper Inside
      - Real price is 80$ - 40% Discount ( It is 49$ now ) Contact me for instruction, add group and any questions! Related EA Product: Bitcoin Expert Introduction The breakout and retest strategy is traded support and resistance levels. it involves price breaking through a previous level.  The break and retest strategy is designed to help traders do two main things, the first is to avoid false breakouts. Many false breakouts start with a candlestick that breaks out of a level but ends with an immedi
      Enigmera
      Ivan Stefanov
      5 (3)
      ENIGMERA: The core of the market (If the demo of mql5.com doesn't working and you want to try Enigmera please message me.) Introduction This indicator and trading system is a remarkable approach to the financial markets . ENIGMERA uses the fractal cycles to accurately calculate support and resistance levels. It shows the authentic accumulation phase and gives direction and targets.  A system that works whether we are in a trend or a correction.   How does it operate? ENIGMERA comprises of fol
      The Chart Patterns All-in-One indicator helps traders visualize various chart patterns commonly used in technical analysis. It supports identifying potential market behaviors, but profitability is not guaranteed. Testing in demo mode is recommended before purchasing. Current Offer : 50% discount on the "Chart Patterns All in One" indicator. Included Patterns : Pattern 1-2-3 : Detects market reversals using three key points (highs or lows). Buy : Two consecutive lows followed by a lower high. Se
      MetaBands M4
      Vahidreza Heidar Gholami
      5 (2)
      MetaBands uses powerful and unique algorithms to draw channels and detect trends so that it can provide traders with potential points for entering and exiting trades. It’s a channel indicator plus a powerful trend indicator. It includes different types of channels which can be merged to create new channels simply by using the input parameters. MetaBands uses all types of alerts to notify users about market events. Features Supports most of the channel algorithms Powerful trend detection algorith
      Market Reversal Alerts
      LEE SAMSON
      4.19 (113)
      Profit from market structure changes as price reverses and pulls back. The market structure reversal alert indicator identifies when a trend or price move is approaching exhaustion and ready to reverse. It alerts you to changes in market structure which typically occur when a reversal or major pullback are about to happen. The indicator identifies breakouts and price momentum initially, every time a new high or low is formed near a possible exhaustion point. The indicator draws in a rectangle on
      Currently 20% OFF ! Best Solution for any Newbie or Expert Trader! This dashboard software is working on 28 currency pairs plus one. It is based on 2 of our main indicators (Advanced Currency Strength 28 and Advanced Currency Impulse). It gives a great overview of the entire Forex market plus Gold or 1 indices. It shows Advanced Currency Strength values, currency speed of movement and signals for 28 Forex pairs in all (9) timeframes. Imagine how your trading will improve when you can watch the e
      Bomb Bank Signal
      Igor Pereira Calil
      5 (1)
      Bomb Bank Signal: Your Trusted Indicator for MetaTrader 4 The Bomb Bank Signal is a powerful indicator for MetaTrader 4, designed to identify the most relevant trends in the financial market. If you are looking for a tool that accurately anticipates movements, Bomb Bank is the ally you need. How it Works: This indicator combines three distinct methods – volume analysis, candle closes and symmetrical trend – to detect and signal buying and selling opportunities. Bomb Bank is like a "bomb"
      Trend Cutter
      Oleg Rodin
      5 (2)
      Trend Cutter   is a trend indicator which can be used with any time frame including the lower time frames like M1 and M5. The indicator is ideal for traders who prefer intraday trading and will be helpful to those who prefer long-term trading as well. You can use this indicator as a basis for your trading system or as a standalone trading solution. The indicator provides non-repaint signals on the close of the current candle. When the signal candle is closed, the signal will stay fixed on chart.
      Currency Strength Wizard is a very powerful indicator that provides you with all-in-one solution for successful trading. The indicator calculates the power of this or that forex pair using the data of all currencies on multiple time frames. This data is represented in a form of easy to use currency index and currency power lines which you can use to see the power of this or that currency. All you need is attach the indicator to the chart you want to trade and the indicator will show you real str
      TakePropips Donchian Trend Pro
      Eric John Pajarillaga Aldana
      4.44 (16)
      TakePropips Donchian Trend Pro  (MT4) is a powerful and effective tool that automatically detects the direction of the trend using the Donchian Channel and provides you with an entry and exit trading signals! This multi-function indicator includes a trend scanner, trading signals, statistical panel, screener, trading sessions, and alerts history dashboard. It is designed to provide you with trading signals and save you hours analyzing the charts! You can download the user manual and installation
      Supply and Demand Dashboard PRO
      Bernhard Schweigert
      4.8 (20)
      Currently 20% OFF ! This dashboard is a very powerful piece of software working on multiple symbols and up to 9 timeframes. It is based on our main indicator (Best reviews:   Advanced Supply Demand ). The dashboard gives a great overview. It shows: Filtered Supply and Demand values including zone strength rating, Pips distances to/and within zones, It highlights nested zones, It gives 4 kind of alerts for the chosen symbols in all (9) time-frames. It is highly configurable for your personal
      CURRENTLY 26% OFF Best Solution for any Newbie or Expert Trader! This Indicator is a unique, high quality and affordable trading tool because we have incorporated a number of proprietary features and a new formula. With only ONE chart you can read Currency Strength for 28 Forex pairs! Imagine how your trading will improve because you are able to pinpoint the exact trigger point of a new trend or scalping opportunity? User manual: click here That's the first one, the original! Don't buy a worthle
      CURRENTLY 31% OFF !! Best Solution for any Newbie or Expert Trader! This indicator is a unique, high quality and affordable trading tool because we have incorporated a number of proprietary features and a secret formula. With only ONE chart it gives Alerts for all 28 currency pairs. Imagine how your trading will improve because you are able to pinpoint the exact trigger point of a new trend or scalping opportunity! Built on new underlying algorithms it makes it even easier to identify and confir
      IX Power MT4
      Daniel Stein
      5 (5)
      IX Power finally brings the unbeatable precision of FX Power to all your trading symbols. It accurately determines the intensity of short, medium and long-term trends in your favourite indices, stocks, commodities, ETFs, and even cryptocurrencies. You can analyse everything your terminal has to offer. Try it out and experience how your timing improves significantly when trading. Read about our latest strategic development -  Easy scalping with IX Power Visit our all-new   Stein Investments
      Stratos Pali Indicator   is a revolutionary tool designed to enhance your trading strategy by accurately identifying market trends. This sophisticated indicator uses a unique algorithm to generate a complete histogram, which records when the trend is Long or Short. When a trend reversal occurs, an arrow appears, indicating the new direction of the trend. Important Information Revealed Leave a review and contact me via mql5 message to receive My Top 5 set files for Stratos Pali at no cost! D
      Automatically draw support and resistance levels PLUS propulsion candle gaps on your chart, so you can see where price is likely to head next and/or potentially reverse. This indicator is designed to be used as part of the position trading methodology taught on my website (The Market Structure Trader) and displays key information for targeting and potential entries. MT version available here:  https://www.mql5.com/en/market/product/97973 There are 2 CORE features in the indicator and 4 additiona
      This dashboard is an alert tool for use with the market structure reversal indicator. It's primary purpose is to alert you to reversal opportunities on specific time frames and also to the re-tests of the alerts (confirmation) as the indicator does. The dashboard is designed to sit on a chart on it's own and work in the background to send you alerts on your chosen pairs and timeframes. It was developed after many people requested a dash to monitor multiple pairs and time frames at once rather th
      Gold Channel is a volatility-based indicator, developed with a specific timing algorithm for the XAUUSD pair, which consists of finding possible corrections in the market. This indicator shows two outer lines, an inner line (retracement line) and an arrow sign, where the theory of the channel is to help identify overbought and oversold conditions in the market. The market price will generally fall between the boundaries of the channel. If prices touch or move outside the channel it is a tra
      PRO Renko System
      Oleg Rodin
      5 (25)
      PRO Renko System is a highly accurate trading system specially designed for trading RENKO charts. The ARROWS and Trend Indicators DO NOT REPAINT! The system effectively neutralizes so called market noise giving you access to accurate reversal signals. The indicator is very easy to use and has only one parameter responsible for signal generation. You can easily adapt the tool to any trading instrument of your choice and the size of the renko bar. I am always ready to provide extra support to help
      First of all Its worth emphasizing here that this Trading Tool is Non-Repainting Non-Redrawing and Non-Lagging Indicator Which makes it ideal for professional trading . Online course, user manual and demo. The Smart Price Action Concepts Indicator is a very powerful tool for both new and experienced traders . It packs more than 20 useful indicators into one combining advanced trading ideas like Inner Circle Trader Analysis and Smart Money Concepts Trading Strategies . This indicator focuses on
      More from author
      Extract Candle Power
      Thushara Dissanayake
      5 (2)
      Extract Candle Power is a real time volume extractor indicator that provides valuable insights into the behavior of sellers and buyers during each candle. By analyzing the volume data, traders can make more informed decisions about market trends and potential reversals, surpassing the capabilities of traditional Moving Average indicators. This powerful tool allows you to extract and analyze the sellers and buyers volume of the current candle, as well as compare it with the volume of previous can
      Introducing the Fibo Channels Ultimate technical indicator, a powerful tool designed to revolutionize your Fibonacci trading strategy. With its advanced functionality, this indicator automatically draws all past Fibonacci channels on your chart, saving you time and effort. What sets the Fibo Channels Ultimate apart is its exceptional customization capabilities, allowing professional traders to draw any Fibonacci level they desire. This level of flexibility ensures that you can tailor the indicat
      BullsBears Action
      Thushara Dissanayake
      3.83 (12)
      The BullsBears Action Expert Advisor is a powerful tool designed to utilize Bulls and Bears volume data for trading decisions. By analyzing the percentage of Bulls and Bears in the market based on candle volume, this EA automatically opens Buy or Sell orders according to user-defined parameters. It provides a user friendly trading solution that incorporates risk management, automatic stop loss adjustment, and customizable settings. One of the key features of this expert advisor is its risk manag
      FREE
      The Volume Percentage Line Graph is an indicator designed to provide volume data insights. It retrieves total volume information for each candle and presents it as a percentage of the overall volume. The indicator displays this data as graph lines in a separate window, allowing users to easily visualize the battle between buyers and sellers. One of the key features of this indicator is its ability to show the volume percentage as graph lines. By representing the volume distribution between selle
      FREE
      Ms Fibonacci
      Thushara Dissanayake
      3.5 (4)
      Introducing Ms. Fibonacci , a powerful and free indicator designed to simplify the process of drawing and adjusting Fibonacci levels on your chart. This indicator automatically identifies and marks the new highest and lowest Fibonacci levels, ensuring accurate and precise placement. One of the key features of Ms. Fibonacci is its ability to draw Fibonacci levels correctly, point to point, and mark the corresponding price levels. This feature saves you time and effort, allowing you to focus on an
      FREE
      Candle GAP
      Thushara Dissanayake
      3 (1)
      The Candle GAP indicator is an essential tool for traders utilizing Gap Trading Strategies as it automatically identifies candle gaps for each day of the week. A gap refers to a price level difference between the close and open of two consecutive days. This indicator recognizes four types of gap patterns: Common, Breakaway, Continuation, and Exhaustion. By incorporating this indicator into any chart, traders can validate their signals and enhance their trading decisions. One of the key features
      FREE
      The   RSI Crossover Alert   is a powerful notification system designed specifically for traders who utilize the   Relative Strength Index (RSI)   in their trading strategies. This indicator focuses on identifying RSI crossovers, which occur when the fast RSI line crosses above or below the slow RSI line. By combining these crossovers, the indicator effectively filters out false signals, allowing traders to make more accurate trading decisions. The RSI Crossover Alert offers several key features
      Reversal Alert Pro
      Thushara Dissanayake
      2.5 (2)
      The Reversal Alert Pro indicator is a powerful tool designed to automatically detect reversal areas in the market. It offers convenient notifications sent directly to your mobile device and displays pop-up alerts with sound. By incorporating this indicator into your trading strategy, you can effectively filter trade positions. Furthermore, the indicator provides the option to utilize CCI, RSI, and Stochastic indicators to further refine the generated signals, enhancing its versatility and applic
      Candle Power Pro
      Thushara Dissanayake
      4.33 (6)
      Unlock the power of real volume information with the Candle Power Pro indicator. This dynamic tool captures the actual volume data for each candle and presents it as a percentage of the total volume. By doing so, it empowers you to discern the ongoing struggle between buyers and sellers in the market. The Candle Power Pro displays the battle between buyers and sellers as a percentage of the total volume, giving you valuable insights into market dynamics. You can easily confirm breakouts by anal
      Mr Fibonacci
      Thushara Dissanayake
      5 (1)
      Introducing Mr. Fibonacci , an amazing indicator designed to simplify the process of drawing and adjusting Fibonacci levels on your chart. This indicator offers exceptional customization options for professional traders, allowing them to draw any Fibonacci level with precision. Additionally, it provides mobile notifications, email alerts, and pop-up alerts when price enters Fibonacci levels, ensuring you never miss potential trading opportunities. Using this indicator, you no longer have to cons
      Two MA Crossover
      Thushara Dissanayake
      5 (3)
      The Two MA Crossover is a powerful notification system designed specifically for traders who rely on the Moving Average Crossover Strategy . This fully automated indicator serves as a comprehensive alert system, ensuring that you never miss a crucial trading event. It sends notifications to your mobile device, email, and displays pop-up alerts with sound on your computer, all when it detects a moving average crossover based on your preferred parameters. One of its notable features is its compati
      Pivot Bro
      Thushara Dissanayake
      5 (1)
      The Pivot Bro technical indicator is a powerful tool designed to identify retracement areas using Pivot, Fibonacci, ATR, and ADR levels. It goes beyond that by also recognizing price action based reversal candlestick patterns . Additionally, the Currency Meter is a valuable companion for assessing the true strength of major currencies. By analyzing 28 currency pairs and displaying their strength on the chart with color changes, it enables traders to make informed decisions on entry and exit poin
      ReversalPatterns
      Thushara Dissanayake
      This technical indicator automatically identifies and analyzes price action using a variety of Reversal Candlestick Patterns on the chart. It conveniently draws arrow signs along with the corresponding pattern names, making it easy to spot the latest reversal candlestick patterns. With this indicator, you can quickly identify and compare chart analysis with previously identified candle patterns. The indicator includes a range of implemented candlestick patterns, both simple and complex, such as
      Currency Strength 7
      Thushara Dissanayake
      The Currency Strength 7 technical indicator is a powerful tool designed to help traders gauge the strength of the seven most popular currencies. By analyzing the strength of AUD, USD, EUR, GBP, JPY, CHF, and CAD, this indicator provides valuable insights into currency dynamics. It represents currency strength on the chart using lines, allowing traders to quickly assess the relative strength of different currencies. One of the standout features of this indicator is its ability to draw an extended
      Crossover Action
      Thushara Dissanayake
      The Crossover Action Expert Advisor is an advanced tool designed to automate one of the most popular trading strategies, the M oving Average Crossover Strategy . With its intuitive interface and powerful features, this expert advisor takes the complexity out of manual trading and executes trades automatically based on moving average crossovers. One of the key features of this expert advisor is its proper risk management system, ensuring that trades are executed with appropriate lot sizes and max
      CCI Action
      Thushara Dissanayake
      The CCI Action Expert Advisor is a powerful tool designed to automate the CCI (Commodity Channel Index) Strategy , allowing traders to capitalize on CCI level touches. With its user friendly settings and robust risk management system, this EA provides a reliable and efficient solution for traders looking to incorporate the CCI indicator into their trading approach. One of the key features of this Expert Advisor is its proper risk management system, which helps traders maintain control over their
      News Robo
      Thushara Dissanayake
      2 (1)
      The News Robo Expert Advisor is a powerful tool designed to assist news traders in opening pending orders with hidden stop loss during news releases. It offers several features that enhance your trading experience and protect your trades. One of the key features of News Robo is the hidden stop loss, which is ideal for news traders who prefer to conceal their stop loss from market maker brokers. The stop loss is automatically revealed once a profitable position is achieved, allowing you to secure
      RSI Action
      Thushara Dissanayake
      3.67 (3)
      The RSI Action Expert Advisor is a powerful tool that automates popular RSI (Relative Strength Index) strategies, allowing for efficient and accurate trading. By utilizing overbought and oversold levels, this EA identifies optimal entry points for buy and sell orders. It also offers various signal filtering options to enhance trading precision, including RSI reversal points, pending orders, major trend identification, and Moving Average Crossover signals. Additionally, it incorporates a modern
      Fibo Scalper Pro
      Thushara Dissanayake
      2.33 (3)
      The Fibo Scalper Pro Expert Advisor is a powerful tool designed to automate popular Fibonacci Trading Strategies . It simplifies the trading process by automatically drawing and adjusting Fibonacci levels on the chart. This feature provides convenience and accuracy for traders who utilize Fibonacci retracements and extensions in their analysis. One of the key features of the Fibo Scalper Pro is its customization facility. It allows professional traders to enable or disable each Fibonacci leve
      TPSL Driver
      Thushara Dissanayake
      Introducing the TPSL Driver Utility , a powerful tool designed to enhance your trading experience by automating Stop Loss and Take Profit management. This utility caters to every trader who desires seamless order management and advanced profit protection techniques. With the TPSL Driver Utility, you have the flexibility to choose between two modes of order management: Hidden and Visual. The Hidden mode allows you to hide the Take Profit and Stop Loss levels, providing a discreet approach to mana
      Breakout Robot
      Thushara Dissanayake
      5 (2)
      Introducing the Breakout Robot Expert Advisor , a revolutionary tool designed to automate the highly sought-after EURJPY Breakout Strategy with unparalleled ease. This powerful EA features a simple yet effective system that effortlessly draws a box using high and low values between 22:00 - 02:00 GMT. It then automatically executes BUY/SELL orders when price breaks above/below the box, all optimized for the M15 time frame. With complete customization capabilities, you have the flexibility to tail
      Entry Point
      Thushara Dissanayake
      Introducing the Entry Point , a powerful technical indicator designed to provide Buy/Sell notifications. This indicator analyzes 5 moving averages, CCI, RSI, Stochastic, Bill Williams, and volume indicators across 3 different time frames to generate accurate signals. It offers unlimited customization options for professional traders, allowing them to tailor the indicator based on their experience and strategies. The Entry Point sends signals to users via mobile devices, email, and pop-up alerts
      Entry Point Dashboard Ultimate
      Thushara Dissanayake
      4 (5)
      Introducing the Entry Point Dashboard Ultimate , a powerful technical indicator designed to provide Buy/Sell notifications for 6 currency pairs. This indicator analyzes 5 moving averages, CCI, RSI, Stochastic, Bill Williams, and volume indicators across 3 different time frames to generate accurate signals. It offers unlimited customization options for professional traders, allowing them to tailor the indicator based on their experience and strategies. The Entry Point Dashboard Ultimate sends sig
      The Crossover Tactics Ultimate Expert Advisor is a powerful tool designed to automate popular Moving Average Crossover Strategies . It excels at identifying optimal entry points based on the intersection of three moving averages, while employing advanced filtering techniques to enhance the reliability of signals. However, what sets this EA apart is its comprehensive trade management system, known as the TPSL Driver Utility algorithm. One of the standout features of this expert advisor is its abi
      Introducing the DFP Reconnoiter Ultimate , a technical indicator specifically designed for Daily Fibonacci Pivot Strategy traders. This indicator incorporates standard Fibonacci retracements, daily Pivot levels, Candlestick patterns, ATR and ADR levels to identify reversal and exit areas, resulting in well-timed entries. Key Fibonacci retracement levels of 38.2%, 50.0%, or 61.8% are preferred in conjunction with the daily central pivot. The strategy involves monitoring the Average True Range (AT
      Currency Heat Wave Ultimate
      Thushara Dissanayake
      5 (1)
      The Currency Heat Wave Ultimate technical indicator is a valuable tool that provides traders with real time insights into the strength of major currencies. With its analysis of 28 currency pairs, it offers a comprehensive overview of currency strength directly on the chart, making it incredibly convenient to use. By dynamically changing colors, it enables traders to quickly identify the positions of currencies and make informed decisions. One of the notable features of Currency Heat Wave is its
      Exit Area Ultimate
      Thushara Dissanayake
      3 (1)
      The Exit Area Ultimate is a technical indicator designed to enhance trading decisions by indicating the daily Average True Range (ATR) and Average Daily Rate (ADR) levels on the chart. By understanding these levels, traders can easily assess the average movement of an asset throughout the day. This versatile indicator serves multiple purposes for day traders, aiding in order placement, identifying intraday tendencies, setting trailing stop loss levels, and establishing daily take profit levels.
      Level Scanner
      Thushara Dissanayake
      The Level Scanner indicator is a powerful tool designed to automate the identification of Higher and Lower areas on the chart, along with all Support and Resistance levels . It incorporates the use of the Hull Moving Average to provide a clearer and smoother representation of the real trend. This indicator operates with remarkable speed, enabling traders to quickly identify key areas of interest and make more informed trading decisions. One of the standout features of the Level Scanner is its ve
      The Infinity Oscillators Ultimate is an all inclusive OSCI-KIT designed to enhance the trading experience for traders utilizing RSI, Stochastic, MACD, CCI, and Volume strategies. With its comprehensive range of features, this indicator offers a powerful toolset to analyze market trends, identify reversals and retracements, calculate intraday targets using ATR, and stay informed about crucial trading events. One of the standout features of this indicator is its ability to consolidate the most po
      Introducing the Bollinger Band Volume Breakout Detector , a powerful technical indicator designed to enhance the popular Bollinger Band Breakout Strategy . This indicator takes trend following to the next level by incorporating Volume Data, effectively minimizing false signals. By adhering to the principle of "volume confirms price," this tool allows traders to identify price breakouts accompanied by significant increases in volume, ensuring more accurate trading decisions. The indicator's custo
      Filter:
      No reviews
      Reply to review
      Version 1.3 2018.11.14
      1. Optimized signal parameters for quick notifications.
      2. Added new parameter for change Buy/Sell arrows.
      3. Updated the product logo.
      Version 1.2 2018.01.12
      1. Now it shows preview crossover points by drawing arrow icons.
      2. Arrow icon can change.
      3. Removed "BUY SIGNAL", "SELL SIGNAL" Comments on the chart.
      Version 1.1 2017.12.25
      1. Draw Moving average trend lines on the chart.
      2. Save arrow signals.