Trend Convergence Divergence
- Indicators
- Alexandr Romenschi
- Version: 1.0
- Activations: 5
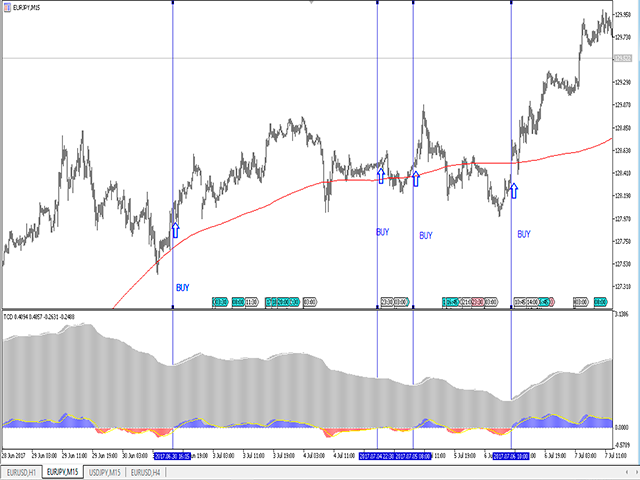
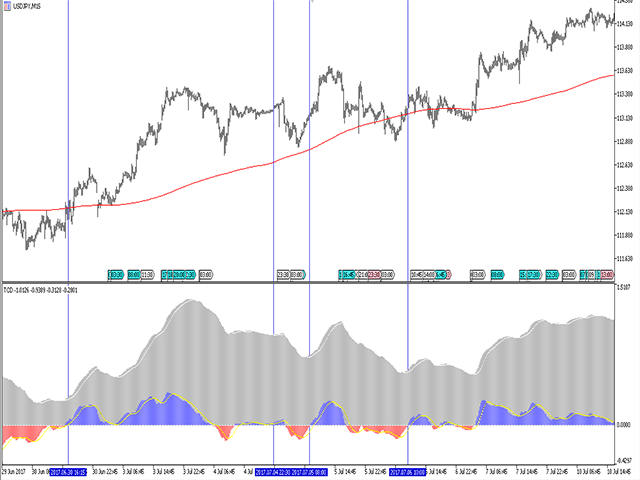
TCD (Trend Convergence Divergence) is based on the standard MACD indicator with modified calculations. It displays the trend strength, its impulses and rollbacks.
TCD consists of two histograms, the first one shows the main trend, while the second done displays the impulses and rollbacks.
The advantages of the indicator include: trading along the trend, entering the market when impulses occur, trading based on divergence of the main trend and divergence of the rollbacks.
Input parameters
- Show_Signal_1: moving average is bound to the histogram of the main trend;
- Fast EMA Period: period of the main trend histogram 1;
- Slow EMA Period: period of the main trend histogram 2;
- SMA Period: period of the main trend histogram 3;
- Applied Price: apply to prices;
- Symbol: symbol;
- TimeFrame
- Fast EMA Period 1; period of the rollbacks histogram 1;
- Slow EMA Period 1; period of the rollbacks histogram 2;
- SMA Period 1; period of the rollbacks histogram 3;
- Applied Price 1: apply to prices;
- Symbol 1: symbol;
- TimeFrame 1
Have a successful trading!