X Tick Chart
- Indicators
- Artur Zas
- Version: 3.22
- Updated: 22 July 2021
- Activations: 10
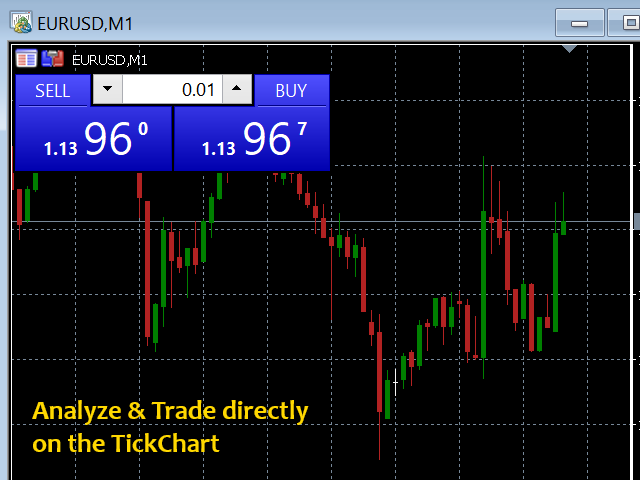
The indicator combines the features of both the Tick charts and Volume Bar charts. The mode can be selected in the indicator's settings.
Tick charts measure the number of transactions per bar. To give you an example if you have a 233 tick chart, each bar measures 233 transactions per bar and a new bar is plotted after 233 transactions. You can choose any number of ticks per bar but most traders choose Fibonacci numbers (1, 2, 3, 5, 8, 13, 21, 34, 55, 89, 144, 233...).
Volume bar charts are designed for use with exchange-traded instruments only (futures, stocks, etc.). Real volume data is needed for the chart to display. If no real volume data is present the chart will fall back to the "tick chart" mode. Real trade volume is used to calculate both live and historical bars. A new bar is formed only after a user-defined number of contracts are traded, aka volume!
For example, on a 4000 volume chart, each completed bar will always encompass a total traded volume of 4000 contracts and a new bar will form once another 4000 contracts are traded. The majority of traders consider volume to be the foundation of technical analysis and the driving force behind price action. Volume bars only print when substantial volume flows into the market, thus volume bars can significantly reduce chop or a sideways market structure. The idea is simple - when there is very little or no volume in the market, a new bar will not print.
Settings
- Ticks or volume per bar.
- Show history for a number of days (input the desired number of days (plus the current day) for the amount of history to process).
- Synchronize the first bar's open on a new day (true/false).
- Trading session time (HH:mm-HH:mm) - broker's server time is used. Input in the 24H format
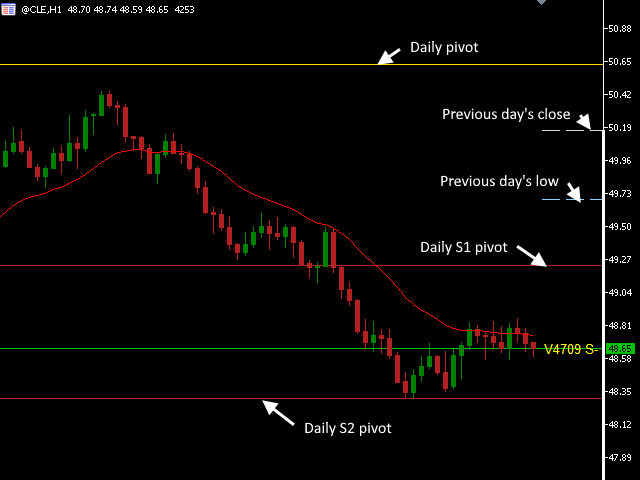
- Show pivot levels - Show Monthly, Weekly and Daily pivot levels plus Daily R1, R2, R3 & S1, S2, S3 (calculated using Classic or Fibonacci method) as well as previous day's High, Low & Close levels with color definitions.
- Pivot Point calculation method ( (H+L+C)/3 or (O+H+L+C)/4 ).
- Pivot & support/resistance color definitions
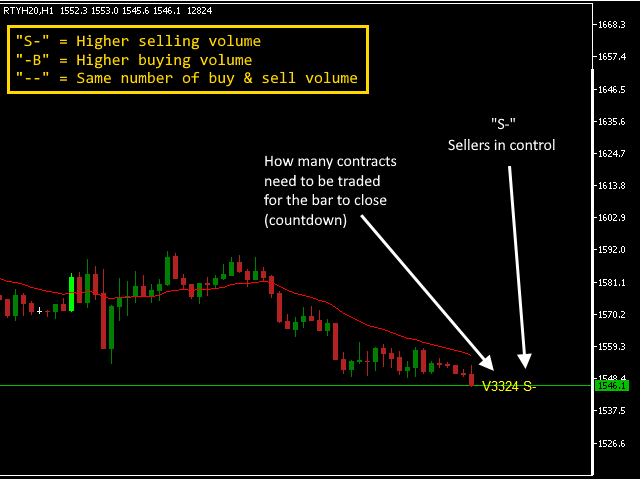
- Display tick chart info and tick countdown to a new bar (true/false)
- Alert condition (None / New bar / Reversal bar / MA1 & MA2 crossover / {plus variations})
- Alert notification type (None /Show in alert box / Play sound / Send push notification / {plus variations})
- Show MA (Don't show / draw as line / draw as dots)
- MA period
- MA method
- MA apply to
- MA shift.
- MA show price label (Yes/No)
- Show Channel (None, Donchian Channel, Bollinger Bands, Super Trend, Keltner Channel).
- Channel period.
- Channel ATR period (used for Keltner Channel only)
- Channel apply to.
- Channel multiplier.
- Channel bands deviations (used for Bullinger Bands only).
- Channel baands price labels (Yes/No)
- Channel mid-price label (Yes/No)
- Indicator used in EA via iCustom() (true/false) - Set this to true only when calling the indicator from an EA, another indicator or Script.
- Use padding Top/Bottom (0.0 - 1.0) - used to set the margins above and below the visible high & low of the visible tick chart.
- Show current bar's close projections (true/false) + bullish bar projection color and bearish bar projection color.
- Use sound file for bullish alerts (.wav sound file located in MetaTrader 5 \Sounds folder).
- Use sound file for bearish alerts (.wav sound file located in MetaTrader 5 \Sounds folder).
- Display as a bar chart (true/false).
- Shift objects with the chart (true/false)
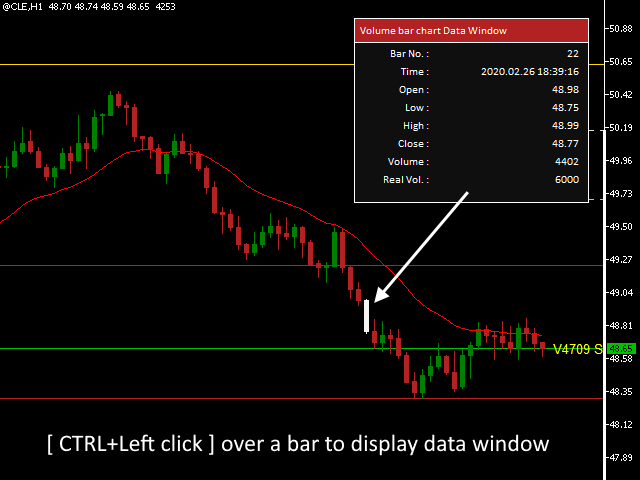
The indicator also features a custom data window where you can inspect each bar's OLHC prices as well as the bar's open time.
The data window is displayed by left-clicking on the selected candle while holding down the Ctrl key on your keyboard.
Chart autoscale feature can be toggled ON/OFF using Ctrl+Q

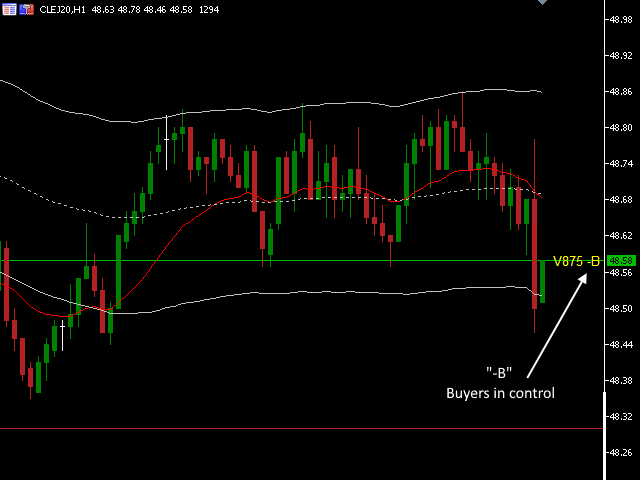











it's so usuful, used with keltner channel