• Overview
  • Reviews (1)
  • Comments (11)
  • What's new

Elder Force Index With ATR Channels

3

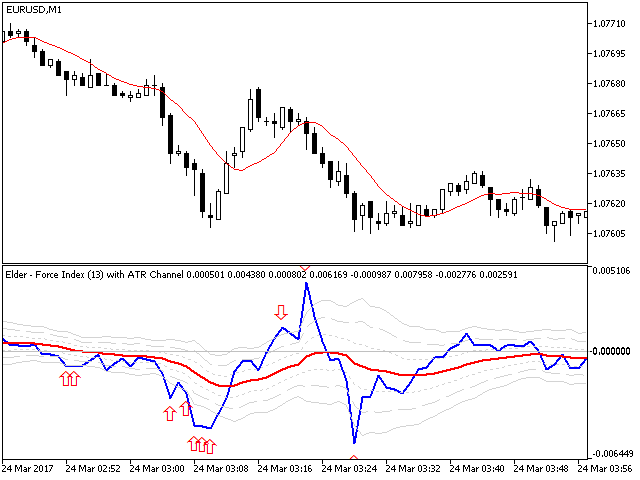
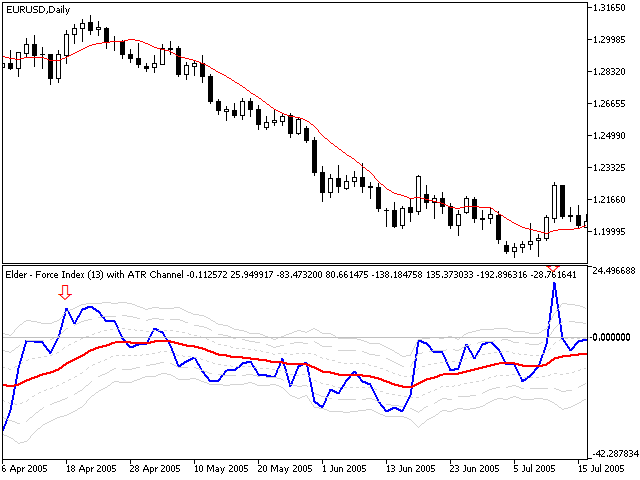
Adding Average True Range (ATR) channels to Force Index had been suggested by Kerry Lovvorn. Adding these channels turns Force Index into an excellent tool for identifying intermediate tops and bottoms. Force Index with ATR channels does not catch all turns, but the ones it identifies deserve very serious attention.

Note: the word “true” in Average True Range refers to dealing with price gaps. Since there are no gaps in Force Index, here ATR is the same as the Average Range.

Whenever the Force Index rises above or falls below its 3-ATR channel, it signals that the ticker has reached an area of an unsustainable extreme. That’s where rallies and declines become exhausted and prices tend to reverse. This is one of very few tools that are equally efficient in calling both top and bottom areas. Elder-disk places a red arrow above the plot when the EMA of Force Index rises above the 3-ATR channel. It places a red arrow underneath the plot when that EMA declines below the 3-ATR channel.

In our experience, these signals work especially well on the weekly charts. Of course, users are welcome to experiment with them in any timeframe.


The parameters are

  • Force Index Period (13) – the length for the MA of raw Force Index
  • Force Index MA mode (Exponential) – the Moving Average mode of Force Index
  • Force Index Volume type (ticks) - the type of volume on which to apply the Force Index
  • ATR period (14) - the length of raw ATR
  • ATR amplificator (100) - a modifier to amplify the ATR
  • Mode of the MA of Bands (Exponential) – the MA mode for all the bands.
  • Length of the MA of Bands (21) -  the length for the MA of the bands
  • 1st bands factor (1) - the factor for the 1st bands (+ and -)
  • 2nd bands factor (1.5) - the factor for the 2nd bands (+ and -)
  • 3rd bands factor (2) - the factor for the 3rd bands (+ and -)
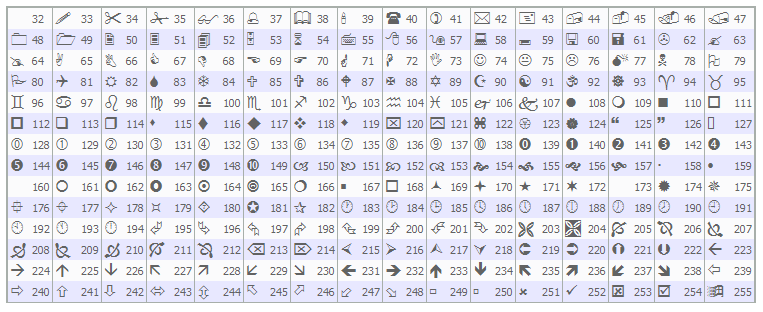
  • Wingdings code of spike sign above (242) – the Wingdings code of the symbol (down arrow). You can see the list of possible symbols in the screenshot section.
  • Color of spike sign above (Red) - the color of the symbol above the bands
  • Wingdings code of spike sign below (241) – the Wingdings code of the symbol (up arrow). You can see the list of possible symbols in the screenshot section.
  • Color of spike sign below (LimeGreen) - the color of the symbol below the bands


Format Tips: Force index channel has 7 plots – the Force Index, the smoothed Force Index and upper and lower bands at 1, 2 and 3 ATR.

The Force Index is drawn in blue with a thick line. The Averaged Force is a solid red line. The upper and lower bands at 1 ATR are drawn in dotted lines. The upper and lower bands at 2 ATR use dashed lines. The upper and lower bands at 3 ATR are solid gray lines.

Recommended products
Noize Absorption Index - is the manual trading system that measures the difference of pressure between bears forces and bulls forces. Green line - is a noize free index that showing curent situation. Zero value of index shows totally choppy/flat market.Values above zero level shows how powerfull bullish wave is and values below zero measures bearish forces.Up arrow appears on bearish market when it's ready to reverse, dn arrow appears on weak bullish market, as a result of reverse expectation.
199 USD
This innovative indicator for measuring the strength of currencies from INFINITY is an indispensable assistant for scalpers and traders trading for a long time. The system for analyzing the Strength / weakness of currencies has long been known and used in the market by the world's leading traders. Any arbitrage trading is not complete without this analysis. Our indicator easily determines the strength of the base currencies in relation to each other. It displays line charts for all or the curre
49 USD
The best time to trade Using this Indicator is when the time reach exactly hour,half,45 minutes,15 minutes and sometimes 5 minutes.. This indicators is helpful to those who trade boom and crash indecies.How to read this indicator first you'll see Blue allow and Red allow all these allows used to indicate or to detect the spike which will happen so the allow happens soon before the spike happen.This indicator works properly only in boom and crash trading thing which you have to consider when
50 USD
Owl Smart Levels MT5
Sergey Ermolov
4.46 (35)
MT4 version  |   FAQ The Owl Smart Levels Indicator is a complete trading system within the one indicator that includes such popular market analysis tools as Bill Williams' advanced fractals , Valable ZigZag which builds the correct wave structure of the market, and Fibonacci levels which mark the exact levels of entry into the market and places to take profits. Detailed description of the strategy Instructions for working with the indicator Advisor-assistant in trading Owl Helper Private User
97 USD
Binary Options Assistant (BOA) Multi Currency Dashboard for Binary Options (MT5) . You can use any of the BOA Signals Indicators with the dashboard. Just change the BOA Signals Indicator Name in the dashboard settings to the indicator you want to get signals from. For example: CHILL. BLAZE:  BOA_BLAZE_Indicator_v1   Strategy :   BLW Online Trading Binary Options Strategy (3 Moving Average) LAVA:  BOA_LAVA_Indicator_v1   Strategy:   Lady Trader Binary Options Strategy (Bollinger Bands & Stoc
30 USD
Premium level is a unique indicator with more than 80% accuracy of correct predictions! This indicator has been tested for more than two months by the best Trading Specialists! The author's indicator you will not find anywhere else! From the screenshots you can see for yourself the accuracy of this tool! 1 is great for trading binary options with an expiration time of 1 candle. 2 works on all currency pairs, stocks, commodities, cryptocurrencies Instructions: As soon as the red ar
990 USD
GapFinder Pro - Unleashing Market Opportunities Discover and capitalize on market gaps with precision using GapFinder Pro, the ultimate MetaTrader 5 indicator designed for novice and astute traders. Unveil hidden opportunities in the market and elevate your trading strategy with this powerful tool. Key Features: Any Currency! Any Time-Frame! Gap Detection and Visualization: Identify market gaps effortlessly with a visual representation on your MetaTrader 5 chart. Instantly recognize gaps, painte
40 USD
HMA Trend Professional MT5
Pavel Zamoshnikov
4.4 (5)
Improved version of the free HMA Trend indicator (for MetaTrader 4) with statistical analysis. HMA Trend is a trend indicator based on the Hull Moving Average (HMA) with two periods. HMA with a slow period identifies the trend, while HMA with a fast period determines the short-term movements and signals in the trend direction. The main differences from the free version: Ability to predict the probability of a trend reversal using analysis of history data. Plotting statistical charts for analyz
30 USD
The Antique Trend Indicator is a revolutionary trend trading and filtering solution with all the important features of a trend tool built into one tool! The Antique Trend indicator is good for any trader, suitable for any trader both for Forex and binary options. There is no need to configure anything, everything has been perfected by time and experience, it works great during flats and trends. The Antique Trend indicator is a tool for technical analysis of financial markets, reflecting curre
125 USD
Laguerre SuperTrend Clouds   adds an Adaptive Laguerre averaging algorithm and alerts to the widely popular SuperTrend indicator. As the name suggests,   Laguerre SuperTrend Clouds (LSC)   is a trending indicator which works best in trendy (not choppy) markets. The SuperTrend is an extremely popular indicator for intraday and daily trading, and can be used on any timeframe. Incorporating Laguerre's equation to this can facilitate more robust trend detection and smoother filters. The LSC uses the
30 USD
PZ Trend Trading MT5
PZ TRADING SLU
3.67 (3)
Trend Trading is an indicator designed to profit as much as possible from trends taking place in the market, by timing pullbacks and breakouts. It finds trading opportunities by analyzing what the price is doing during established trends. [ Installation Guide | Update Guide | Troubleshooting | FAQ | All Products ] Trade financial markets with confidence and efficiency Profit from established trends without getting whipsawed Recognize profitable pullbacks, breakouts and early reversals The ind
249 USD
KT Renko Patterns MT5
KEENBASE SOFTWARE SOLUTIONS
KT Renko Patterns scans the Renko chart brick by brick to find some famous chart patterns that are frequently used by traders across the various financial markets. Compared to the time-based charts, patterns based trading is easier and more evident on Renko charts due to their uncluttered appearance. KT Renko Patterns features multiple Renko patterns, and many of these patterns are extensively explained in the book titled Profitable Trading with Renko Charts by Prashant Shah. A 100% automate
145 USD
The Riko Trend indicator is a revolutionary trend trading and filtering solution with all the important features of a trend tool built into one tool! The Riko Trend indicator is good for any trader, suitable for any trader for both forex and binary options. You don’t need to configure anything, everything is perfected by time and experience, it works great during a flat and in a trend. The Riko Trend indicator is a technical analysis tool for financial markets that reflects the current price
109 USD
Rainbow EA MT5
Jamal El Alama
Description : Rainbow EA MT5 is a simple Expert advisor based on   Rainbow MT5 indicator witch is based on Moving average with period 34. The indicator is incorporated in the EA, therefore, it is not required for the EA to operate, but if you wish, you can download it from   my product page . The Expert Advisor settings are as follows : Suitable for Timeframes up to H1 The parameters below can be set according to your trading rules. StopLoss ( Stop Loss in pips) TakeProfit ( Take Profit in pi
69 USD
Volality Index Scalper
Lesedi Oliver Seilane
Volality Index scalper indicator  Meant for Volality pairs such as Volality 10, 25, 50, 75 and 100 The indicator works on all timeframes from the 1 minute to the monthly timeframe the indicator is non repaint the indicator has 3 entry settings 1 color change on zero cross 2 color change on slope change 3 color change on signal line cross Orange line is your sell signal Blue line is your buy signal.
35 USD
Magic Finger can help you identify trends and trading opportunities clearly. The finger points to the open position signal, and the discoloration line is confirmed by the trend. If you are a day trader, you can choose to trade during a period of active trading, referring to the discoloration line as the basis for the next order, finger signal as a filter. If you are a trend trader, you can choose a period above H1, wait for the appearance of the finger signal in the key price area, and enter
58 USD
To get access to MT4 version please click here . - This is the exact conversion from TradingView: "Stochastic Momentum Index" By "UCSgears". - This is a popular version of stochastic oscillator on tradingview. - This is a light-load processing and non-repaint indicator. - Buffers are available for the lines on chart. - You can message in private chat for further changes you need. Thanks for downloading
40 USD
US30NinjaMT5
Satyaseelan Shankarananda Moodley
US30 Ninja is a 5 minute scalping indicator that will let know you when there is a trade set up (buy or sell). Once the indicator gives the trade direction, you can open a trade and use a 30 pip stop loss and a 30 pip to 50 pip take profit. Please trade at own own risk. This indicator has been created solely for the US30 market and may not yield positive results on any other pair. 
30 USD
An indicator of pattern #31 ("Long Island") from Encyclopedia of Chart Patterns by Thomas N. Bulkowski. The second gap is in the opposite direction. Parameters: Alerts - show alert when an arrow appears   Push - send a push notification when an arrow appears (requires configuration in the terminal) GapSize - minimum gap size in points ArrowType - a symbol from 1 to 17 ArrowVShift - vertical shift of arrows in points   ShowLevels - show levels ColUp - color of an upward line ColDn - color of a
30 USD
GIVE A LOOK TO MY OTHER PRODUCTS ! 100 % PER MONTH PROFIT---- MY NEW SIGNAL HERE ------->   https://www.mql5.com/en/signals/2162238?source=Site+Signals+My# BROKEN TRENDLINE ALERT IS A SIMPLE TOOL INDICATOR. JUST DRAW IN YOUR CHART A DYNAMIC OR STATIC TRENDLINE,AND THE INDICATOR WILL SEND YOU ALERT WHENEVER THE PRICE CROSSES BELOW OR ABOVE YOUR DRAWN TRENDLINE. IT WORKS IN ANY TIMEFRAME AND ANY CHART YOU WANT.JUST GOT A VPS AND DON'T STRESS IN FRONT OF YOUR COMPUTER. FOR ANY KIND OF QUESTION
50 USD
The standard Bollinger Bands indicator has been improved by integrating additional indications from the Standard Deviation indicator (StdDev), which gives an additional filter for confirming trading signals. In addition, the color of the indicator's lines shows the beginning of a trend, its development and exhaustion. This indicator has a signal block that notifies the trader of the beginning of the trend on any time frame to which it is attached. Settings Type of messages - select the type of
30 USD
Introduction The "Two Moving Average Crossover" indicator for MetaTrader 5 (MT5) is a technical analysis tool that displays two moving averages and notifies when the moving averages cross each other. The indicator calculates and plots two moving averages, one of which is faster and the other is slower. When the faster moving average crosses above the slower moving average, it is considered a bullish signal, indicating a potential trend reversal or the start of a new uptrend. Conversely, when th
35 USD
PipFinite Strength Meter MT5
Karlo Wilson Vendiola
5 (1)
How To Determine If The Market is Strong Or Weak? Strength Meter uses an Adaptive Algorithm That Detect Price Action Strength In 4 Important Levels! This powerful filter gives you the ability to determine setups with the best probability. Features Universal compatibility to different trading systems Advance analysis categorized in 4 levels Level 1 (Weak) - Indicates us to WAIT. This will help avoid false moves Weak Bullish - Early signs bullish pressure Weak Bearish - Early signs bearish pre
88 USD
PipFinite Trend PRO MT5
Karlo Wilson Vendiola
4.87 (663)
Breakthrough Solution For Trend Trading And Filtering With All Important Features Built Inside One Tool! Trend PRO's smart algorithm detects the trend, filters out market noise and gives entry signals with exit levels. The new features with enhanced rules for statistical calculation improved the overall performance of this indicator. Important Information Revealed Maximize the potential of Trend Pro, please visit www.mql5.com/en/blogs/post/713938 The Powerful Expert Advisor Version Automa
98 USD
Fit line supports to extrapolation next movement of market, support for buy/sell decision. Indicator using spline algorithm to extrapolation.  You can change number of spline with parameter "PointsNumber" and number of extrapolation point with "ExtrapolateBars". Eextrapolation points will be save into csv format, with prefix in parameter "PointsPrefix", and store in folder File of Data Folder.
50 USD
Indicator and Expert Adviser  EA Available in the comments section of this product. Download with Indicator must have indicator installed for EA to work. Mt5 indicator alerts for bollinger band and envelope extremes occurring at the same time. Buy signal alerts occur when A bullish candle has formed below both the lower bollinger band and the lower envelope  Bar must open and close below both these indicators. Sell signal occur when A bear bar is formed above the upper bollinger band and upp
30 USD
For a trader, trend is our friend. This is a trend indicator for MT5, can be used on any symbol. just load it to the terminal and you will see the current trend. green color means bullish trend and red means bearlish trend. you can also change the color by yourself when the indicator is loaded to the MT5 terminal the symbol and period is get from the terminal automaticly. How to use: I use this trend indicator on 2 terminals with different period  for the same symbol at same time. for example M5
200 USD
Introducing the Power Trade Plus indicator designed by a small group of traders with a few years of experience trading the market profitably.  The Power Trade Plus is derived from the Power Trade indicator,  the indicator strive in powerful sniper entries and take profit levels,  with an algorithm that's can determine the markets volatility and Provides entries based on the current market volatility. This indicator is much more effective in stock ,currencies and indices.
250 USD
Технический индикатор Universal Oscillator является комбинацией торговых сигналов самых популярных и широко используемых осцилляторов. Индикатор представлен гистограммами, а также линиями fast и slow MA, что позволяет расширить список получаемых торговых рекомендаций и работать как по тренду, так и в боковом движении рынка. Таким образом, гистограммы позволяют определить момент пробоя ценовых значений и движение в новой фазе рынка, а линии указывают на зоны перекупленности и перепроданности.  Ос
30 USD
Was: $249  Now: $99   Market Profile defines a number of day types that can help the trader to determine market behaviour. A key feature is the Value Area, representing the range of price action where 70% of trading took place. Understanding the Value Area can give traders valuable insight into market direction and establish the higher odds trade. It is an excellent addition to any system you may be using. Inspired by Jim Dalton’s book “Mind Over Markets”, this indicator is designed to suit the
99 USD
Buyers of this product also purchase
Quantum Trend Sniper
Bogdan Ion Puscasu
5 (28)
Introducing   Quantum Trend Sniper Indicator , the groundbreaking MQL5 Indicator that's transforming the way you identify and trade trend reversals! Developed by a team of experienced traders with trading experience of over 13 years,   Quantum Trend Sniper Indicator   is designed to propel your trading journey to new heights with its innovative way of identifying trend reversals with extremely high accuracy. ***Buy Quantum Trend Sniper Indicator and you could get Quantum Breakout Indicator fo
149.99 USD
Description: First of all Its worth emphasizing here that this Trading System is Non-Repainting, Non-Redrawing and Non-Lagging Indicator, Which makes it ideal from both manual and robot trading.  For limited time only 50% OFF, Now 149$ Next price 300$. The user manual in the form of detailed blog, free online course and downloadable presets of the smart trend trading system are all  here . Join our Free Group and stay up-to-date on the Best Indicators and Experts:   Here The “Smart Trend Tra
149 USD
RelicusRoad Pro MT5
Relicus LLC
4.81 (21)
How many times have you bought a trading indicator with great back-tests, live account performance proof with fantastic numbers and stats all over the place but after using it, you end up blowing your account? You shouldn't trust a signal by itself, you need to know why it appeared in the first place, and that's what RelicusRoad Pro does best! NOW $147 (increasing to $499 after a few updates) - UNLIMITED ACCOUNTS (PCs or MACs) **  User Manual + Strategies + Training Videos + Private Group with
147 USD
TrendMaestro5
Stefano Frisetti
note: this indicator is for METATRADER4, if you want the version for METATRADER5 this is the link:  https://www.mql5.com/it/market/product/108106 TRENDMAESTRO recognizes a new TREND in the bud, he never makes mistakes. The certainty of identifying a new TREND is priceless. DESCRIPTION TRENDMAESTRO identifies a new TREND in the bud, this indicator examines the volatility, volumes and momentum to identify the moment in which there is an explosion of one or more of these data and therefore the mome
777 USD
Introducing   Quantum Breakout PRO , the groundbreaking MQL5 Indicator that's transforming the way you trade Breakout Zones! Developed by a team of experienced traders with trading experience of over 13 years,   Quantum Breakout PRO   is designed to propel your trading journey to new heights with its innovative and dynamic breakout zone strategy. Quantum Breakout Indicator will give you signal arrows on breakout zones with 5 profit target zones and stop loss suggestion based on the breako
149.99 USD
Description: First of all Its worth emphasizing here that this Trading Tool is Non-Repainting, Non-Redrawing and Non-Lagging Indicator, Which makes it ideal for professional trading and expert advisers. For limited time only 40% OFF, Now 60$  Next price 100$. Attention , the application might not work in the strategy tester,    Try Demo here before you buy:   here . Get a detailed blog, free online course and learn more about the Smart Price Action Concepts  here . Join our Free Group and
60 USD
Step into the realm of Forex trading with confidence and precision using XQ, a cutting-edge Forex indicator designed to elevate your trading game to unprecedented heights. Whether you're a seasoned trader or just stepping into the world of currency exchange, XQ Forex Indicator empowers you with the insights and signals needed to make informed trading decisions. The signal conditions are a combination of three indicators, and XQ Forex Indicator only display  medium and long-term trends . The ind
199 USD
FX Power MT5 NG
Daniel Stein
5 (4)
Trading GOLD, and currencies, with the dog walk strategy  - super smart Trading GOLD, and currencies, with the breakout strategy  - super easy Visit our all-new   Stein Investments Welcome Page   to get the latest information, updates and trading strategies. FX Power MT5 NG  is the next generation of our long-time very popular currency strength meter, FX Power.  And what does this next-generation strength meter offer? Everything you have loved about the original FX Power  PLUS GOLD/XAU st
149 USD
ICT, SMC, SMART MONEY CONCEPTS, SMART MONEY, Smart Money Concept, Support and Resistance, Trend Analysis, Price Action, Market Structure, Order Blocks, BOS/CHoCH,   Breaker Blocks ,  Momentum Shift,   Supply&Demand Zone/Order Blocks , Strong Imbalance,   HH/LL/HL/LH,    Fair Value Gap, FVG,  Premium  &   Discount   Zones, Fibonacci Retracement, OTE, Buy Side Liquidity, Sell Side Liquidity, BSL/SSL Taken, Equal Highs & Lows, MTF Dashboard, Multiple Time Frame, BigBar, HTF OB, HTF Market Structur
60 USD
PZ Swing Trading MT5
PZ TRADING SLU
5 (4)
Swing Trading is the first indicator designed to detect swings in the direction of the trend and possible reversal swings. It uses the baseline swing trading approach, widely described in trading literature. The indicator studies several price and time vectors to track the aggregate trend direction and detects situations in which the market is oversold or overbought and ready to correct. [ Installation Guide | Update Guide | Troubleshooting | FAQ | All Products ] Profit for market swings with
249 USD
FX Volume MT5
Daniel Stein
4.94 (16)
Visit our all-new   Stein Investments Welcome Page   to get the latest information, updates and trading strategies. FX Volume is the FIRST and ONLY volume indicator that provides a REAL insight into the market sentiment from a broker's point of view. It provides awesome insights into how institutional market participants, like brokers, are positioned in the Forex market, much faster than COT reports. Seeing this information directly on your chart is the real game-changer and breakthrough solut
229 USD
Quantum Heiken Ashi PRO MT5
Bogdan Ion Puscasu
4.5 (8)
Introducing the Quantum Heiken Ashi PRO charts with integrated alerts Designed to provide clear insights into market trends, the Heiken Ashi candles are renowned for their ability to filter out noise and eliminate false signals. Say goodbye to confusing price fluctuations and hello to a smoother, more reliable chart representation. What makes the Quantum Heiken Ashi PRO truly unique is its innovative formula, which transforms traditional candlestick data into easy-to-read colored bars. Red and g
99.99 USD
First of all Its worth emphasizing here that this Trading System is Non-Repainting, Non-Redrawing and Non-Lagging Indicator, Which makes it ideal from both manual and robot trading.  For limited time only 50% OFF, Now 200$ Next price 400$. Get a detailed blog and learn more about the Atomic Analyst  here . Join our Free Group and stay up-to-date on the Best Indicators and Experts:   Here The Atomic Analyst is the Number #1 PA Price Action Indicator that uses Strength and Momentum of the pri
200 USD
Top indicator for MT5   providing accurate signals to enter a trade without repainting! It can be applied to any financial assets:   forex, cryptocurrencies, metals, stocks, indices .  Watch  the video  (6:22) with an example of processing only one signal that paid off the indicator! MT4 version is here It will provide pretty accurate trading signals and tell you when it's best to open a trade and close it. Most traders improve their trading results during the first trading week with the help of
125 USD
TPSproTREND PrO MT5
Roman Podpora
5 (5)
TPSpro TRENDPRO  - is a trend indicator that automatically analyzes the market and provides information about the trend and each of its changes, as well as giving signals for entering trades without redrawing! The indicator uses each candle, analyzing them separately. referring to different impulses - up or down impulse. Exact entry points into transactions for currencies, crypto, metals, stocks, indices!  -    To maximize the potential and learn how to trade using this indicator, read the full
135 USD
TPA True Price Action indicator reveals the true price action of the market makers through 100% non-repainting signals strictly at the close of a candle! TPA shows entries and re-entries, every time the bulls are definitely stronger than the bears and vice versa. Not to confuse with red/green candles. The shift of power gets confirmed at the earliest stage and is ONE exit strategy of several. There are available now two free parts of the TPA User Guide for our customers. The first "The Basics"
168 USD
IX Power   finally brings the unbeatable precision of FX Power to non-Forex symbols. It accurately determines the intensity of short, medium and long-term trends in your favourite indices, stocks, commodities, ETFs, and even cryptocurrencies. You can   analyse everything   your terminal has to offer. Try it out and experience how   your timing improves significantly   when trading. Read about our latest strategic development -  Easy scalping with IX Power Visit our all-new   Stein Investments
89 USD
Golden Gate Algo MT5
James David Lane
4.6 (5)
30% OFF NOW! PRICE INCREASING MARCH 30TH! Introducing GoldenGate Algo: A Cutting-Edge Trading Solution!  Discover a revolutionary approach to trading with GoldenGate Algo (GGA), an advanced indicator designed to elevate your trading experience. GGA provides a comprehensive set of features to empower users with precision and confidence in their trading decisions. No re-painting! Pairs:   Any TimeFrames:   15m up to H1 Key Features: Buy and Sell Arrow Indications:   Receive Buy and Sell arr
149 USD
Gann Squares Indicator: Analyzing Markets with Geometric Patterns The Gann Squares indicator is a powerful tool for market analysis that draws upon the mathematical concepts introduced by W.D. Gann in his article on "Mathematical Formula for Market Predictions." This indicator incorporates Gann's techniques involving square numbers such as 144, 90, and 52, as well as the Square of 9. Additionally, it incorporates  method for utilizing the Square of 9 in conjunction with channels and the star pa
200 USD
The Price Action Finder Multi indicator is an indicator of entry points that searches for and displays Price Action system patterns on dozens of trading instruments and on all standard time frames: (m1, m5, m15, m30, H1, H4, D1, Wk, Mn). The indicator places the found patterns in a table at the bottom of the screen. By clicking on the pattern names in the table, you can move to the chart where this pattern is located. Manual (Be sure to read before purchasing) | Version for MT4 Advantages 1. Pa
149 USD
Volume by Price MT5
Brian Collard
5 (3)
Was: $259 Now: $120 — The Volume by Price Indicator for MetaTrader 5 features Volume Profile and Market Profile TPO (Time Price Opportunity). Get valuable insights out of currencies, equities and commodities data. Gain an edge trading financial markets. Volume and TPO histogram bar and line charts. Volume Footprint charts. TPO letter and block marker charts including split structures. Versatile segmentation and compositing methods. Static, dynamic and flexible ranges with relative and/or absolu
120 USD
Blahtech Supply Demand MT5
Blahtech Limited
4.57 (14)
Was: $299  Now: $99   Supply Demand uses previous price action to identify potential imbalances between buyers and sellers. The key is to identify the better odds zones, not just the untouched ones. Blahtech Supply Demand indicator delivers functionality previously unavailable on any trading platform. This 4-in-1 indicator not only highlights the higher probability zones using a multi-criteria strength engine, but also combines it with multi-timeframe trend analysis, previously confirmed swings
99 USD
Reversal First Impulse levels (RFI)   - are the   maximum volume   levels/areas that turn the market around, so they play a critical role in future trading decisions. The logic behind the movement of any chart is that the price moves from the first impulse level (RFI) to the first impulse level (RFI) of the past trend. The first impulse level (RFI) is the most powerful level during a trend reversal, which forms a reversal zone. The first impulse level from the reversal of the previous movement
145 USD
Advanced Supply Demand MT5
Bernhard Schweigert
4.53 (15)
Best Solution for any Newbie or Expert Trader! This indicator is a unique, high quality and affordable trading tool because we have incorporated a number of proprietary features and a new formula. With this update, you will be able to show double timeframe zones. You will not only be able to show a higher TF but to show both, the chart TF, PLUS the higher TF: SHOWING NESTED ZONES. All Supply Demand traders will love it. :) Important Information Revealed Maximize the potential of Advanced Suppl
199 USD
This is the MT5 version of Extreme Reversal Sniper MT4 Indicator Extreme Value Sniper is a detrended price indicator Indicator finds the potential reversal levels by checking value ranges and price cycles. ***Indicator does NOT repaint so it provides accurate NO REPAINT REVERSAL SIGNALS***  MT4 Version of the Indicator:  https://www.mql5.com/en/market/product/114426 It shows the overbought and oversold levels using the average range. Overbought Levels are between 4 and 10 Oversold levels a
120 USD
Bill Williams Advanced
Siarhei Vashchylka
5 (2)
Bill Williams Advanced is designed for automatic chart analysis using Bill Williams' "Profitunity" system. The indicator analyzes four timeframes at once. Manual (Be sure to read before purchasing) Advantages 1. Automatically analyzes the chart using the "Profitunity" system of Bill Williams. The found signals are placed in a table in the corner of the screen. 2. Equipped with a trend filter based on the Alligator indicator. Most of the system signals are recommended to be used only accordi
299 USD
Gartley Hunter Multi
Siarhei Vashchylka
5 (5)
Gartley Hunter Multi - An indicator for searching for harmonic patterns simultaneously on dozens of trading instruments and on all classic timeframes: (m1, m5, m15, m30, H1, H4, D1, Wk, Mn). Manual (Be sure to read before purchasing) | Version for MT4 Advantages 1. Patterns: Gartley, Butterfly, Shark, Crab. Bat, Alternate Bat, Deep Crab, Cypher 2. Simultaneous search for patterns on dozens of trading instruments and on all classic timeframes 3. Search for patterns of all possible sizes. Fr
149 USD
Italo Levels Indicator MT5
Italo Santana Gomes
3 (2)
BUY INDICATOR AND GET EA FOR FREE AS A BONUS + SOME OTHER GIFTS! ITALO LEVELS INDICATOR  is the best levels indicator ever created, and why is that? Using high volume zones on the market and Fibonacci the Indicator works on all time-frames and assets, indicator built after 7 years of experience on forex and many other markets. You know many levels indicators around the internet are not complete, does not help, and it's difficult to trade, but the   Italo Levels Indicator is different , the Ital
65 USD
Matrix Arrow Indicator MT5
Juvenille Emperor Limited
5 (14)
Matrix Arrow Indicator MT5  is a unique 10 in 1 trend following   100% non-repainting  multi-timeframe indicator that can be used on all symbols/instruments:   forex,   commodities,   cryptocurrencies,   indices,   stocks .  Matrix Arrow Indicator MT5  will determine the current trend at its early stages, gathering information and data from up to 10 standard indicators, which are: Average Directional Movement Index (ADX) Commodity Channel Index (CCI) Classic Heiken Ashi candles Moving Aver
75 USD
Gold TMAF MTF  - this is a best stock technical indicator. The indicator algorithm analyzes the price movement of an asset and reflects volatility and potential entry zones. The best indicator signals: For SELL = red upper boundary of TMA2 above the red upper boundary of TMA1 + red fractal indicator above + yellow SR signal arrow in the same direction. For BUY = blue lower boundary of TMA2 below the blue lower boundary of TMA1 + blue fractal indicator from below + aqua SR signal arrow in the s
99 USD
More from author
Elder MACD Combo
Financial Trading Seminars Inc.
MACD Histogram tracks the difference between the MACD line and the Signal line (which is the exponential moving average of the first line). For better visibility, when plotting the lines and the histogram in the same window, we scale up the histogram by a factor of 2. Furthermore, we use two separate plots for the histogram, which allows us to color-code the bars for upticks and downticks. The MACD Combo overlays MACD lines on MACD Histogram. Putting both plots in the same window enables you to
30 USD
Elder Impulse Release
Financial Trading Seminars Inc.
The purpose of Impulse Release is to prevent trading in the wrong direction. While the Impulse System operates in a single timeframe, Impulse Release is based on two timeframes. It tracks both the longer and the shorter timeframes to find when the Impulse points in the same direction on both. Its color bar flashes several signals: If one timeframe is in a buy mode and the other in a sell mode, the signal is "No Trade Allowed", a  black bar. If both are neutral, then any trades are allowed, showi
39 USD
Elder Chandelier Long Exit
Financial Trading Seminars Inc.
The Chandelier Exit, introduced by Charles LeBeau, is described in "Come into My Trading Room" book. It calculates each stop on a long position in an uptrend from the highest point reached during that rally, and gets its name from the chandelier, which hangs from the highest point in the room. The Chandelier Exit uses a multiple of the Average True Range (ATR), subtracting it from the highest high since the trade was entered. It creates a new trade whenever the previous trade is stopped out. Ch
30 USD
Elder Chandelier Long Entries
Financial Trading Seminars Inc.
One of the key rules in trading is never move your stops in such a way that your risk increases. Our stop sequence shows the automatic tightening of stops. They appear as a series of decreasing risk points until the trade is eventually stopped out. The problem is that if you enter a trade at any other point than the initial dot of the sequence, you may be placing the stop too close. Stop-entry plots show you the initial value for the stop for each bar. You can use them when you put on a trade,
30 USD
Elder Chandelier Short Exit
Financial Trading Seminars Inc.
The Chandelier Exit, introduced by Charles LeBeau, is described in "Come into My Trading Room" book. It calculates each stop on a short position in a downtrend from the lowest point reached during that decline. The Chandelier Exit uses a multiple of the Average True Range (ATR), adding it to the lowest low since the trade was entered. It creates a new trade whenever the previous trade is stopped out. Chandelier Stops differ from traditional stops by having the ability to move against you if the
30 USD
Elder Chandelier Short Entries
Financial Trading Seminars Inc.
One of the key rules in trading is never move your stops in such a way that your risk increases. Our stop sequence shows the automatic tightening of stops. They appear as a series of decreasing risk points until the trade is eventually stopped out. The problem is that if you enter a trade at any other point than the initial dot of the sequence, you may be placing the stop too close. Stop-entry plots show you the initial value for the stop for each bar. You can use them when you put on a trade,
30 USD
Elder ray
Financial Trading Seminars Inc.
Elder-Ray is made of both Bulls Power and Bears Power as described in "Come into my Trading Room" book. It is tracking the relative power of bulls and bears by measuring how far the high and the low of each bar get away from the average price. Elder-ray is an indicator developed by Dr. Elder and named for its similarity to x-rays. It shows the structure of bullish and bearish power below the surface of the markets. Elder-ray combines a trendfollowing moving average with two oscillators to show w
30 USD
Elder Impulse System
Financial Trading Seminars Inc.
The Impulse System was first described in "Come into my Trading Room" book. It uses the direction of both the MACD-Histogram and an exponential moving average (EMA) of price to define an impulse. The rule is never to trade against the impulse. Its color code gives you several signals: When both the EMA and MACD-Histogram are rising, the Impulse system colors the bar color is green (no shorting permitted). When both the EMA and MACD-Histogram are falling, the Impulse system colors the bar color i
39 USD
Elder MACD XOver
Financial Trading Seminars Inc.
The MACD XOver indicator was developed by John Bruns to predict the price point at which MACD Histogram will reverse the direction of its slope. The indicator is plotted one day ahead into the future, allowing, if your strategy depends on MACD Histogram, to predict its reversal point for tomorrow (or the next bar in any timeframe). If the closing price tomorrow is above the value of this indicator, then MACD Histogram will tick up. If the closing price tomorrow is below the value of this indica
39 USD
Elder Market Thermometer
Financial Trading Seminars Inc.
The Market Thermometer is described in "Come into my Trading Room" book.  It measures the degree of volatility, as reflected in greater or smaller intraday ranges. When the Market Temperature spikes above its average or stays below its average for a number of days, it gives trading signals, as described in the book. Parameters: Thermometer_EMA_Length (22) – The length of the moving average of the Market Temperature. The default 22, the average number of trading days in a month. Spike_Alert_Facto
30 USD
Elder SafeZone Long
Financial Trading Seminars Inc.
SafeZone is a method for setting stops on the basis of recent volatility, outside the level of market noise. It is described in "Come into my Trading Room" book. In an uptrend, SafeZone defines noise as that portion of the current bar that extends below the low of the previous bar, going against the prevailing trend. It averages the noise level over a period of time and multiplies it by a trader-selected factor. For long trades, SafeZone subtracts the average noise level, multiplied by a facto
30 USD
Elder SafeZone Long Entries
Financial Trading Seminars Inc.
One of the key rules in trading is never move your stops in such a way that your risk increases. Our stop sequence shows the automatic tightening of stops. They appear as a series of decreasing risk points until the trade is eventually stopped out. The problem is that if you enter a trade at any other point than the initial dot of the sequence, you may be placing the stop too close. Stop-entry plots show you the initial value for the stop for each bar. You can use them when you put on a trade,
30 USD
Elder SafeZone Short
Financial Trading Seminars Inc.
SafeZone is a method for setting stops on the basis of recent volatility, outside the level of market noise. It is described in "Come into my Trading Room" book. In a downtrend, SafeZone defines noise as the portion of the current bar that extends above the high of the previous bar, against the downtrend. It averages the noise level over a period of time and multiplies it by a trader-selected factor. For short trades, it adds the average noise level, multiplied by a factor, to the latest high
30 USD
Elder SafeZone Short Entries
Financial Trading Seminars Inc.
One of the key rules in trading is never move your stops in such a way that your risk increases. Our stop sequence shows the automatic tightening of stops. They appear as a series of decreasing risk points until the trade is eventually stopped out. The problem is that if you enter a trade at any other point than the initial dot of the sequence, you may be placing the stop too close. Stop-entry plots show you the initial value for the stop for each bar. You can use them when you put on a trade,
30 USD
Elder Smoothed ROC
Financial Trading Seminars Inc.
The Smoothed ROC indicator, developed by Fred Schutzman, is described in "Trading for a Living" book. It is created by calculating the rate of change for an exponential moving average of closing prices. When it changes direction, it helps identify and confirm trend changes. Parameters Smoothing_EMA_Length (13) – The length of the EMA used for smoothing; ROC_Period (21) – The length of the rate of change calculation.
30 USD
Filter:
Алексей Маврин
35
Алексей Маврин 2022.06.12 05:58 
 

Добрый день, Александр. После обновления mt5 перестали работать ваши индикаторы MACD и Force index. Первый обновил до последней версии и всё заработало, а вот индекс силы последний раз обновлялся в 2017г. и не может быть использован. Просьба обновить (перекомпилировать) до актуальной версии mt5. Заранее спасибо. "2022.01.30 17:26:53.490 MQL5 'Elder Force Index With ATR Channels.ex5' version is too old, it should be recompiled"

Reply to review
Version 3.0 2024.01.21
Fixed
- Compute of moving average of FI
- Display of spike signals
- Bands line types
- ATR modifier usage
- Product description updated

New
- Possibility to customize the color and the sign of spikes

Version 2.0 2023.06.24
New version, built and compiled on latest MT5 version