AIS Advanced Grade Feasibility MT5
- Indicators
- Aleksej Poljakov
- Version: 1.1
- Updated: 24 June 2022
- Activations: 5
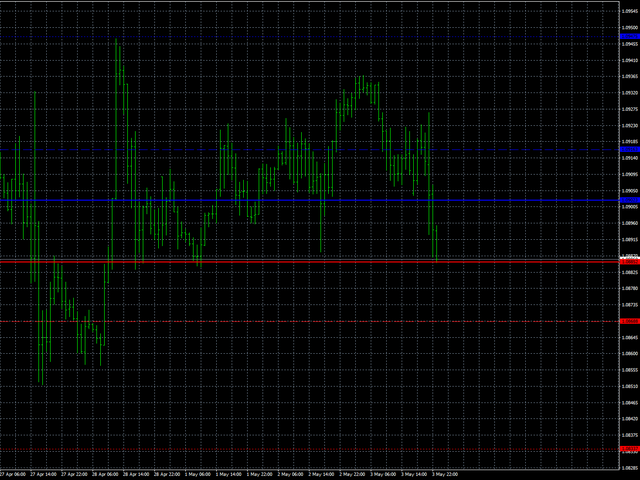
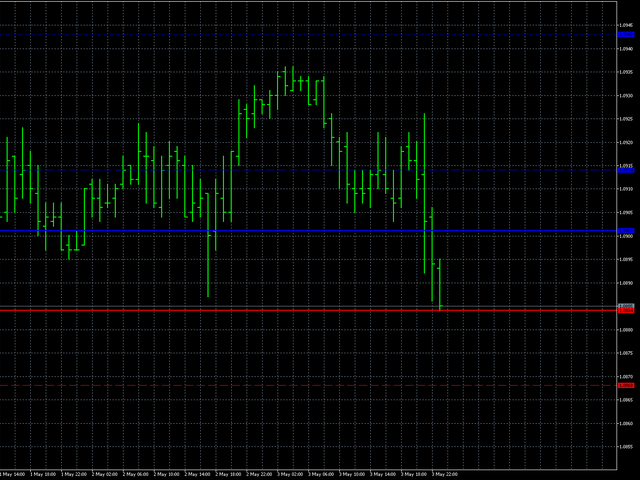
The AIS Advanced Grade Feasibility indicator is designed for forecasting levels that a price can reach in future. Its operation is based on the analysis of the last three bars and creating the forecast. The indicator can be used on any timeframe and any currency pair. Using settings, you can achieve the desired quality of the forecast.
- Depth of forecast - sets the desired depth of forecast in bars. The recommended values for these parameters are 18-31.
You can try beyond this range. But in this case, forecast levels can "stick together" (for values less than 18), or can be excessively wide (for values greater than 31).
- Confidence level 1, Confidence level 2 and Confidence level 3 - levels of forecast confidence. Set within the range of 1-99. Confidence level 1 must be greater than Confidence level 2, and Confidence level 3 - must be the smallest one.
Each of these levels shows the percentage probability of the price reaching this value during the number of bars defined in the Depth of forecast parameter.
- Color lvl high and Color lvl low - set line colors
- Style lvl - set the style of lines of appropriate levels
- Width lvl - set the width of lines of appropriate levels

User didn't leave any comment to the rating