Goal Renko
- Indicators
-
Huy Hoang Hong
 I trade gold (XAUUSD) by hand with Renko waves, and I build tools around one method, Goal Renko.
- Version: 1.0
Goal Renko marks, on your normal candlestick chart, where a Renko wave on gold (XAUUSD) completes a reversal pattern. You can scroll back and see how each signal ended. It builds Traditional Renko bricks internally from the candle closes of your chart, so you need no offline or custom Renko chart. Each signal is printed as a BUY or SELL label on the candle where it happened.
It works on its own and has no time limit. It does not open, manage or close trades.
What you see on the chart
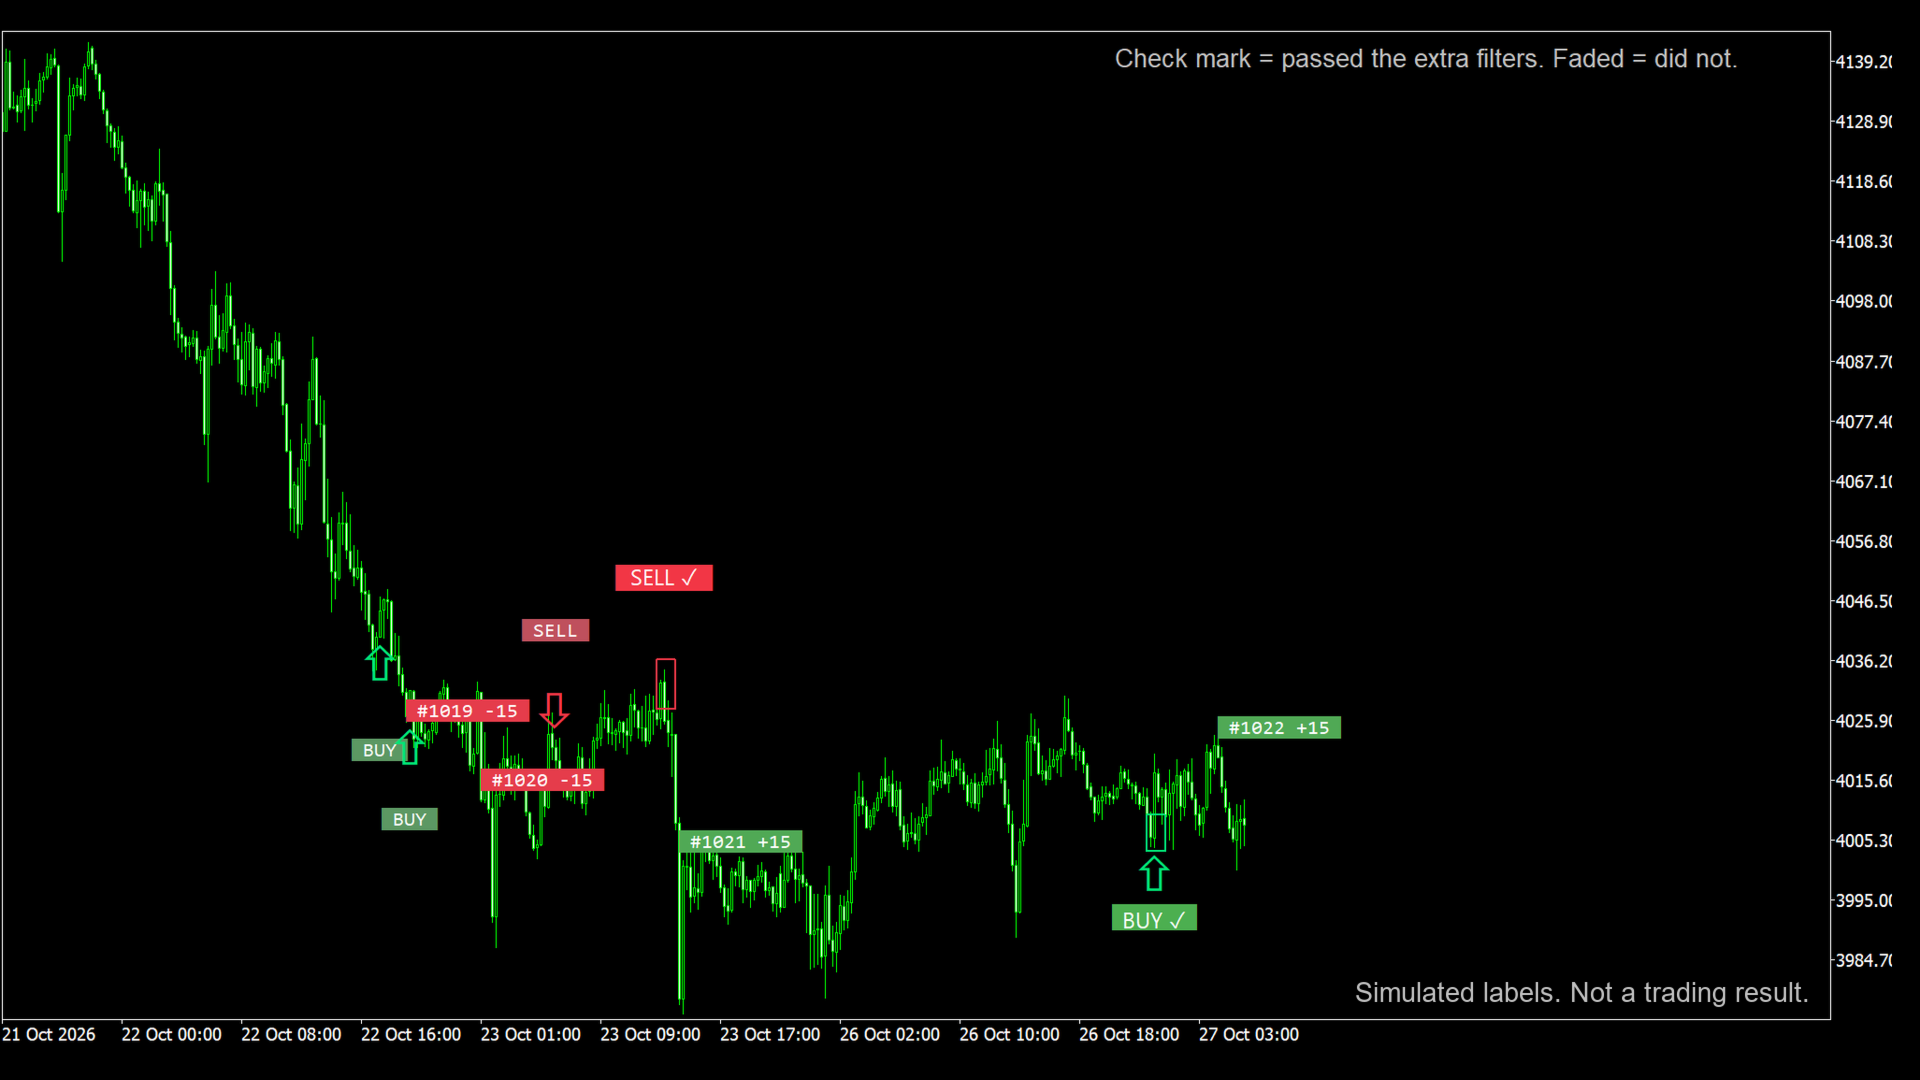
BUY and SELL labels appear when a two-point wave pattern completes. A label with a check mark passed the built-in extra filters; a faded label without the mark did not. Labels marked 3P come from a three-point pattern. A thin box highlights each confirmed signal.
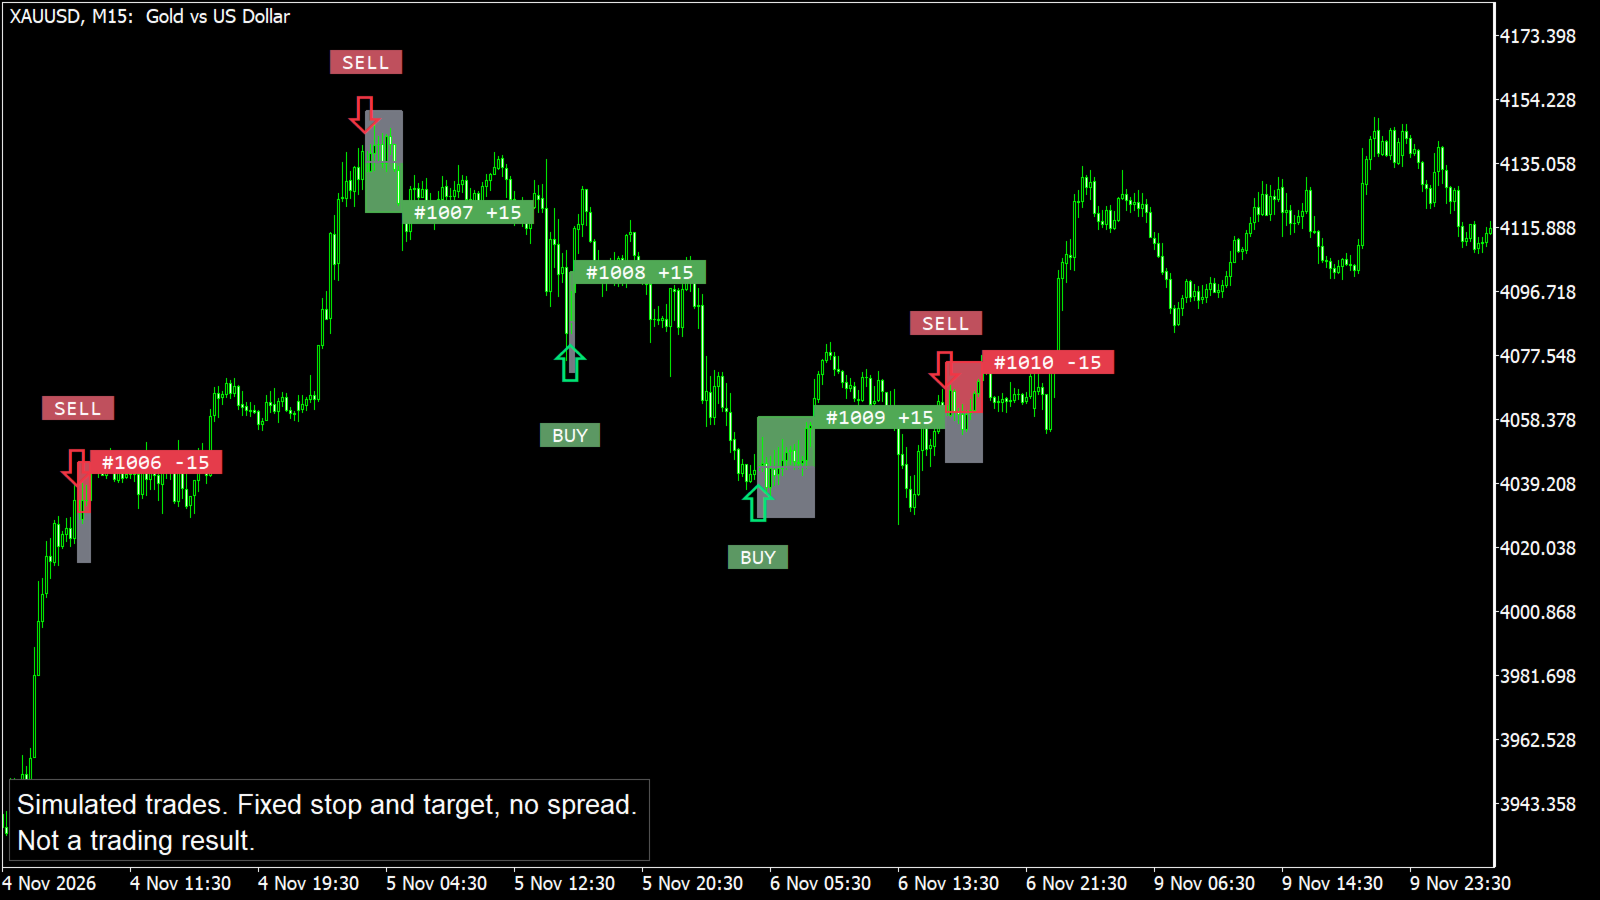
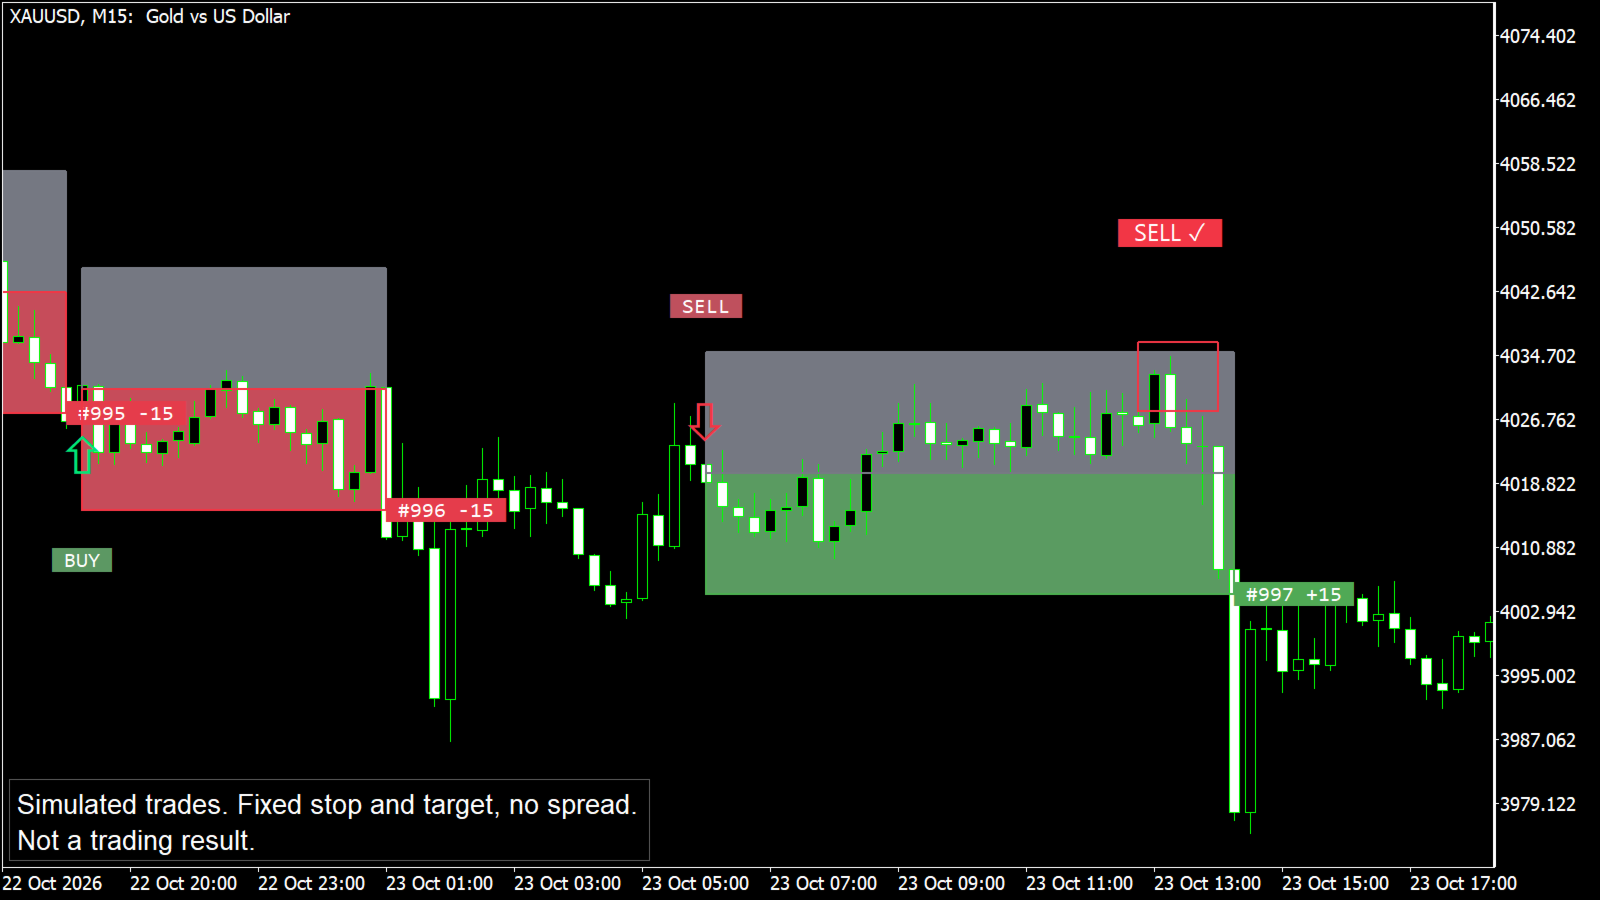
For every counted signal the indicator draws a simulated trade with a fixed stop loss and take profit: an entry arrow, a target zone and a stop zone, and a small result label at the exit (for example #12 +15 or #13 -15). The zones change colour when the simulated trade closes, so you can scroll back and study how each signal ended.
A statistics table summarises these simulated trades: trades, wins, losses, win rate, net points, profit factor, average per trade, longest losing streak, BUY and SELL results, and signals skipped while a simulated trade was open. An optional forward tracker counts only trades from a date you choose.
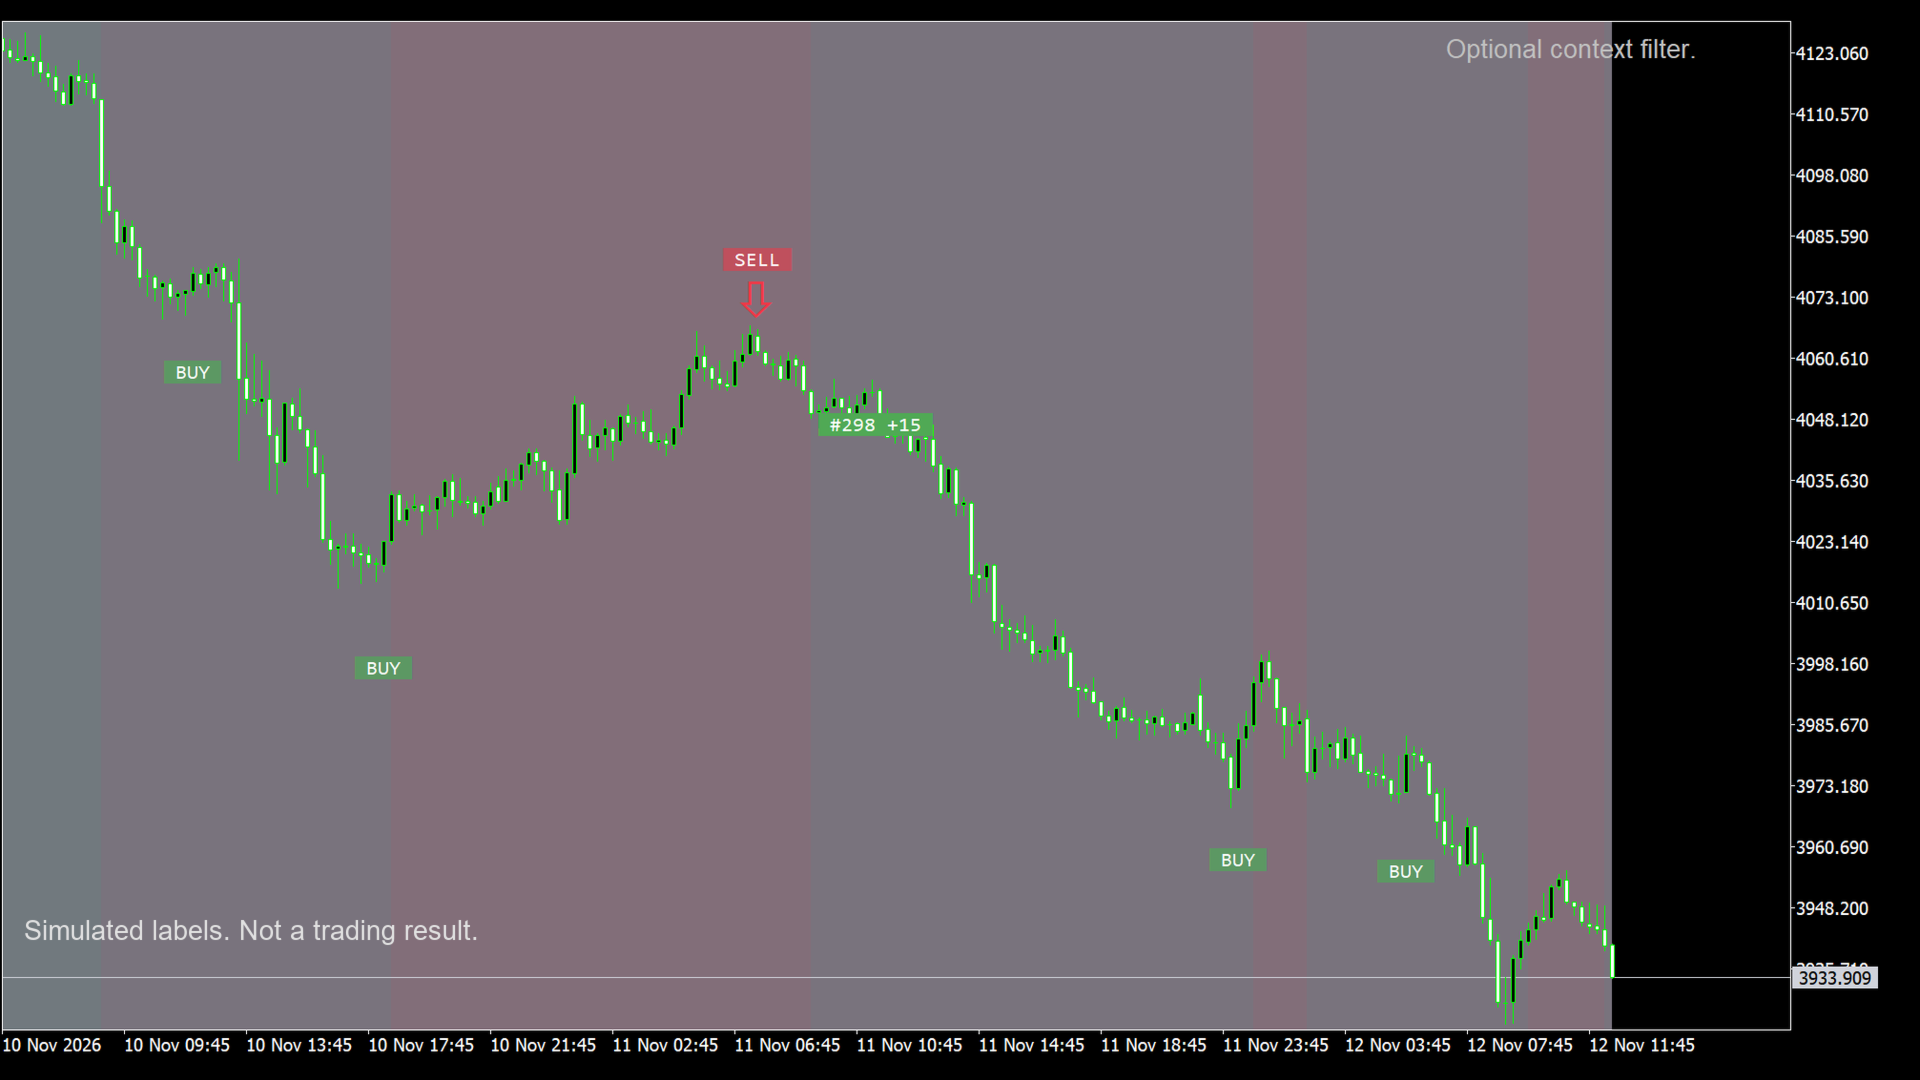
An optional context filter can limit signals to the larger direction and tint the background.
How to read the statistics table
The table is a simulation on the history loaded in your terminal. It enters at the brick price of the signal and counts a fixed stop and target in price units, without spread, commission or slippage. A brick price is usually not a price you could have traded at when the candle closed, and it does not model your own entries. Treat it as a way to study the signals, not as a trading result. Real trading includes spread and a different fill price, so real results will differ and are usually worse.
Signals are calculated on closed candles only. A label is drawn only after its candle has closed and does not change afterwards, and reloading the chart gives the same labels on the same history.
Each broker has its own gold price feed. Bricks are built from your broker's candle closes, so labels on two brokers, or on MetaTrader and another platform, can differ on some signals. This is expected.
Recommended use
XAUUSD, M15, default settings. The default brick size is in price units and was chosen for gold. The indicator runs on other symbols and timeframes, but you must set a brick size that fits that symbol's price scale yourself.
Use the labels as one view of where a wave may be ending, together with your own analysis and risk rules. The indicator shows one way of reading the market. It does not tell you how much to risk.
Testing it
In the Strategy Tester, choose visual mode, XAUUSD, M15. The labels, zones and table are drawn as the test runs. The first signals need some history to warm up.
User guide
Installing and starting
1. Download the indicator from the Market tab of your MetaTrader 5 terminal. It appears in the Navigator under Indicators, Market.
2. Open an XAUUSD chart and set the timeframe to M15.
3. Drag the indicator onto the chart and press OK. The default settings are made for gold on M15.
4. Wait a moment while it reads the chart history. Labels, zones and the table then appear. More history on the chart gives more past signals.
Reading the labels
1. BUY or SELL with a check mark: the pattern completed and passed the extra filters. These labels are less frequent.
2. Faded BUY or SELL without the mark: the pattern completed but did not pass the extra filters. By default (Signal source = All signals) the simulation counts every BUY and SELL label, with or without the mark.
3. 3P: a signal from the three-point pattern.
4. Arrow: the candle where a simulated trade starts. The entry price is the close of the signal brick formed in that candle, which is usually not the same as the candle close.
5. Target zone and stop zone: the fixed target and stop of that simulated trade. When the trade ends, the side that was hit turns solid (green for target, red for stop) and the other side turns grey. If one candle touches both, the trade is counted as a loss.
6. Exit label such as #12 +15: trade number and result in price units.
Settings you can change
1. Box size (price units): the size of one Renko brick. For gold, 1.5 means a brick of 1.50 in price. A smaller box gives more bricks and more signals, a larger box gives fewer. On another symbol, choose a box that fits its price scale; as a starting point use a value near the typical range of one candle on your timeframe.
2. Stop loss and Take profit (price units): the fixed distances used by the simulated trades and the table. 15 means 15.00 in gold price. Changing them changes only the simulation and drawings, not the BUY and SELL labels. Alerts follow the simulated entries, so they can change too.
3. Side to count: BUY + SELL, BUY only or SELL only.
4. Signal source: All signals (default) counts every label; Confirmed only counts only labels with the check mark.
5. Stats window: 0 counts all simulated trades in the loaded history; a number N counts only the last N.
6. Show statistics table, Table position, Table text size: turn the table on or off and place it where it does not cover price.
7. Context filter: Off, Trend aligned or Pullback only, with its own context box size and a background tint you can switch off.
8. Structure filter: on by default. Leave it on unless you are testing your own ideas.
9. Forward tracker: switch it on and set a start date to count only the trades from that date, with a target number of trades. The date uses your broker's server time.
10. Trade drawing: switch zones, entry arrows and exit labels on or off, and set zone transparency for your chart colours.
11. Momentum length, signal settings and the per-candle brick limit are part of the pattern definition. Leave them at default unless you are testing your own ideas.
Alerts
Alerts are off by default. In the Alerts group, switch on Entry BUY and Entry SELL to be told when a simulated trade opens (signals that appear while a simulated trade is already open are skipped and send no alert), then choose pop-up, push notification or e-mail. For push notifications or e-mail, fill in the Notifications or Email tab of the terminal options first.
Alert mode has two choices. Once per bar close sends one alert right after the signal candle has closed and the entry is final. Once per minute also warns you while the candle is still forming, at most once a minute, with the words "forming, not confirmed", so you can open the chart and watch; if the candle closes without the entry, no label is drawn. Alerts are not sent for history and work only while the terminal is running.
If something looks wrong
1. No labels: check that the chart has enough history and that Box size fits the symbol. A box that is too large for the price scale produces no bricks.
2. Too many labels on a non-gold symbol: the box is too small for that symbol. Increase it.
3. Labels differ from another broker or platform: price feeds differ, so bricks differ. Compare on the same broker.
4. The table covers candles: move it with Table position or switch it off.
5. Only the most recent labels are drawn on long histories. Older ones are still counted in the table.
Support
Please use the Comments section of this product. Tell me your broker, symbol name and timeframe, and attach a screenshot.
Risk notice
Trading leveraged products carries a high risk of loss. This indicator is an analysis tool. Its labels and its simulated statistics are not investment advice and are not a forecast of future results.