Multi Timeframe Average True Range MT5
- Indicators
- Version: 1.0

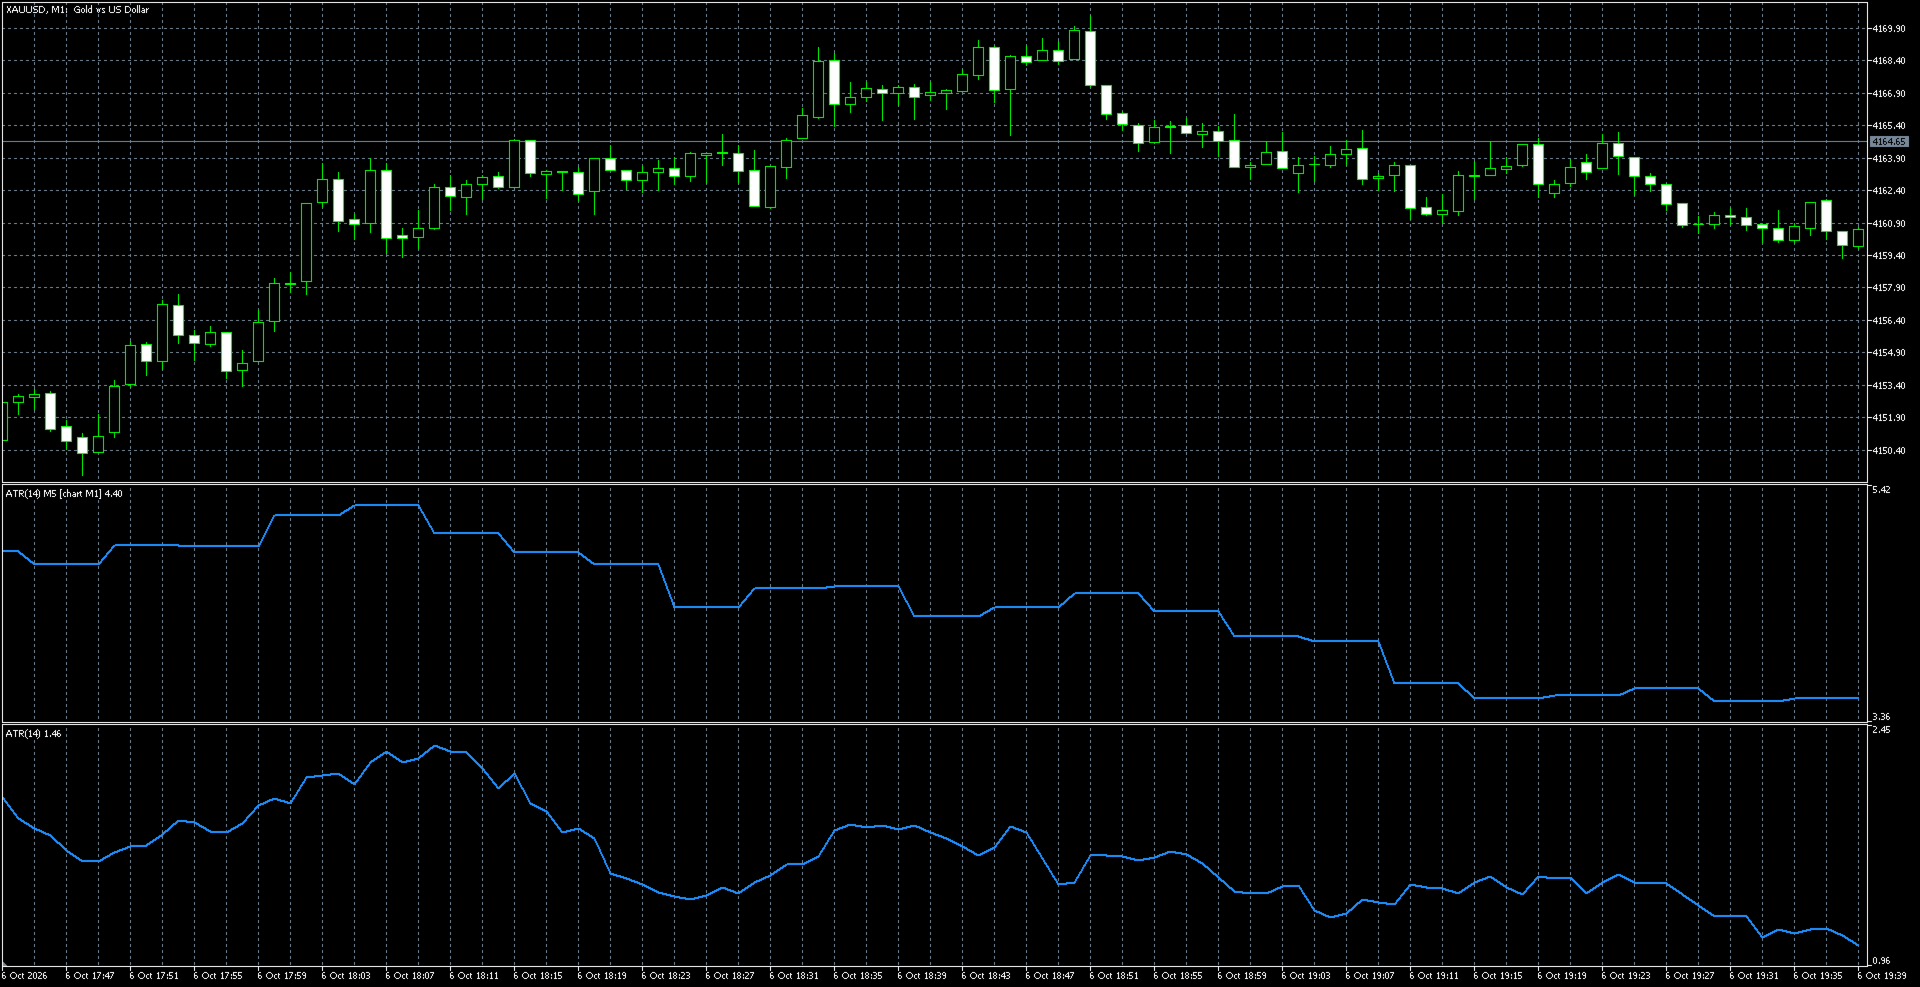
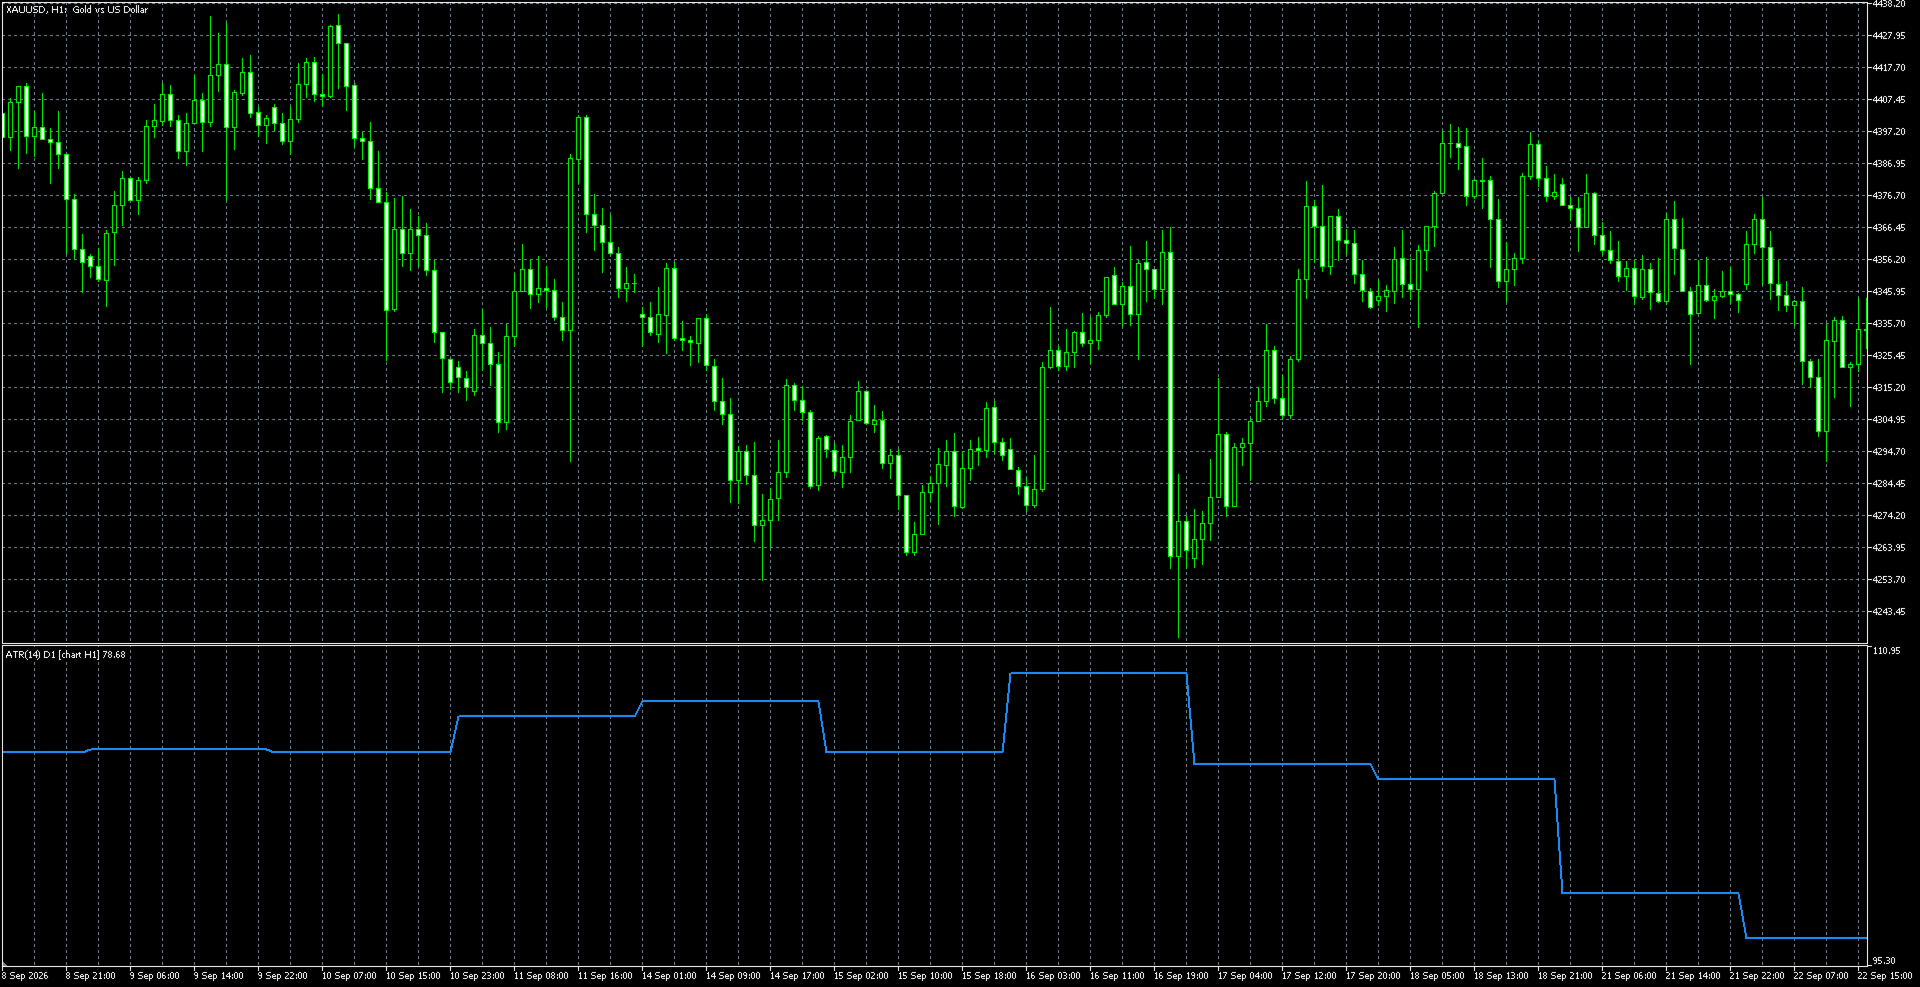
Multi Timeframe Average True Range shows the volatility (ATR) of ANY timeframe on the chart you are working on, for example the M15 or H1 ATR on an M1 chart. Set stops, targets and filters by the volatility of the timeframe you actually trade from.
Features
- Volatility of a selected timeframe on any chart (M1 to MN1)
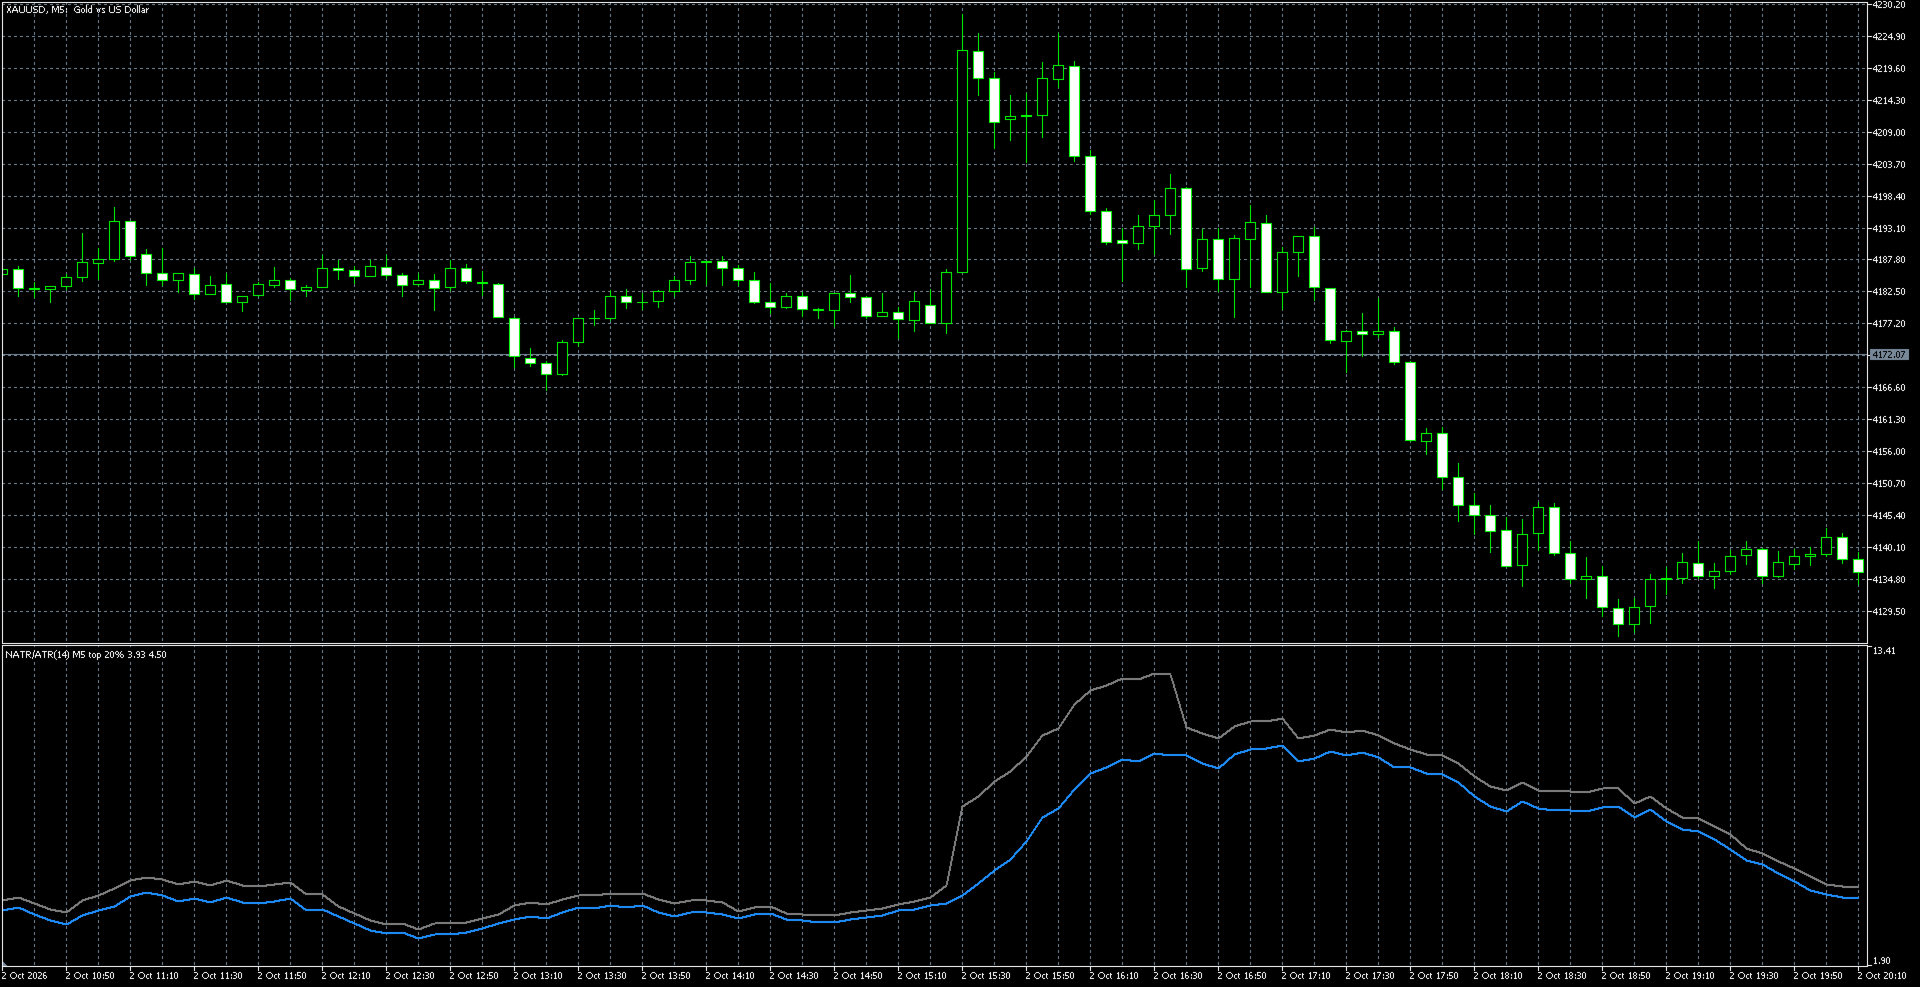
- Standard ATR or NATR (trimmed ATR): the largest True Ranges (or both extremes) are discarded before averaging, so a single news candle does not inflate the value
- Optional second line with the standard ATR, to compare it with NATR
- "Closed bar only" mode: the value of the last CLOSED bar of the selected timeframe. It does not change inside the bar and does not repaint
- Values in price units (like the standard ATR) or in points
- Protection against "stretching": if the chart timeframe is larger than the selected one, the indicator calculates on the chart timeframe (can be disabled)
- Loads the history of the selected timeframe automatically: on a symbol the terminal has not used yet the window may stay empty for a moment, then the line appears by itself, with no need to switch timeframes
- Light and fast: values are cached per higher-timeframe bar, and the number of calculated bars is limited by an input
- Does not trade and does not use DLLs, files or web requests
Inputs
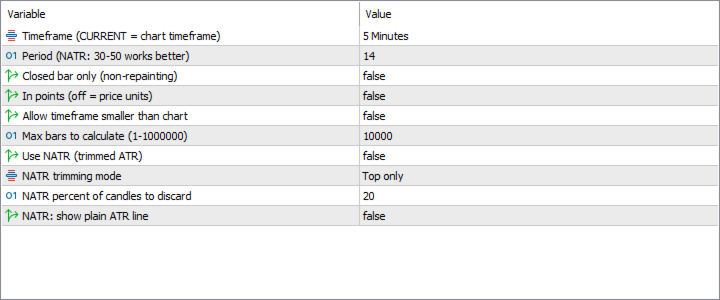
- Timeframe - timeframe whose volatility is shown (CURRENT = chart timeframe). Default: 5 Minutes
- Period - ATR period (for NATR, 30-50 usually works better). Default: 14
- Closed bar only - true = last closed bar (non-repainting), false = live bar
- In points - true = points, false = price units
- Allow timeframe smaller than chart - disables the "stretching" protection
- Max bars to calculate - how many of the latest chart bars are calculated (1-1000000). Default: 10000
- Use NATR - switch from standard ATR to trimmed ATR
- NATR trimming mode - Top only / Both sides
- NATR percent of candles to discard - for example, 20 = discard the 20% largest candles
- NATR: show plain ATR line - draws the standard ATR next to NATR
Notes
- With "Closed bar only" = false, the history shows the final value of each higher-timeframe bar (as any multi-timeframe indicator does). For signals use "Closed bar only" = true.
- Only the latest "Max bars to calculate" chart bars are calculated. Older bars stay empty on purpose, which keeps the indicator fast on long histories.
- If the selected timeframe has no history for the symbol, the window stays empty until the terminal loads it.
- This is a volatility tool, not a trading signal.