SATL Alligator AM
- Indicators
- Andriy Matviyevs'kyy
- Version: 26.0
- Updated: 21 September 2023
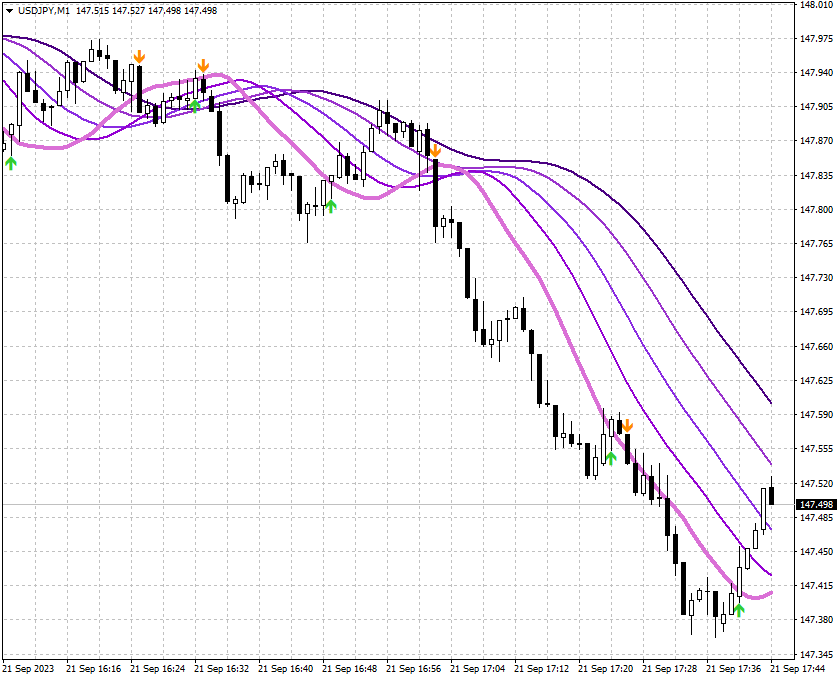
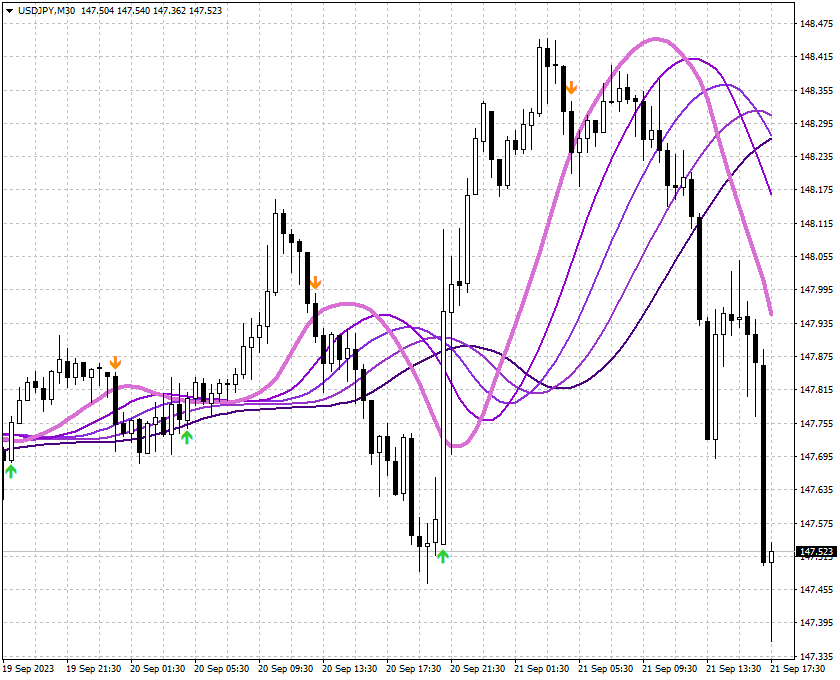
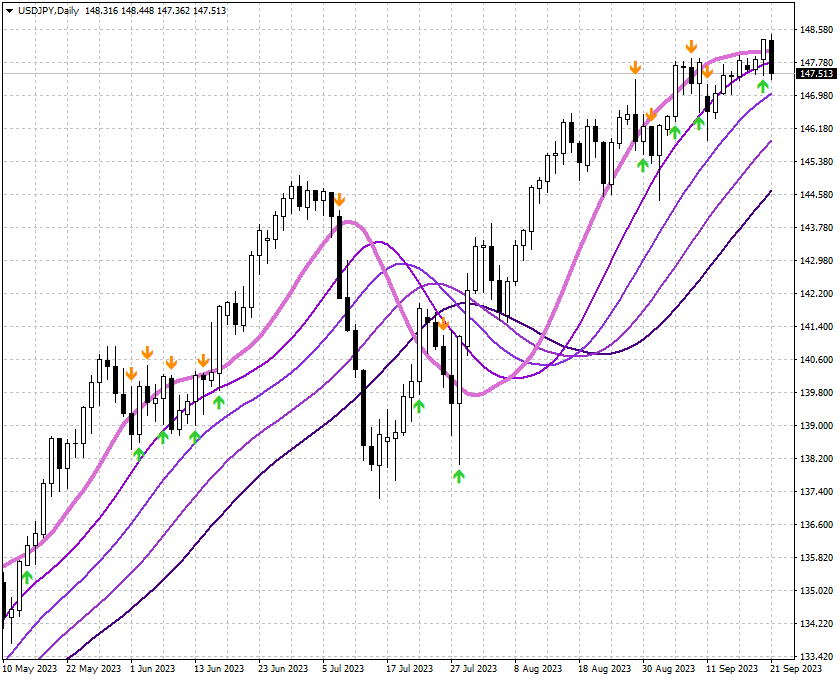
This indicator is a combination of classic trend indicator and signals of the slow digital filter.
The indicator has no configurable parameters.
The signals are displayed on completed bars and are not redrawn.
It shows high efficiency on periods less than 1 hour.
The usage principle is intuitive - trade in the direction shown by the fan of moving averages.
Enter once the price exceeds the High/Low of the bar where the signal was formed.
Exit on the opposite conditions.