Lines Profit Loss MT5
- Indicators
- Taras Slobodyanik
- Version: 4.0
- Updated: 10 September 2024
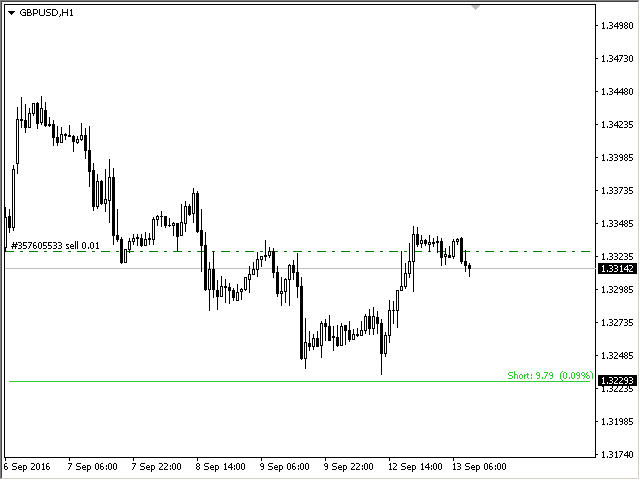
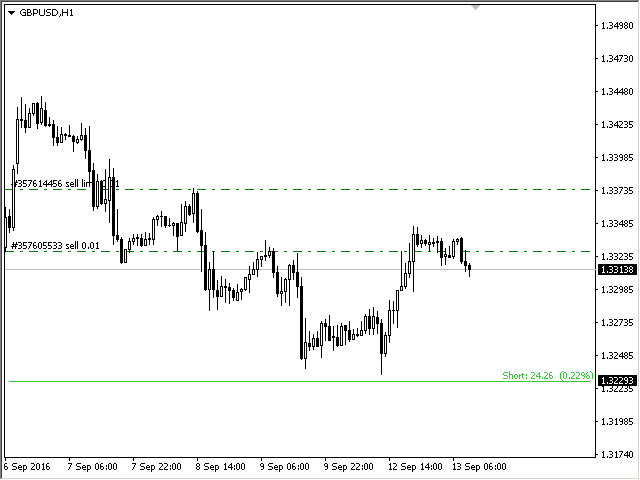
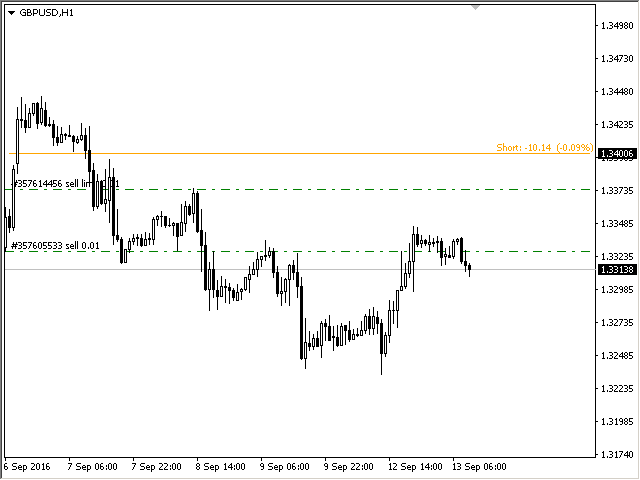
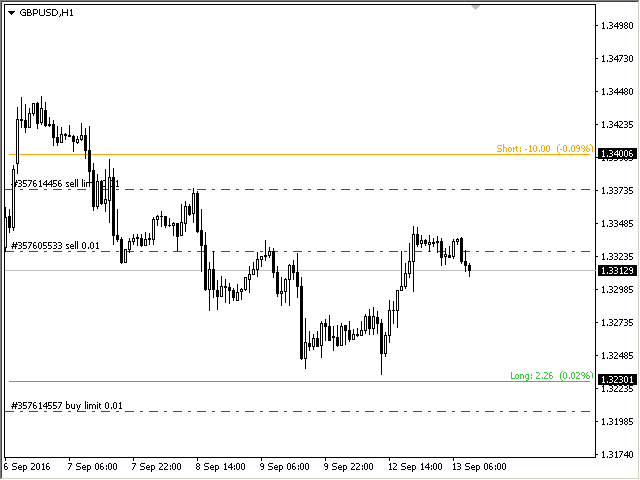
The indicator displays profit (loss) on the current symbol. You can freely drag and drop the line to display the current profit or loss.
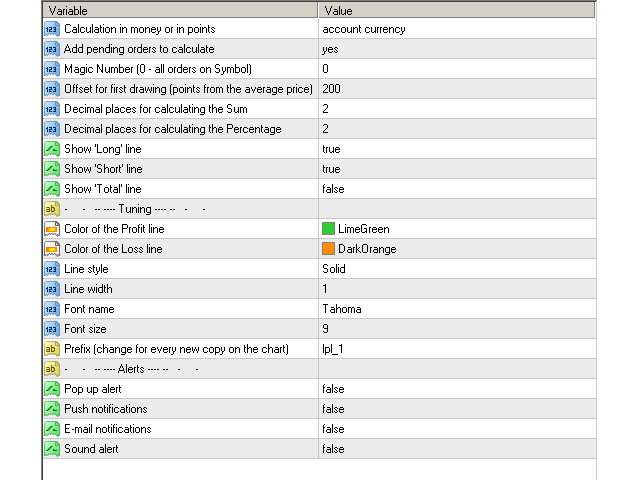
Parameters
- Calculation in money or in points — calculate the profit/loss in points or money.
- Add pending orders to calculate — take pending orders into account in calculations.
- Magic Number (0 - all orders on symbol) — magic number, if it is necessary to evaluate specific orders.
- Offset for first drawing (points from the average price) — offset of the line from the average price at first start.
- Decimal places for calculating the Sum — the number of digits after the decimal point to display the Sum.
- Decimal places for calculating the Percentage — the number of digits after the decimal point to display the Percentage.
Tuning
- Color of the profit line.
- Color of the loss line.
- Line style.
- Line width.
- Font name.
- Font size.
- Prefix (change for every new copy on the chart).


hay lắm