Visual TP SL Values
- Indicators
- Version: 1.2
- Activations: 5

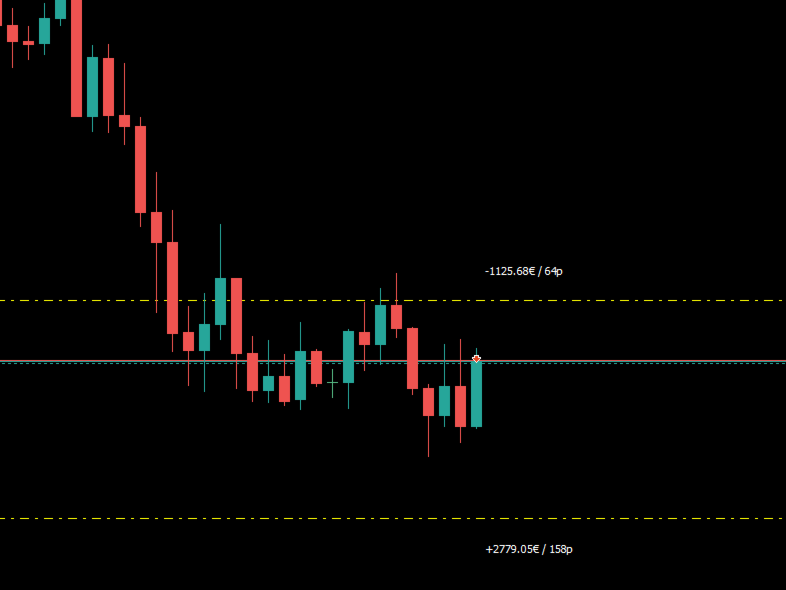
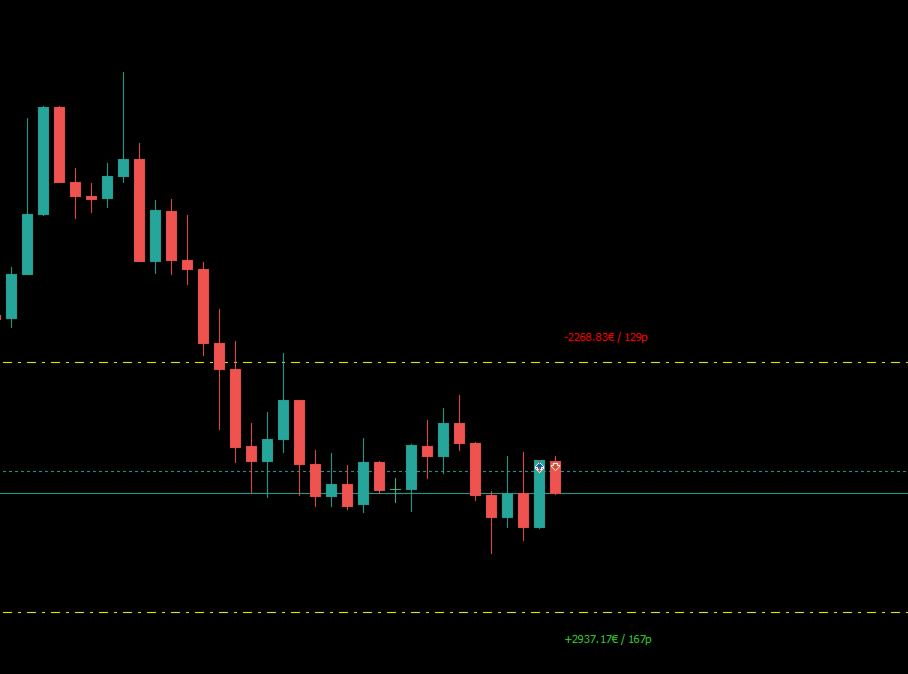
How many times have you opened a trade with a rough mental estimate of your risk, only to be surprised by the real number once your Stop Loss gets hit? SL/TP Values removes that guesswork: it displays real-time, on-chart labels showing the actual monetary value of your Stop Loss and Take Profit — before you commit to the trade.
What it does for you:
- Automatically converts the pip/point distance of your SL and TP into real money, based on your lot size and the instrument you're trading.
- Updates the labels instantly as you drag your SL/TP lines on the chart, so you can fine-tune your risk without leaving MetaTrader.
- Works just as well for 1-minute scalping as for wider intraday setups — perfect whether you trade DAX, Nasdaq, Gold, or any other instrument.
- Lightweight and lag-free: it won't slow down your platform or clash with your other indicators.
Why you need it:
Risk management is what separates a profitable trader from one who isn't. But calculating the monetary value of every trade by hand — every single time — is slow and error-prone, especially if you trade fast, across multiple instruments, or with varying lot sizes. SL/TP Values does that math for you instantly, so you make decisions based on real numbers, not estimates.
Perfect for:
- Scalpers who need fast, accurate decisions.
- Traders working multiple instruments with different volatility who want consistent risk across every trade.
- Anyone following fixed risk rules (e.g. never risk more than $X per trade) who wants to verify it at a glance.
Simple to use, zero learning curve
Installs like any other MT5 indicator. No complex setup — just attach it to your chart and start seeing your real risk numbers immediately.
Stop trading on rough estimates. With SL/TP Values, every trade you open shows its real risk, right on the chart, all the time.