GJPivots

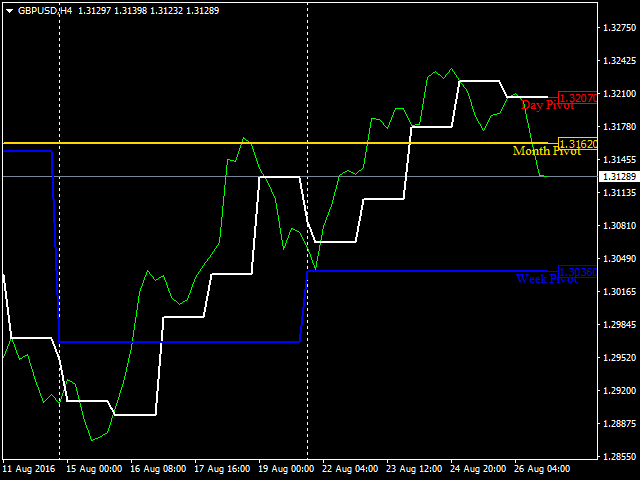
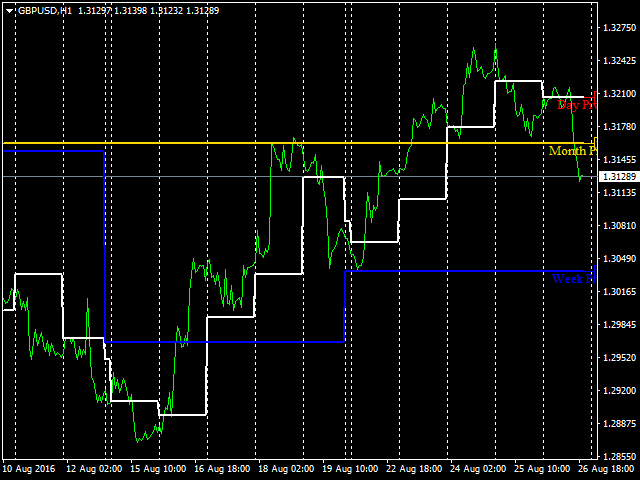
1. Monthly, weekly and daily pivots are calculated with the beginning and ending data for each period.

2. This provides an easy line on the chart to identify where the pivots are and reduces error of calculation.

3. The indicator will help define very quickly the major pivots for the instrument even if you do not understand how to calculate the pivot.

4. You can also compare weekly and daily pivots so that you can better understand the position of price.

5 This indicator will help you trade more efficiently closer to resistance or support.

Recommended products
Free automatic Fibonacci is an indicator that automatically plots a Fibonacci retracement based on the number of bars you select on the BarsToScan setting in the indicator. The Fibonacci is automatically updated in real time as new highest and lowest values appears amongst the selected bars. You can select which level values to be displayed in the indicator settings. You can also select the color of the levels thus enabling the trader to be able to attach the indicator several times with differe
FREE
Two Period RSI
Libertas LLC
5 (4)
Two Period RSI compares long-term and short-term RSI lines, and plots a fill between them for improved visualization. Fill is colored differently according to an uptrend (short period RSI above long period RSI) or a downtrend (short period RSI below long period RSI). Short-term RSI crossing long-term RSI adds a more robust trend confirmation signal than using single period RSI alone. This is a small tool to help visualize and confirm RSI trends. We hope you enjoy! Looking for RSI alerts? You can
FREE
Double HMA lines MTF
Pavel Zamoshnikov
5 (2)
This is a multi-timeframe version of the popular Hull Moving Average (HMA). The Double HMA MTF Light indicator combines two timeframes on a single chart. The HMA of the higher timeframe defines the trend, and the HMA of the current timeframe defines short-term price movements. The indicator is freely distributed and hasn't audio signals or messages. Its main function is the visualization of price movements. If you need advanced functionality of the HMA multi-timeframe indicator (information ab
FREE
Pivot Point Fibo RSJ is an indicator that traces the support and resistance lines of the day using Fibonacci rates. This spectacular indicator creates up to 7 levels of support and resistance through Pivot Point using Fibonacci rates. It is fantastic how the prices respect each level of this support and resistance, where it is possible to perceive possible entry/exit points of an operation. Features Up to 7 levels of support and 7 levels of resistance Set the colors of the levels individually
FREE
WAD Stoch
Yonny Pascal Ekwa Mezui
WAD Divergence + Stochastic Overview WAD Divergence + Stochastic is a technical indicator designed to assist traders in identifying potential market turning points. It combines price behavior with momentum confirmation to highlight areas where buying or selling pressure may be shifting. The indicator works directly on the chart and provides clear visual signals to support decision-making in fast-moving markets. How It Works The indicator analyzes the relationship between price movement and inte
FREE
Tipu Heikin Ashi Panel
Kaleem Haider
4.56 (18)
Tipu Heikin-Ashi Panel is the modified version of the original Heiken Ashi indicator published by MetaQuotes here . A professional version of this indicator is available here . Features An easy to use Panel that shows the Heiken Ashi trend of selected timeframe. Customizable Buy/Sell alerts, push alerts, email alerts, or visual on-screen alerts. Customizable Panel. The panel can be moved to any place on the chart or minimized to allow more space. Heikin means "the average", and Ashi means "foot
FREE
The free version of the Hi Low Last Day MT4 indicator . The Hi Low Levels Last Day MT4 indicator shows the high and low of the last trading day . The ability to change the color of the lines is available . Try the full version of the Hi Low Last Day MT4 indicator , in which additional indicator features are available : Displaying the minimum and maximum of the second last day Displaying the minimum and maximum of the previous week Sound alert when crossing max . and min . levels Selecting an arb
FREE
Wise Men Indicator demo
Bohdan Kasyanenko
3 (2)
The indicator displays signals according to the strategy of Bill Williams on the chart. Demo version of the indicator has the same features as the paid, except that it can work only on a demo account . Signal "First Wise Man" is formed when there is a divergent bar with angulation.  Bullish divergent bar - with lower minimum and closing price in the upper half. Bearish divergent bar - higher maximum and the closing price at the bottom half. Angulation is formed when all three lines of Alligator
FREE
FRM Half Trend
Noiros Tech
3.5 (2)
YOU CAN NOW DOWNLOAD FREE VERSIONS OF OUR PAID INDICATORS . IT'S OUR WAY OF GIVING BACK TO THE COMMUNITY ! >>>    GO HERE TO DOWNLOAD   The system is a free open source pine script originally published on TradingView by everget   . It was converted to Mt4 by Forex Robot Makers. This system is a  popular trend indicator based on ATR ( Average True Range ) , Moving Averages and the Donchian channel . System BackGround ATR The average true range is an indicator of the price volatility of an asse
FREE
Discover the power of precision and efficiency in your trading with the " Super Auto Fibonacci " MT4 indicator. This cutting-edge tool is meticulously designed to enhance your technical analysis, providing you with invaluable insights to make informed trading decisions. Key Features: Automated Fibonacci Analysis: Say goodbye to the hassle of manual Fibonacci retracement and extension drawing. "Super Auto Fibonacci" instantly identifies and plots Fibonacci levels on your MT4 chart, saving you tim
FREE
YOU CAN NOW DOWNLOAD FREE VERSIONS OF OUR PAID INDICATORS . IT'S OUR WAY OF GIVING BACK TO THE COMMUNITY ! >>>    GO HERE TO DOWNLOAD This system is an Heiken Ashi system based on RSI calculations . The system is a free open source script originally published on TradingView by JayRogers . We have taken the liberty of converting the pine script to Mq4 indicator . We have also added a new feature which enables to filter signals and reduces noise on the arrow signals. Background HEIKEN ASHI Th
FREE
This indicator shows the latest untouched support and resistance as horizontal lines. The indicator can show support/resistance from higher timeframes. With this indicator you can e.g. easily see the support/resistance of the timeframes H4, D1 and W1 on a H1 chart, which can be a big advantage while time your entry on H1. This is the FREE version of the indicator: Support Resistance Multi Time Frame The free version works only on EURUSD and GBPUSD! Parameters referenceTF: the timeframe from whi
FREE
FlatBreakout
Aleksei Vorontsov
FlatBreakout (Free Version) Flat Range Detector and Breakout Panel for MT4 — GBPUSD Only FlatBreakout is the free version of the professional FlatBreakoutPro indicator, specially designed for flat (range) detection and breakout signals on the GBPUSD pair only. Perfect for traders who want to experience the unique fractal logic of FlatBreakout and test breakout signals on a live market without limitations. Who Is This Product For? For traders who prefer to trade breakout of flat ranges (breakout,
FREE
High Low Open Close MT4
Alexandre Borela
4.81 (21)
If you like this project, leave a 5 star review. This indicator draws the open, high, low and closing prices for the specified period and it can be adjusted for a specific timezone. These are important levels looked by many institutional and professional traders and can be useful for you to know the places where they might be more active. The available periods are: Previous Day. Previous Week. Previous Month. Previous Quarter. Previous year. Or: Current Day. Current Week. Current Month. Current
FREE
Silver Bullet MT4
Saksham Solanki
5 (2)
Contact me for any queries or custom orders, if you want to use this in an EA. Key Features: Pattern Recognition : Identifies Fair Value Gaps (FVGs) Spots Break of Structure (BOS) points Detects Change of Character (CHoCH) patterns Versatile Application : Optimized for candlestick charts Compatible with any chart type and financial instrument Real-Time and Historical Analysis : Works seamlessly with both real-time and historical data Allows for backtesting strategies and live market analysis Vi
FREE
Average True Range (ATR) indicator with multi-timeframe support, customizable visual signals, and configurable alert system. Freelance programming services, updates, and other TrueTL products are available on my MQL5 profile . Feedback and reviews are highly appreciated! What is ATR? The Average True Range (ATR), developed by J. Welles Wilder, is a technical indicator that measures market volatility. It calculates the average of the True Range over a specified period. The True Range is the gr
FREE
Trendline indicator
David Muriithi
2 (1)
Are you tired of drawing trendlines every time you're analyzing charts? Or perhaps you would like more consistency in your technical analysis. Then this is for you. This indicator will draw trend lines automatically when dropped on a chart. How it works Works similar to standard deviation channel found on mt4 and mt5. It has 2 parameters: 1. Starting Bar 2. Number of bars for calculation The   starting bar   is the bar which drawing of the trend lines will begin, while the   number of bars for c
FREE
Candle Countdown — Accurate Time to Close for MT4 Candle Countdown is a simple and precise tool that shows the remaining time until the current candle closes directly on the chart. When your entry depends on the candle close, even a few seconds matter. This indicator helps you see the exact time and make decisions without rushing or guessing. An indicator for precise control over candle closing time. The indicator displays: time remaining until candle close current server time spread Stop Level
FREE
Smart FVG Indicator MT4   delivers professional Fair Value Gap (FVG) detection, monitoring, and alerting directly on your charts. It combines   ATR-based filtering   with structure-aware logic to remove noise, adapt to liquidity, and keep only the most relevant imbalances for precise decisions. Key Advantages Accurate FVG detection:   Identifies genuine inefficiencies, not just simple candle gaps. ATR-based precision:   Adaptive sensitivity filters out low-quality signals across markets and time
FREE
.................................if you need pivot point s levels............................... ............................this is a daily pivot point level creator........................... ...it is for daily pivots and show levels at times period H4 , H1 , M30 , M15 ,M 5... .................................also shows levels for 3 last days.............................. ................can use it with other indicators and see important levels...............
FREE
Aroon Classic
Etsushi Ishizuka
Overview of the Aroon Classic Indicator The Aroon Classic indicator is a technical tool that quantitatively identifies the emergence and persistence of trends on a chart. It uses two lines—“Aroon Up” and “Aroon Down”—to display trend strength and turning points within a range of 0–100. A higher Aroon Up value indicates a stronger uptrend, while a higher Aroon Down value indicates a stronger downtrend. Key Features Visually distinguishes trend initiation and reversal Customizable calculation peri
FREE
Awesome Pivot Indicator
Komang Putra Riswanjaya
The Pivot Indicator is a vital tool for technical analysis used by traders in the financial markets. Designed to assist in identifying potential reversal points or trend changes, this indicator provides valuable insights into key levels in the market. Key features of the Pivot Indicator include: Automatic Calculations: The Pivot Indicator automatically calculates Pivot Point, Support, and Resistance levels based on the previous period's high, low, and close prices. This eliminates the complexity
FREE
Pivot SR
Wartono
4.67 (3)
It identifies the pivot, support, and resistance price levels of the selected timeframe and then draws lines onto the chart. FEATURES: Option to specify the Timeframe Period in the PivotSR calculation. Option to display the PivotSR of the last candle, of every candle, or of the current candle. Options for displaying labels, line thickness, and line color. PivotSR can be interpreted as reversal levels or past price reactions that can be used as the basis for current price analysis. Some traders b
FREE
Follow The Line
Oliver Gideon Amofa Appiah
3.94 (16)
FOLLOW THE LINE GET THE FULL VERSION HERE: https://www.mql5.com/en/market/product/36024 This indicator obeys the popular maxim that: "THE TREND IS YOUR FRIEND" It paints a GREEN line for BUY and also paints a RED line for SELL.  It gives alarms and alerts of all kinds. IT DOES NOT REPAINT and can be used for all currency pairs and timeframes. Yes, as easy and simple as that. Even a newbie can use it to make great and reliable trades. NB: For best results, get my other premium indicators for more
FREE
Trend Filter Pro
Aleksandr Makarov
5 (1)
Special offer in honor of the New Year and Christmas!! https://www.mql5.com/ru/users/bossik2810 Trend Filter Pro Trend filter indicator. Very good filter for your trading system, I recommend to use it together with - System Trend Pro   or  Quantum Entry PRO The indicator no repaint!!! Settings: Change the Period parameter for better filtering ( default is 90) Any questions? Need help?, I am always happy to help, write me in private messages or In Telegram: https://t.me/Trader35_Admin
FREE
R 2EMA Color
Rwy Ksyby
5 (2)
The R 2EMA Color indicator for MT4 provides solid trading signals based on the crossover of 2 EMA’s. Key Points When price crosses and closes above the two green EMA’s, it creates a buy trade signal. When price crosses and closes above the two red EMA’s, it creates a sell trade signal. The R 2EMA Color Forex indicator makes it even more easy to determine when it’s time to buy and sell A buy signal occurs when the 2 EMA lines turn green . A sell signal occurs when the 2 EMA lines turn red . How
FREE
PZ Pivot Points
PZ TRADING SLU
4.6 (10)
This indicator displays pivot points in the chart, including historical vales, and supports many calculation modes for Pivot Points and S/R levels. [ Installation Guide | Update Guide | Troubleshooting | FAQ | All Products  |  Get Help ] It plots historical levels for backtesting purposes It allows you to select the reference timeframe It implements different Pivot Point calculation modes It implements different SR calculation modes It implements customizable colors and sizes Calculation Mode
FREE
Pivot Points are a classic technical analysis indicator that calculates the central pivot point (PP) as well as support (S1–S3) and resistance (R1–R3) levels based on the previous day’s High, Low, and Close. The indicator allows you to: • identify key zones where the price may bounce or break through • determine the direction of the trend • find good entry points, as well as set stop loss and take profit levels Indicator settings: • enable/disable PP, R1/S1, R2/S2, R3/S3 • enable/disable price l
FREE
The Auto Fibonacci Indicator is a professional technical analysis tool that automatically draws Fibonacci retracement levels based on the most recent closed Daily (D1) or 4-Hour (H4) candle. These levels are widely used by traders to identify key support , resistance , and trend reversal zones . This version is designed for manual trading and supports a powerful trading strategy using Fibonacci levels combined with a 50-period EMA (Exponential Moving Average) , which you can easily add from MT4
FREE
.....................................hi....................... ................for showing high s and low s and support and resistanses .....................we have a lot of ways............................... it can be helpful for finding trends , higher highs , higher lows , lower highs , lower lows .......................today i write on of thems.......................... ........................you can enter the number of last support and resistanses .........................and it will dra
FREE
Buyers of this product also purchase
Neuro Poseidon MT4
Daria Rezueva
4.94 (17)
Neuro Poseidon is a new indicator by Daria Rezueva. It combines precise trading signals with adaptive TP/SL levels - creating best possible trades as a result! Message me and get  Neuro Poseidon Assistant  as a gift to automize your trading process! What makes it stand out? 1. Proven profitability on all assets and timeframes 2. Only confirmed BUY and SELL signals present on the chart 3. Adaptive TP & SL levels generated by the software for each trade 4. Easy to understand - suitable for all
Scalper Inside PRO
Alexey Minkov
4.74 (68)
Scalper Inside PRO Scalper Inside PRO is an intraday trend and scalping indicator for MetaTrader 4 that uses an exclusive algorithm to quickly detect market direction and key target levels. It automatically calculates entry, exit and multiple profit targets, and shows detailed performance statistics so you can see how different instruments and strategies performed. This helps you choose the most suitable trading instruments for the current market conditions. Additionally, you can easily integrat
M1 Sniper
Oleg Rodin
5 (23)
M1 SNIPER is an easy to use trading indicator system. It is an arrow indicator which is designed for M1 time frame. The indicator can be used as a standalone system for scalping on M1 time frame and it can be used as a part of your existing trading system. Though this trading system was designed specifically for trading on M1, it still can be used with other time frames too. Originally I designed this method for trading XAUUSD and BTCUSD. But I find this method helpful in trading other markets a
Gann Made Easy
Oleg Rodin
4.84 (164)
Gann Made Easy is a professional and easy to use Forex trading system which is based on the best principles of trading using the theory of W.D. Gann. The indicator provides accurate BUY and SELL signals including Stop Loss and Take Profit levels. You can trade even on the go using PUSH notifications. PLEASE CONTACT ME AFTER PURCHASE TO GET TRADING  INSTRUCTIONS AND GREAT EXTRA INDICATORS   FOR FREE! Probably you already heard about the Gann trading methods before. Usually the Gann theory is a ve
PRO Renko System
Oleg Rodin
5 (30)
PRO Renko System is a highly accurate trading system specially designed for trading RENKO charts. The ARROWS and Trend Indicators DO NOT REPAINT! The system effectively neutralizes so called market noise giving you access to accurate reversal signals. The indicator is very easy to use and has only one parameter responsible for signal generation. You can easily adapt the tool to any trading instrument of your choice and the size of the renko bar. I am always ready to provide extra support to help
Trend Catcher ind
Ramil Minniakhmetov
TREND CATCHER INDICATOR Trend Catcher Indicator analyzes market price movements, using a combination of the author’s proprietary and customized adaptive trend-analysis indicators.  It identifies the true market direction by filtering out short-term noise and focusing on underlying momentum strength, volatility expansion, and price structure behavior.  It also uses a combination of smoothing and trend-filtering customized indicators such as moving averages, RSI, and volatility filters.   Real ope
Trend Lines PRO
Roman Podpora
5 (1)
TREND LINES PRO    helps understand where the market is truly changing direction. The indicator shows real trend reversals and points where major players re-enter. You see   BOS lines   Trend changes and key levels on higher timeframes — without complex settings or unnecessary noise. Signals don't repaint and remain on the chart after the bar closes. VERSION MT 5     -     Reveals its maximum potential when paired with the   RFI LEVELS PRO  indicator What the indicator shows: Real shifts   tren
Enigmera
Ivan Stefanov
5 (8)
ENIGMERA: The core of the market (This is a manual indicator and contains features that may not supported by the MetaTrader current testing environment) Introduction This indicator and trading system is a remarkable approach to the financial markets . ENIGMERA uses the fractal cycles to accurately calculate support and resistance levels. It shows the authentic accumulation phase and gives direction and targets.  A system that works whether we are in a trend or a correction.   How It Works Most
Dynamic Forex28 Navigator
Bernhard Schweigert
4.43 (7)
Specials Discount now. The Next Generation Forex Trading Tool. Dynamic Forex28 Navigator is the evolution of our long-time, popular indicators, combining the power of three into one: Advanced Currency Strength28 Indicator (695 reviews) + Advanced Currency IMPULSE with ALERT (520 reviews) + CS28 Combo Signals (recent Bonus) Details about the indicator  https://www.mql5.com/en/blogs/post/758844 What Does The Next-Generation Strength Indicator Offer? Everything you loved about the originals, now
Genesis Matrix Pro is a professional multi-timeframe trend detection indicator designed to help traders identify high-quality market alignment with clarity and structure. It combines 12 different technical indicators into one visual alignment matrix, allowing traders to quickly see when market conditions are bullish, bearish, or neutral. A signal is generated only when the selected strategies are aligned, helping reduce noise and improve decision-making. PLEASE CONTACT ME AFTER PURCHASE TO GET
This indicator is an indicator for automatic wave analysis that is perfect for practical trading! Case... Note:   I am not used to the Western name for wave classification. Influenced by the naming habit of Chaos Theory (Chanzhongshuochan), I named the basic wave as   pen   , the secondary wave band as   segment   , and the segment with trend direction   as main trend segment   (this naming method will be used in future notes, let me tell you in advance), but the algorithm is not closely relat
RFI levels PRO
Roman Podpora
5 (1)
The indicator accurately shows the reversal points and price return zones where the   Major players . You see where new trends are forming and make decisions with maximum precision, maintaining control over every trade. VERSION MT5     -     Reveals its maximum potential when combined with the   TREND LINES PRO   indicator What the indicator shows: Reversal structures and reversal levels with activation at the beginning of a new trend. Display of   TAKE PROFIT   and   STOP LOSS   levels with mi
This product was   updated   for the   2026 market   and   optimized   for the   latest MT5 builds . PRICE UPDATE NOTICE: Smart Trend Trading System   is currently available for $99. The price will   increase to $199   after the next   30 purchases. SPECIAL OFFER:  After purchasing Smart Trend Trading System, send me a private message to claim the Smart Universal EA for FREE and turn your Smart Trend signals into automated trades. Smart Trend Trading System is a complete non-repainting, non-re
MTF Supply Demand Zones
Georgios Kalomoiropoulos
4.82 (22)
Next Generation Of Automated Supply And Demand Zones. New and Innovative Algorithm that Works At Any Chart. All Zones Are Being Created Dynamically According To Price Action Of The Market. AMAZING OFFER --> Activations from 5 to 20 for "MTF Supply Demand Zones" and "Automated Trendlines" If you get the MTF Supply Demand Zones you can join the " Trade Like Me " Video Series. It contains 14 Live Sessions where  i am placing trades on Forex, Stocks, Indices and Metals. You will be able to see ho
Step into the world of Forex trading with confidence, clarity, and precision using   Gold Indicator   a next-generation tool engineered to take your trading performance to the next level. Whether you’re a seasoned professional or just beginning your journey in the currency markets, Gold Indicator equips you with powerful insights and help you trade smarter, not harder. Built on the proven synergy of three advanced indicators, Gold Indicator focuses exclusively on medium and long-term trends eli
Entry Points Pro
Yury Orlov
4.59 (174)
Top indicator for MT4 providing accurate signals to enter a trade without repainting! Watch  the video  (6:22) with an example of processing only one signal that paid off the indicator! It can be applied to any financial assets:  forex, cryptocurrencies, metals, stocks, indices.  MT5 version is here   It will provide pretty accurate trading signals and tell you when it's best to open a trade and close it. Most traders improve their trading results during the first trading week with the help of t
MetaBands M4
Vahidreza Heidar Gholami
3.5 (6)
MetaBands uses powerful and unique algorithms to draw channels and detect trends so that it can provide traders with potential points for entering and exiting trades. It’s a channel indicator plus a powerful trend indicator. It includes different types of channels which can be merged to create new channels simply by using the input parameters. MetaBands uses all types of alerts to notify users about market events. Features Supports most of the channel algorithms Powerful trend detection algorith
M30/H1/H4 Swing Version Available Want to catch the big moves that M5/M15 can't reach? Gold Signal Swing Pro (M30/H1/H4) is now available. Target $20-$80+ per trade. https://www.mql5.com/en/market/product/177643 KURAMA GOLD SIGNAL PRO (MT4) — Complete XAUUSD Trading System with 7-Layer Filter, Auto TP/SL, and Quality Scoring NON-REPAINTING. NON-REDRAWING. NON-LAGGING. Every signal is permanent. What you see is what you get. BONUS: Buy the lifetime li
Current event:  https://c.mql5.com/1/326/A2SR2025_NoMusic.gif A. What is A2SR ?   * It's a leading technical indicator (no repaint, no lagging). -- Guidance : -- at   https://www.mql5.com/en/blogs/post/734748/page4#comment_16532516 -- and  https://www.mql5.com/en/users/yohana/blog A2SR has a special technique in determining the levels of Support ( demand ) and Resistance ( supply ) . Unlike the ordinary way that we seen on the net, A2SR has a original concept in determining actual SR levels.
Market Structure Patterns MT4
Samuel Manoel De Souza
5 (18)
Market Structure Patterns   is an indicator based on   smart money concepts   that displays   SMC/ICT   elements that can take your trading decisions to the next level. Take advantage of the   alerts ,   push notifications   and   email messages   to keep informed from when an element is formed on the chart, the price crosses a level and/or enters in a box/zone. Developers can access the values of the elements of the indicator using the   global variables  what allows the automation of trading d
BTMM State Engine Pro is a MetaTrader 4 indicator for traders who use the Beat The Market Maker approach: Asian session context, kill zone timing, level progression, peak formation detection, and a multi-pair scanner from a single chart. It combines cycle state logic with a built-in scanner dashboard so you do not need the same tool on many charts at once. What it does Draws the Asian session range; session times can follow broker server offset or be set in inputs. Tracks level progression (L
Quant Direction
Georgios Kalomoiropoulos
Quant Direction is a 3 dimensional market analysis tool. It provides a purely objective, algorithmic view of the market by calculating exact percentage-based biases across multiple dimensions simultaneously. Developed utilizing advanced AI modeling tools and subjected to thorough testing, this algorithm is engineered to read the market with unique precision. It can analyze any currency pair or financial instrument available on your platform.  Quant Direction is the ideal tool whether you are a S
FX Power MT4 NG
Daniel Stein
4.95 (21)
FX Power: Analyze Currency Strength for Smarter Trading Decisions Overview FX Power is your go-to tool for understanding the real strength of currencies and Gold in any market condition. By identifying strong currencies to buy and weak ones to sell, FX Power simplifies trading decisions and uncovers high-probability opportunities. Whether you’re looking to follow trends or anticipate reversals using extreme delta values, this tool adapts seamlessly to your trading style. Don’t just trade—trade
NAM Order Blocks
NAM TECH GROUP, CORP.
3.67 (3)
MT4 Multi-timeframe Order Blocks detection indicator. Features - Fully customizable on chart control panel, provides complete interaction. - Hide and show control panel wherever you want. - Detect OBs on multiple timeframes. - Select OBs quantity to display. - Different OBs user interface. - Different filters on OBs. - OB proximity alert. - ADR High and Low lines. - Notification service (Screen alerts | Push notifications). Summary Order block is a market behavior that indicates order collection
PowerBall Signals is a BUY/SELL signals indicator based on the idea of using support/resistance zones. The indicator detects special reversal patterns based on support/resistance zones and provide these signals on your chart. The main idea of the indicator is using the MTF (Multi Time Frame) analysis and provide signals based on the levels from your current and next higher time frame. This method allows to predict possible price reversals on any market be it currencies, metals, indices or even c
Auto Optimized Parabolic RSI: Advanced 3D Momentum Engine Most retail indicators fail because they rely on static inputs that break the moment market volatility shifts. Auto Optimized Parabolic RSI solves the problem of "indicator decay" by continuously recalculating its own mathematical edge, bringing institutional-grade quantitative adaptation directly to your MT5 terminal. The Core Advantage: Custom In-Memory 3D Optimization   Standard auto-optimizers often freeze the MT5 platform because the
Volume Master – Real-Time Market Power Indicator See who’s in control of the market: buyers or sellers in real time. Volume Master is a powerful trading tool designed to give you a clear edge by visualizing bull vs bear activity across multiple symbols, while helping you confirm high-probability entries directly on your chart. WHAT MAKES VOLUME MASTER DIFFERENT? Unlike traditional volume indicators, Volume Master doesn’t just show volume — it shows market dominance. Real-Time Bull vs Bear Activi
GoldRush Trend Arrow Signal V1.6 The GoldRush Trend Arrow Signal indicator V1.6 continues to provide precise, real-time trend analysis tailored for high-speed, short-term scalpers in XAU/USD , but it now has additional features and improved efficiency and reliability. Built specifically for the 1-minute time frame, this tool displays directional arrows for clear entry points, allowing scalpers to navigate volatile market conditions with confidence. The indicator consists of PRIMARY and SECONDARY
PZ 123 Pattern
PZ TRADING SLU
1 (1)
Unlock powerful breakout opportunities The 123 Pattern is one of the most popular, powerful and flexible chart patterns. The pattern is made up of three price points: a bottom, a peak or valley, and a Fibonacci retracement between 38.2% and 71.8%. A pattern is considered valid when the price breaks beyond the last peak or valley, moment at which the indicator plots an arrow, rises an alert, and the trade can be placed. [ Installation Guide | Update Guide | Troubleshooting | FAQ | All Products  ]
Bull versus Bear
Mohamed Hassan
4.5 (18)
Send us a message after your purchase to receive more information on how to get your  BONUS  for FREE  that works in great combination with Bull vs Bear ! Bull versus Bear is an easy-to-use Forex indicator that gives traders clear and accurate signals based on clear trend retests . Forget about lagging indicators or staring at charts for hours because  Bull vs Bear provides real-time entries with no lag and no repaint, so you can trade with confidence. Bull vs Bear  helps you enter trades during
More from author
Easy Trend MQL5
David Jumbo
5 (2)
PLEASE HELP REVIEW/ SUPPORT/ SHARE THIS OTHER INDICATOR  HERE  https://www.mql5.com/en/market/product/51637  AS YOU DOWNLOAD THIS ONE FOR FREE. THANKS. This Indicator is based on four moving averages and the PIVOT points. The indicator provides clarity to trading, especially in ranging markets when price is very slow and tight. You can trade intensively daily, every day with this indicator. You may decide to trade with this indicator alone and get the maximum out of the market. The indicator w
FREE
D90 Percent
David Jumbo
5 (1)
PLEASE HELP REVIEW/ SUPPORT/ SHARE THIS OTHER INDICATOR  HERE  https://www.mql5.com/en/market/product/51637  AS YOU DOWNLOAD THIS ONE FOR FREE. THANKS. The indicator was created to make trading very easy to understand. It is based on five moving average crosses and pivot points. Download the "EASY TREND" on my Product list for a more advanced and profiting trades.  You can trade with this indicator alone and get the maximum out of the market. If you are a new trader, just open your chart window
FREE
PLEASE HELP REVIEW/ SUPPORT/ SHARE THIS OTHER INDICATOR  HERE  https://www.mql5.com/en/market/product/51637  AS YOU DOWNLOAD THIS ONE FOR FREE. THANKS. A. This pivot indicator shows the days Pivot Price. Yellow line is pivot point. Blue line is resistance and red line is support. B. It also shows Resistance  R0.5, R1, R1.5, R2, R2.5, and R3 C.It also shows support S0.5, S1, S1.5, S2, S2.5, and S3 INPUT: Under input you will see 3 Variables 1.ExtFomula. Here you can set your preferred exit at a
FREE
This indicator is very effective for trading everyday. A combination of moving averages and 2X Pivots calculation to produce a very convincing signal everyday. Blue colour signals a buy opportunity. Follow the arrows for possible buy points. The Blue pivots and average line, serves as possible support. Red colour signals a sell opportunity. Follow the arrows for possible sell points. The Red pivots and average line, serves as possible resistance.  Best use on the 15 minutes, 30 minutes or 1 hour
FREE
PLEASE HELP REVIEW/ SUPPORT/ SHARE THIS OTHER INDICATOR  HERE  https://www.mql5.com/en/market/product/51637  AS YOU DOWNLOAD THIS ONE FOR FREE. THANKS. This Indicator is based on four moving averages and the PIVOT points. The indicator provides clarity to trading, especially in ranging markets when price is very slow and tight. You can trade intensively daily, every day with this indicator. You may decide to trade with this indicator alone and get the maximum out of the market. The indicator wa
FREE
ScalpinVerse
David Jumbo
3 (1)
This indicator uses binary codes to predict price movement within the "multiverse and mini-verse" of price. (Due to the coding instruction to capture every momentum, it leaves static lines in DEMO TESTING mode. At the end of testing click on the indicator to open and click OK. It will adjust and remove broken and static lines)  It also draws lines at entry price levels on the chart. Just open your positions accordingly at these price levels. You will get many trading opportunities each day with
Perfect for one minutes high trading and scalping. This indicator is very effective for trading on one minutes, in the hour. A combination of moving averages and STOCHASTICS calculation to produce a very convincing signal every hour. Blue colour signals a buy opportunity. Follow the X signs for possible buy points. The Blue average line serves as possible trend direction and support. Red colour signals a sell opportunity. Follow the X signs for possible sell points. The Red average line serves a
Filter:
[Deleted] 2018.03.02 19:42 
 

User didn't leave any comment to the rating

Vyacheslav Korolev
4684
Vyacheslav Korolev 2017.05.06 21:01 
 

User didn't leave any comment to the rating

Godwin Jumbo
421
Godwin Jumbo 2016.09.05 14:12 
 

User didn't leave any comment to the rating

Reply to review