PZ Timeframe Overlay
- Indicators
- PZ TRADING SLU
- Version: 1.2
- Updated: 20 October 2020
- Activations: 20
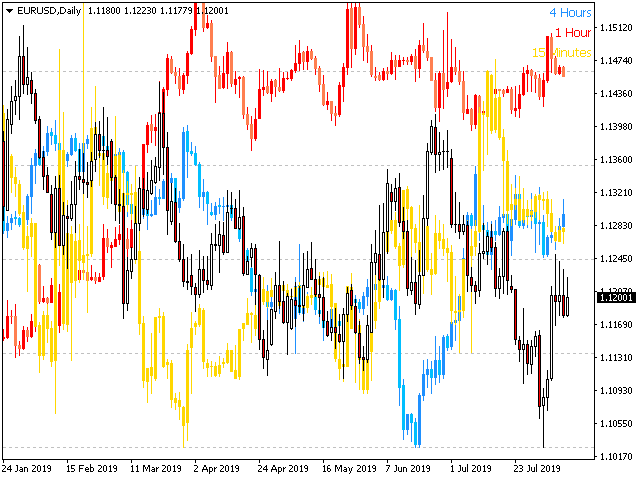
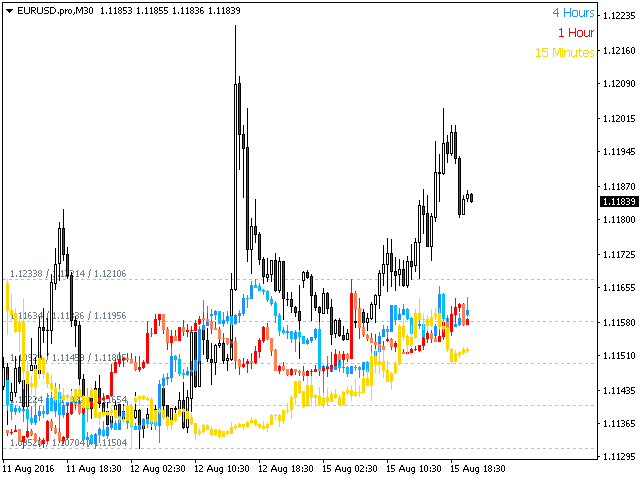
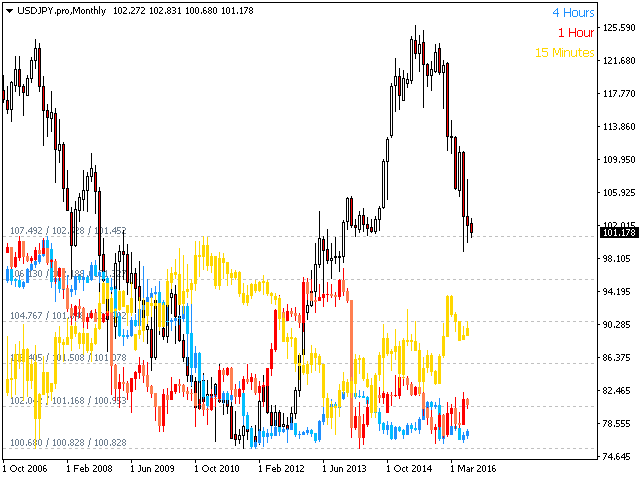
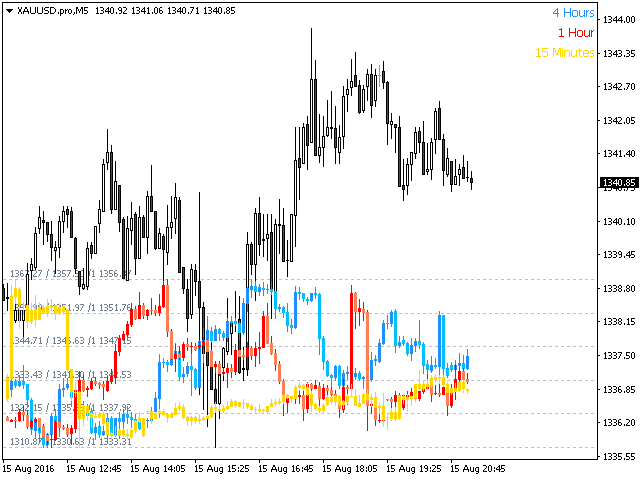
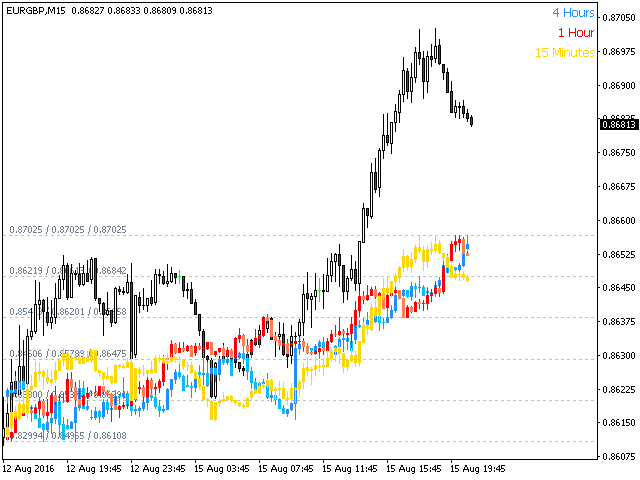
This indicator displays the price action of several timeframes on the same chart allowing you to evaluate different timeframes at a glance from the same chart, without the need of switching between timeframes. The overlay can be displayed totally or partially on the chart, making it easy to separate price action from the trading chart from the reference timeframes. [ Installation Guide | Update Guide | Troubleshooting | FAQ | All Products ]
- Stop browsing through timeframes!
- Plot up to four timeframes overlayed on the same chart
- Adapts to chart size, zoom and timeframe
- The size of the chart is customizable
- Automatic price level calculation
- Customizable price level density
- Customizable colors and sizes
Input Parameters
- Symbol Settings - select the timeframes you want to display on the overlay chart. You need to enter at least one of them in order for the overlay chart to have two timeframes - one native and one foreign. If a period is set to "none", it will not be displayed.
- Chart Settings - set the size of the overlay chart relative to the background chart and the location of the price labels.
- Visual Settings - customize colors for text labels and price lines, style of the price lines and number of price lines displayed on the overlay chart.
Author
Arturo Lopez Perez, private investor and speculator, software engineer and founder of Point Zero Trading Solutions.


User didn't leave any comment to the rating