PZ Flat Market Index MT5
- Indicators
- PZ TRADING SLU
- Version: 2.4
- Updated: 22 March 2022
- Activations: 20
Identify trending and flat markets effortlessly
This indicator calculates how much has a symbol moved in relative terms to find trending or flat markets. It displays what percentage of the latest price range is directional. It can be used to avoid trading in flat markets, or to find flat markets to execute range-bound trading strategies.
[ Installation Guide | Update Guide | Troubleshooting | FAQ | All Products ]
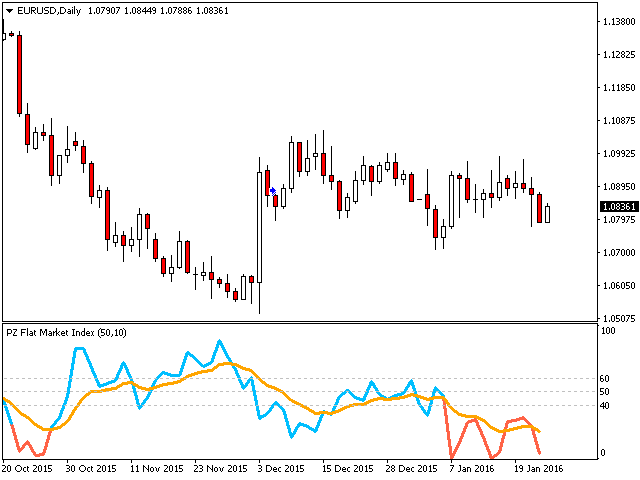
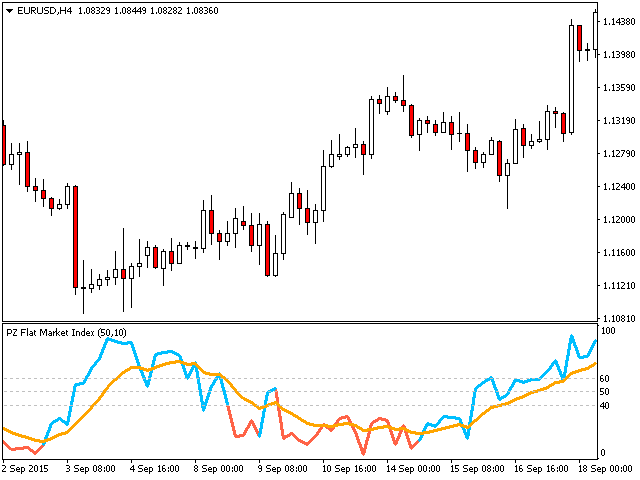
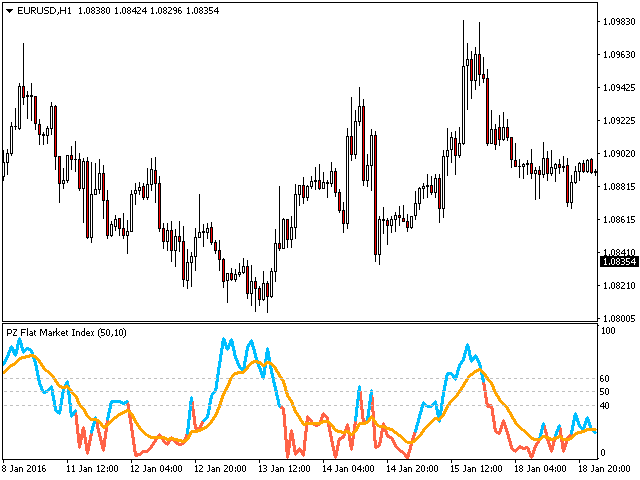
- A value of zero means the market is absolutely flat
- A value of 100 means the market is totally trending
- The blue line means the price range is healthy
- The red line means the price range is narrow
- The moving average is the flat market index (FMI)
It has straightforward trading implications.
- Use trend-trading strategies when the line is blue and above the FMI
- Use range-trading strategies when the line is red and below the FMI
- Perform instrument selection based on the FMI
This indicator is especially useful to avoid flat markets in your Expert Advisors.
Input Parameters
- Max History Bars: Amount of bars to look into the past when loading.
- Lookback: Amount of bars to study the flat market index.
- Period: Averaging period to calculate the index.
- ATR Period: ATR period used in the indicator to calculate a movement unit.
- ATR Multiplier: Multiplier of ATR to calculate a movement unit of the index.
Author
Arturo López Pérez, private investor and speculator, software engineer and founder of Point Zero Trading Solutions.


