• Overview
  • Reviews (2)
  • Comments (13)
  • What's new

Dashboard Super Critical Support and Resistance

5

如果产品有任何问题或者您需要在此产品上添加功能,请联系我

Contact/message me if you encounter any issue using the product or need extra feature to add on the base version.


To access the free demo version, please re-direct to this LINK.

To access the single pair version, please re-direct to this LINK.

Price is likely to pullback or breakout at important support and/or resistance. This dashboard is designed to help you monitor these critical support and resistance area. Once price moves close to these important support and resistance within the warning area (warning area range is adjustable), alert or notification would be sent out, and indicator panel will be repainted to be red to make it noticeable. So you are free from watching and monitoring chart all day long.

Dashboard Super Critical Support and Resistance is an intuitive, and handy graphic tool to help you to:

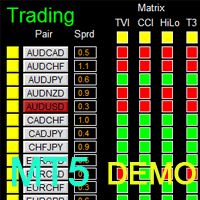
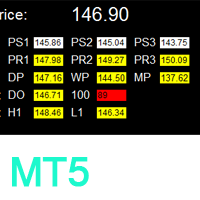
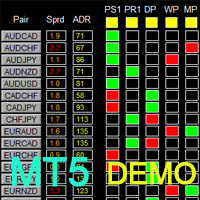
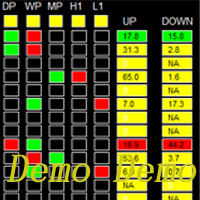
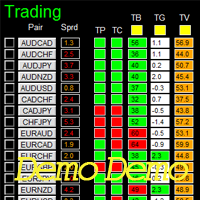
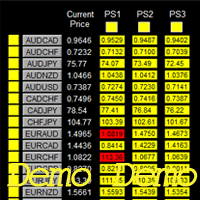
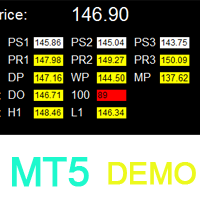
  • Have the most commonly used critical support and resistance (pivot support1/2/3, pivot resistance1/2/3, daily/weekly/monthly pivot, daily open, 100 round point, and previous daily high/low) of 28 major pairs under control with one dashboard.


Features

  • Ability to select usage of alert/notification function.
  • Adjustable warning range for each type of critical support/resistance.
  • Ability to select which critical support/resistance to use, by default, all of them are selected.
  • Adjustable indicator panel position

Input Parameters

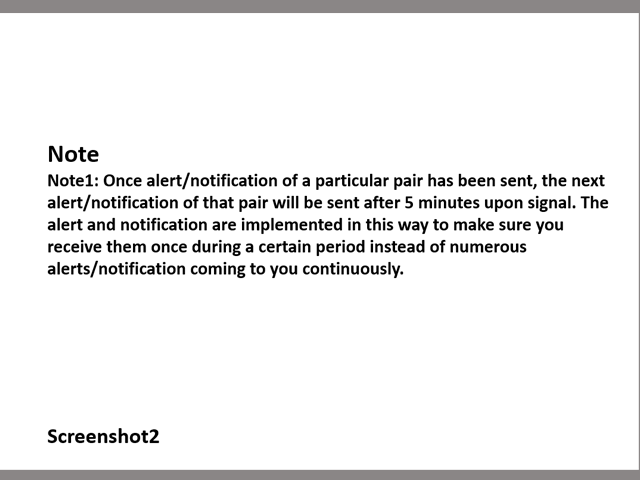
  • Send Alert upon Signal (Refer to note1)
    • True: send alert once price moves to area within warning zone
    • False: no alert will be sent
  • Send Notification upon Signal (Refer to note1)
      • Same to Send Alert
    • Use Pivot Support1
      • True: pivot support cell panel will be repainted to be red, and alert/notification will be sent once price moves to area within pivot support warning zone
      • False: no action will be triggered
      • Same rule is applied to the following support/resistance
    • Pivot Support1 Warning Zone
    • True: pivot support cell panel will be repainted to be red, and alert/notification will be sent once price moves to area within pivot support warning zone
    • Same rule is applied to the following warning zone
    • Use Pivot Support2
    • Pivot Support2 Warning Zone
    • Use Pivot Support3
    • Pivot Support3 Warning Zone
    • Use Pivot Resistance1
    • Pivot Resistance1 Warning Zone
    • Use Pivot Resistance2
    • Pivot Resistance2 Warning Zone
    • Use Pivot Resistance3
    • Pivot Resistance3 Warning Zone
    • Use Daily Pivot
    • Daily Pivot Warning Zone
    • Use Weekly Pivot
    • Weekly Pivot Warning Zone
    • Use Monthly Pivot
    • Monthly Pivot Warning Zone
    • Use Daily Open
    • Daily Open Warning Zone
    • Use 100 Round Point
    • 100 Round Point Warning Zone
    • Use Previous Daily High
    • Previous Daily High Warning Zone
    • Use Previous Daily Low
    • Previous Daily Low Warning Zone
    • Suffix: suffix string of your symbol. i.e.: your symbol is ‘EURUSDx’ instead of ‘EURUSD’, input ‘x’ in suffix cell, leave prefix cell blank
    • Prefix: prefix string of your symbol
    • X_axis:dashboard x position
    • Y_axis: dashboard x position


    Dashboard Objects

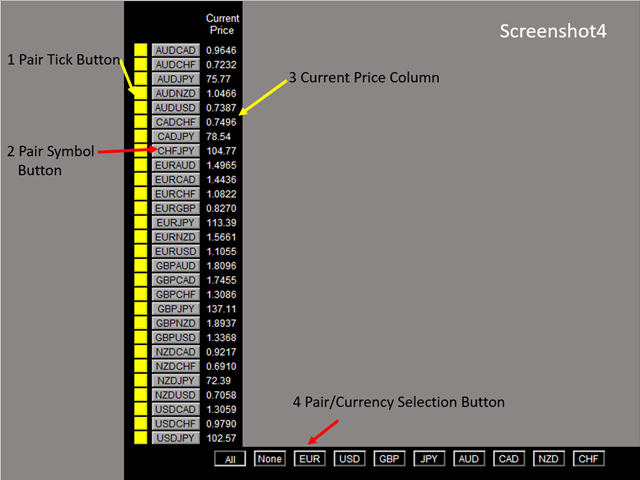
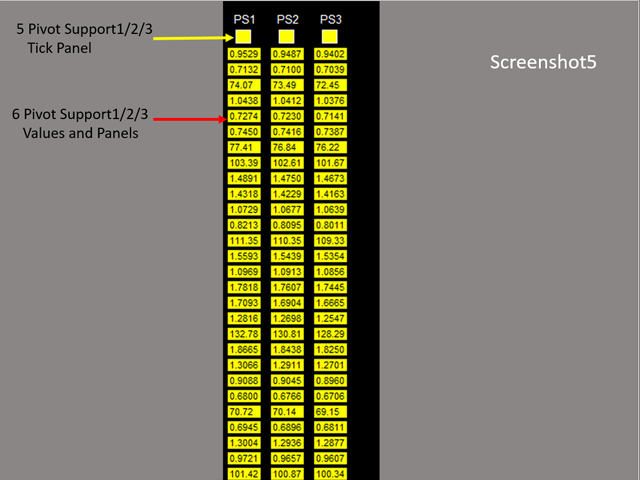
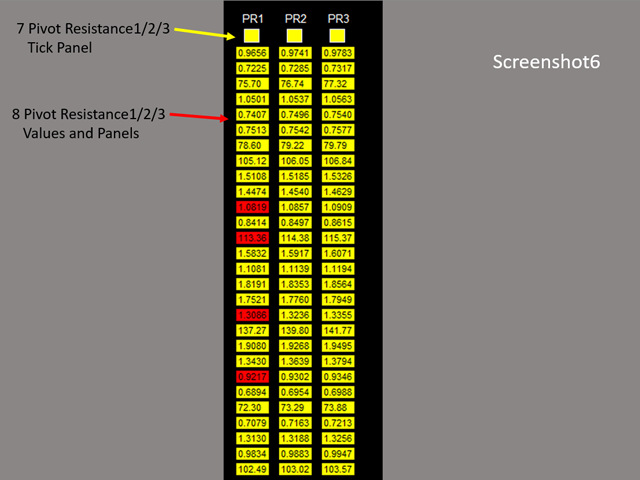
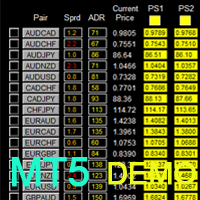
    For object 1-12 screenshot4-8

    1. Pair Tick Button: Click once to active the corresponding pair for trading. Click once more to de-active.
    2. Pair Symbol Button:
      • Click on button to open a corresponding new window chart
    3. Current Price Column: show current price of each pair.
    4. Pair/Currency Selection Button:
      • All: select all 28 pairs
      • None: clear all selected pairs
      • EUR: select all EUR pairs, like EURUSD, EURJPY…
      • Same rules applies to USD, GBP, JPY... buttons
    5. Pivot Support1/2/3 Tick Panel
    6. Pivot Support1/2/3 Values and Panels
    7. Pivot Resistance1/2/3 Tick Panel
    8. Pivot Resistance1/2/3 Values and Panels
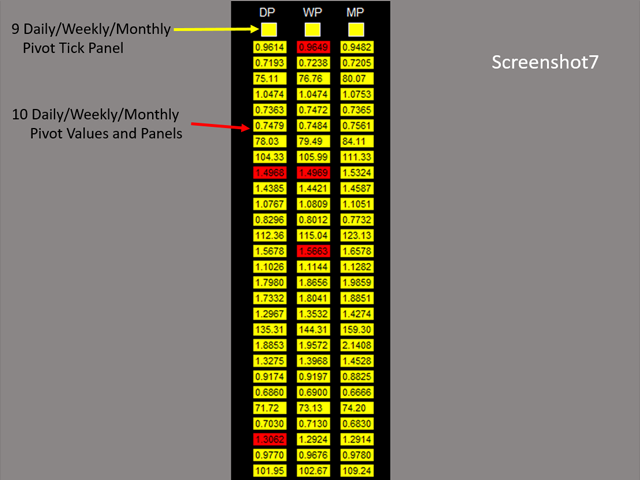
    9. Daily/Weekly/Monthly Pivot Tick Panel
    10. Daily/Weekly/Monthly Pivot Values and Panels
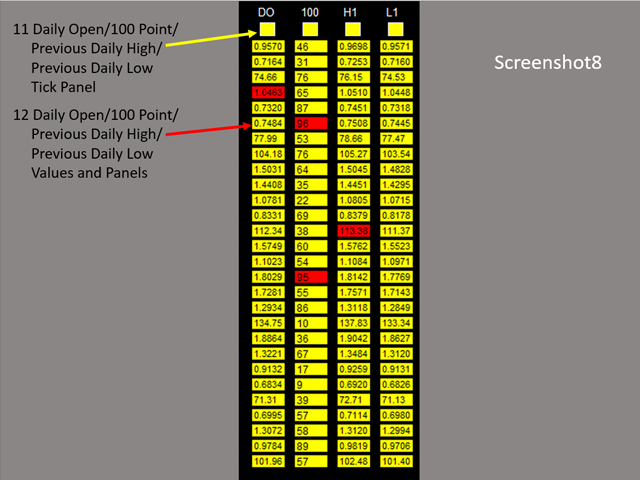
    11. Daily Open/100 Point/Previous Daily High/Previous Daily Low Tick Panel
    12. Daily Open/100 Point/Previous Daily High/Previous Daily Low Values and Panels


    Note

    Refer to screenshot2

    If you have any customized request and/or suggestion, please feedback to me.

    Reviews 2
    pnutfx503
    1524
    pnutfx503 2017.03.15 17:28 
     

    Helps you find trades at the right place and time. Very easy to pull up the anyone of the 28 pairs listed. It's a must have for anyone looking to trade multiple currency pairs, and using pivot points for their trading.

    Recommended products
    The main idea of this indicator is rates analysis and prediction by Fourier transform. Indicator decomposes exchange rates into main harmonics and calculates their product in future. You may use the indicator as a standalone product, but for better prediction accuracy there is another related indicator - FreqoMaster - which uses FreqoMeterForecast as a backend engine and combines several instances of FreqoMeterForecast for different frequency bands. Parameters: iPeriod - number of bars in the ma
    The indicator provides a superior alternative to price action analysis. It enables the identification of normalized patterns, which are then transformed into a graphical representation to forecast future steps within a time series. In the top-left corner, you'll find information regarding the expected prediction accuracy, determined through a complex MSQE calculation. You have the flexibility to adjust the time window, making it easy to validate the indicator's performance. Additionally, you can
    The indicator detects and displays Shark harmonic pattern (see the screenshot). The pattern is plotted by the extreme values of the ZigZag indicator (included in the resources, no need to install). After detecting the pattern, the indicator notifies of that by a pop-up window, a mobile notification and an email. The indicator highlights the process of the pattern formation and not just the complete pattern. In the former case, it is displayed in the contour triangles. After the pattern is comple
    The indicator builds current quotes, which can be compared with historical ones and on this basis make a price movement forecast. The indicator has a text field for quick navigation to the desired date. Options: Symbol - selection of the symbol that the indicator will display; SymbolPeriod - selection of the period from which the indicator will take data; IndicatorColor - indicator color; Inverse - true reverses quotes, false - original view; Next are the settings of the te
    The indicator detects and displays 3 Drives harmonic pattern (see the screenshot). The pattern is plotted by the extreme values of the ZigZag indicator (included in the resources, no need to install). After detecting the pattern, the indicator notifies of that by a pop-up window, a mobile notification and an email. The indicator highlights the process of the pattern formation and not just the complete pattern. In the former case, it is displayed in the contour triangles. After the pattern is com
    Master Scalping M1 is an innovative indicator that uses an algorithm to quickly and accurately determine the trend.The indicator calculates the time of opening and closing positions, the indicator's algorithms allow you to find the ideal moments to enter a deal (buy or sell an asset), which increase the success of transactions for most traders. Benefits of the indicator: Easy to assemble, does not overload the chart with unnecessary information. Can be used as a filter for any strategy. Works on
    COG LR Osc AM
    Andriy Matviyevs'kyy
    The presented indicator allows you to determine potential entry points into the market and set protective orders at reasonable levels. This product can be useful for both beginners and experienced traders. The indicator is based on calculation methods proven by time and practicing traders. The indicator is calculated in two stages: At the first stage, linear regression (LR) of the selected price type is determined for a given number of chart periods. At the second stage, the obtained data is p
    How to find out where to expect a price reversal with a probability of 80% - 90%? The "Statistics of Price Movements" indicator collects statistics of significant price movements, skipping all small pullbacks, for a certain period of time and displays them in Excel file. Sort the data in ascending order and get statistics of price reversals in 80%, 85%, 90%, 95% of all cases! (for example, in 2 years!) After the reversal, the price will move from 1000 pips or more! So... Open the dail
    Trend PA
    Mikhail Nazarenko
    5 (3)
    The Trend PA indicator uses   Price Action   and its own filtering algorithm to determine the trend. This approach helps to accurately determine entry points and the current trend on any timeframe. The indicator uses its own algorithm for analyzing price changes and Price Action. Which gives you the advantage of recognizing, without delay, a new nascent trend with fewer false positives. Trend filtering conditions can be selected in the settings individually for your trading style. The indicator
    The Chaikin Oscillator is a technical indicator developed by Marc Chaikin that combines price and volume data to measure the accumulation and distribution of a financial instrument. It aims to identify potential buying and selling opportunities in the market. The Chaikin Oscillator is calculated by subtracting a 10-day exponential moving average of the Accumulation Distribution Line (ADL) from a 3-day exponential moving average of the ADL. Here's how to use the Chaikin Oscillator indicator in tr
    MACD Divergence
    Sergey Deev
    2.5 (2)
    The indicator detects divergence signals - the divergences between the price peaks and the MACD oscillator values. The signals are displayed as arrows in the additional window and are maintained by the messages in a pop-up window, e-mails and push-notifications. The conditions which formed the signal are displayed by lines on the chart and in the indicator window. Indicator Parameters MacdFast - fast MACD line period MacdSlow - slow MACD line period MacdSignal - MACD signal line period MacdPri
    RaysFX Supertrend Bar RaysFX Supertrend Bar è un indicatore personalizzato per MetaTrader 4. Utilizza l'indice di canale delle materie prime (CCI) per generare segnali di trading. L'indicatore mostra dei puntini in una finestra separata sotto il grafico principale per indicare i segnali di trading. Caratteristiche principali: Calcola il CCI per diversi periodi temporali. Visualizza puntini per indicare i segnali di trading. Permette all'utente di modificare i periodi temporali e la distanza tra
    如果产品有任何问题或者您需要在此产品上添加功能,请联系我 Contact/message me if you encounter any issue using the product or need extra feature to add on the base version. There are two critical components in a profitable trading system. One is entry (placing an order) and another one is exit (closing an order). You can exit by time: closing order after London Close, for example. You can also exit by position: closing an order when price reaches a certain support/resistance level. Easy RR Monitor Panel is an intuitive, an
    Distinctive
    Tatiana Savkevych
    Distinctive is a forex trending arrow indicator for identifying potential entry points. I like it, first of all, because it has a simple mechanism of work, adaptation to all time periods and trading tactics. Created on the basis of a regression channel with filters. Plotting the Lawrence indicator signals on a price function chart using a mathematical approach. How it works - when the price breaks out in the overbought / oversold zone (channel levels), a buy or sell signal is generated. Every
    Sto Signal AM
    Andriy Matviyevs'kyy
    5 (1)
    This indicator displays Stochastic osc signals on the price chart and allows the user to receive notifications of such signals. The Stochastic indicator is a classic and proven indicator of the technical analysis of the markets. Despite its age, it is still relevant today. Depending on the settings, the indicator allows you to work effectively on various TFs and any markets. Signals are given on fully formed bars and are not redrawn. Custom Parameters: Stochastic_Price (0-1) - The applied pric
    FREE
    Trend Code
    Ning Liu
    4 (1)
    Trend Code (v2.0) Trend Code is a very simple and yet effective trend indicator to capture trend movement, detect the trend reversal, calculate entry price as well as proper stop loss. Trend Code indicator is made up of a series of block, while bull trend block in bull colour and bear block in bear trend colour. For bull trend block, the TrendOpen is the lower edge, TrendClose is the upper edge, for bear trend block, the other way round. Parameters: TrendOpenAdjustment   = 0.8, (range 0~1.0) Tr
    The indicator shows harmonic patterns on the chart without repainting with the minimum possible lag. The search for indicator tops is based on the wave principle of price analysis. Advanced settings allow you to choose parameters for your trading style. At the opening of a candle (bar), when a new pattern is formed, an arrow of the probable direction of the price movement is fixed, which remains unchanged. The indicator recognizes the following patterns and their varieties: ABCD, Gartley (Butter
    The principle of constructing indicator lines and their meaning .               The Signal Channel   indicator uses a robust filtering method based on two moving medians applicable to the High and Low prices, i.e. the lines <High> and <Low>, where <..> is the sign of linear averaging, which are shifted by certain values ​​in an uptrend and by opposite values ​​in a downtrend, which allows you to get a narrow channel, approximately outlining each bar. Sharp kinks of the lines of such a channel a
    Title : UT_Bot - ATR-Based Trading Indicator Introduction : Discover the power of "UT_Bot," the ultimate trading indicator that leverages the Average True Range (ATR) to provide unparalleled accuracy in your trading decisions. If you're seeking a more reliable alternative to the Super Trend indicator, look no further. UT_Bot is your key to precision trading. Key Features : ATR-Powered Precision: UT_Bot uses the ATR to deliver accurate signals that adapt to market volatility. Enhanced Trend Detec
    Ticks Line Chart is a professional indicator for the MetaTrader 4 platform. This indicator allows displaying a tick chart in a separate window, so that you can see price changes inside bars. Note that the Strategy Tester of the MetaTrader 4 trading platform only shows the static spread, that is why in in the tester the distance between the ASK and Bid prices will always be the same. Indicator Benefits Perfect for scalping. A unique indicator, there are no free analogues. Using the flexible ind
    Forex scalping indicator that does not redraw its arrows. It works best on M5, M15, M30, H1 timeframes. The default settings are for M5 timeframe. The picture below shows an example of working on the H1 chart with the "period=0.35" parameter value. You can download the demo version and test it yourself. Now we use the signals of this indicator in almost all of our scalping strategies. According to our calculations, the accuracy of its signals is about 95% depending on the timeframe. The indicato
    The indicator detects and displays М. Gartley's Butterfly pattern. The pattern is plotted by the extreme values of the ZigZag indicator (included in the resources, no need to install). After detecting the pattern, the indicator notifies of that by the pop-up window, a mobile notification and an email. The pattern and wave parameters are displayed on the screenshots. The default parameters are used for demonstration purposes only in order to increase the amount of detected patterns. Parameters
    Trendiness Index
    Libertas LLC
    5 (3)
    "The trend is your friend" is one of the best known sayings in investing, because capturing large trendy price movements can be extremely profitable. However, trading with the trend is often easier said than done, because many indicators are based on price reversals not trends. These aren't very effective at identifying trendy periods, or predicting whether trends will continue. We developed the Trendiness Index to help address this problem by indicating the strength and direction of price trend
    Trade with Gann on your side!! MASTER CIRCLE 360 CIRCLE CHART, originally created by Gann admitted that this is “The Mother of all charts”. It is one of the last studies that this great trader left for us. The numeric tab le is apparently quite simple like all the tables and is based on square numbers, the SQUARE OF 12 and is by evolution, one of the most important square numbers. Here we can find CYCLE, PRICE AND TIME thanks to angles and grades, to show past and future support and resistance.
    VR Grid
    Vladimir Pastushak
    4.57 (7)
    The VR Grid indicator is designed to create a graphical grid with user-defined settings. Unlike the standard grid , VR Grid is used to build circular levels . Depending on the user's choice, the step between the round levels can be arbitrary. In addition, unlike other indicators and utilities, VR Grid maintains the position of the grid even when the time period changes or the terminal is rebooted. You can find settings, set files, demo versions, instructions, problem solving, at [blog] You can
    FREE
    New, more accurate version of the Xmaster indicator. More than 200 traders from around the world have conducted more than 15,000 tests of different combinations of this indicator on their PCs in order to get the most effective and accurate formula. And here we present to you the "Xmaster formula indicator forex no repaint" indicator, which shows accurate signals and does not repaint. This indicator also sends signals to the trader by email and push. With the arrival of each new tick, it constan
    Trend Ray
    Andriy Sydoruk
    The indicator shows the potential trend direction by cyclical-wave dependence. Thus, all the rays of the intersection will be optimal rays, in the direction of which the price is expected to move, taking into account the indicator period. Rays can be used as a direction for potential market movement. But we must not forget that the approach must be comprehensive, the indicator signals require additional information to enter the market.
    The indicator detects and displays the AB=CD harmonic pattern on the chart according to the scheme provided in the screenshot. The pattern is plotted by the extreme values of the ZigZag indicator (included in the resources, does not require additional installation). After detecting the pattern, the indicator notifies of that by the pop-up window, a mobile notification and an email. The indicator highlights not only the complete figure, but also the time of its formation. During the formation the
    FreqoMaster
    Stanislav Korotky
    The main idea of this indicator is rates analysis and prediction by Fourier transform. The indicator decomposes exchange rates into main harmonics and calculates their product in future. The indicator shows 2 price marks in history, depicting price range in the past, and 2 price marks in future with price movement forecast. Buy or sell decision and take profit size are displayed in a text label in the indicator window. The indicator uses another indicator as an engine for calculations - FreqoMet
    VR Cub
    Vladimir Pastushak
    VR Cub is an indicator for getting high-quality entry points. The indicator was developed to facilitate mathematical calculations and simplify the search for entry points into a position. The trading strategy for which the indicator was written has been proving its effectiveness for many years. The simplicity of the trading strategy is its great advantage, which allows even novice traders to successfully trade with it. VR Cub calculates position opening points and Take Profit and Stop Loss targe
    Buyers of this product also purchase
    Gann Made Easy
    Oleg Rodin
    4.93 (72)
    Gann Made Easy is a professional and easy to use Forex trading system which is based on the best principles of trading using the theory of mr. W.D. Gann. The indicator provides accurate BUY and SELL signals including Stop Loss and Take Profit Levels. You can trade even on the go using PUSH notifications. PLEASE CONTACT ME AFTER PURCHASE TO GET MY TRADING TIPS PLUS A GREAT BONUS! Probably you heard already many times about Gann trading methods. Usually Gann's theory is very complex thing not only
    CURRENTLY 26% OFF Best Solution for any Newbie or Expert Trader! This Indicator is a unique, high quality and affordable trading tool because we have incorporated a number of proprietary features and a new formula. With only ONE chart you can read Currency Strength for 28 Forex pairs! Imagine how your trading will improve because you are able to pinpoint the exact trigger point of a new trend or scalping opportunity? User manual: click here That's the first one, the original! Don't buy a worthle
    Trend Punch
    Mohamed Hassan
    5 (10)
    Manual guide:   Click here PROMO of  $79 for 2 copies left!  -- Next price is  $149 .  This indicator is unstoppable when combined with our other indicator called  Support & Resistance . After purchase, send us a message and you will get it   for  FREE as a BONUS! I like to use Trend Punch on XAUUSD & BTCUSD on the M1 timeframe!  Introducing Trend Punch , the revolutionary forex trend indicator that will transform the way you trade! Trend Punch is uniquely designed to provide preci
    Scalper Inside PRO
    Alexey Minkov
    4.74 (58)
    An exclusive indicator that utilizes an innovative algorithm to swiftly and accurately determine the market trend. The indicator automatically calculates opening, closing, and profit levels, providing detailed trading statistics. With these features, you can choose the most appropriate trading instrument for the current market conditions. Additionally, you can easily integrate your own arrow indicators into Scalper Inside Pro to quickly evaluate their statistics and profitability. Scalper Inside
    TPSpro RFI Levels
    Roman Podpora
    4.82 (17)
    Reversal First Impulse levels (RFI)    INSTRUCTIONS        RUS       -       ENG              R ecommended to use with an indicator   -   TREND PRO -  Version MT5 A key element in trading is zones or levels from which decisions to buy or sell a trading instrument are made. Despite attempts by major players to conceal their presence in the market, they inevitably leave traces. Our task was to learn how to identify these traces and interpret them correctly. Main functions: Displaying active zones
    Atomic Analyst
    Issam Kassas
    5 (3)
    First of all Its worth emphasizing here that this Trading Indicator is   Non-Repainting , Non Redrawing and Non Lagging Indicator   Indicator, Which makes it ideal from both manual and robot trading.  User manual: settings, inputs and strategy . The Atomic Analyst  is a PA Price Action Indicator that uses Strength and Momentum of the price to find a better edge in the market. Equipped with Advanced filters which help remove noises and false signals, and Increase Trading Potential. Using Multipl
    Advanced Supply Demand
    Bernhard Schweigert
    4.92 (312)
    CURRENTLY 26% OFF !! Best Solution for any Newbie or Expert Trader! This indicator is a unique, high quality and affordable trading tool because we have incorporated a number of proprietary features and a new formula. With this update, you will be able to show double timeframe zones. You will not only be able to show a higher TF but to show both, the chart TF, PLUS the higher TF: SHOWING NESTED ZONES. All Supply Demand traders will love it. :) Important Information Revealed Maximize the potenti
    Market Reversal Alerts
    LEE SAMSON
    4.21 (121)
    Profit from market structure changes as price reverses and pulls back. The market structure reversal alert indicator identifies when a trend or price move is approaching exhaustion and ready to reverse. It alerts you to changes in market structure which typically occur when a reversal or major pullback are about to happen. The indicator identifies breakouts and price momentum initially, every time a new high or low is formed near a possible exhaustion point. The indicator draws in a rectangle on
    Currently 20% OFF ! Best Solution for any Newbie or Expert Trader! This dashboard software is working on 28 currency pairs plus one. It is based on 2 of our main indicators (Advanced Currency Strength 28 and Advanced Currency Impulse). It gives a great overview of the entire Forex market plus Gold or 1 indices. It shows Advanced Currency Strength values, currency speed of movement and signals for 28 Forex pairs in all (9) timeframes. Imagine how your trading will improve when you can watch the e
    TPSproTREND PrO
    Roman Podpora
    4.78 (18)
    TPSpro TRENDPRO  - is a trend indicator that automatically analyzes the market and provides information about the trend and each of its changes, as well as giving signals for entering trades without redrawing! The indicator uses each candle, analyzing them separately. referring to different impulses - up or down impulse. Exact entry points into transactions for currencies, crypto, metals, stocks, indices!  -  Version MT5               DETAILED DESCRIPTION                R ecommended to use with
    Legacy of Gann
    Pavel Zamoshnikov
    4.83 (12)
    The indicator very accurately determines the levels of the possible end of the trend and profit fixing. The method of determining levels is based on the ideas of W.D.Gann, using an algorithm developed by his follower Kirill Borovsky. Extremely high reliability of reaching levels (according to K. Borovsky  - 80-90%) Indispensable for any trading strategy – every trader needs to determine the exit point from the market! Precisely determines targets on any timeframes and any instruments (forex, met
    FX Power MT4 NG
    Daniel Stein
    5 (10)
    Trading GOLD, and currencies, with the dog walk strategy  - super smart Trading GOLD, and currencies, with the breakout strategy  - super easy Visit our all-new   Stein Investments Welcome Page   to get the latest information, updates and trading strategies. FX Power MT4 NG  is the next generation of our long-time very popular currency strength meter, FX Power.  And what does this next-generation strength meter offer? Everything you have loved about the original FX Power  PLUS GOLD/XAU stre
    FX Volume
    Daniel Stein
    4.6 (35)
    Visit our all-new   Stein Investments Welcome Page   to get the latest information, updates and trading strategies. FX Volume is the FIRST and ONLY volume indicator that provides a REAL insight into the market sentiment from a broker's point of view. It provides awesome insights into how institutional market participants, like brokers, are positioned in the Forex market, much faster than COT reports. Seeing this information directly on your chart is the real game-changer and breakthrough solut
    Gold Stuff
    Vasiliy Strukov
    4.89 (259)
    Gold Stuff is a trend indicator designed specifically for gold and can also be used on any financial instrument. The indicator does not redraw and does not lag. Recommended time frame H1. At it indicator work full auto  Expert Advisor EA Gold Stuff. You can find it at my profile. Contact me immediately after the purchase to get   personal bonus!  You can get a free copy of our Strong Support and Trend Scanner indicator, please pm. me! Settings  and manual here   SETTINGS Draw Arrow - on off. dra
    Auto Order Block with break of structure based on ICT and Smart Money Concepts (SMC) Futures Break of Structure ( BoS )             Order block ( OB )            Higher time frame Order block / Point of Interest ( POI )    shown on current chart           Fair value Gap ( FVG ) / Imbalance   -  MTF      ( Multi Time Frame )    HH/LL/HL/LH  -  MTF      ( Multi Time Frame )  Choch  MTF      ( Multi Time Frame )  Volume Imbalance     ,  MTF          vIMB Gap’s Power of 3 Equal High
    First of all Its worth emphasizing here that this Trading Tool is Non-Repainting Non-Redrawing and Non-Lagging Indicator Which makes it ideal for professional trading . Online course, user manual and demo. The Smart Price Action Concepts Indicator is a very powerful tool for both new and experienced traders . It packs more than 20 useful indicators into one combining advanced trading ideas like Inner Circle Trader Analysis and Smart Money Concepts Trading Strategies . This indicator focuses on
    ICT, SMC, SMART MONEY CONCEPTS, SMART MONEY, Smart Money Concept, Support and Resistance, Trend Analysis, Price Action, Market Structure, Order Blocks, BOS/CHoCH,   Breaker Blocks ,  Momentum Shift, Supply&Demand Zone/Order Blocks , Strong Imbalance, HH/LL/HL/LH,    Fair Value Gap, FVG,  Premium  &   Discount   Zones, Fibonacci Retracement, OTE, Buy Side Liquidity, Sell Side Liquidity, BSL/SSL Taken, Equal Highs & Lows, MTF Dashboard, Multiple Time Frame, BigBar, HTF OB, HTF Market Structure,  L
    This indicator I use with RENKO and RangeBar candle Discover the Secret to Successful Forex Trading with Our Custom MT4 Indicator! Have you ever wondered how to achieve success in the Forex market, consistently earning profits while minimizing risk? Here is the answer you've been searching for! Allow us to introduce our proprietary MT4 indicator that will revolutionize your approach to trading. Unique Versatility Our indicator is specially designed for users who prefer Renko and Rangebar candle
    Volatility Trend System - a trading system that gives signals for entries. The volatility system gives linear and point signals in the direction of the trend, as well as signals to exit it, without redrawing and delays. The trend indicator monitors the direction of the medium-term trend, shows the direction and its change. The signal indicator is based on changes in volatility and shows market entries. The indicator is equipped with several types of alerts. Can be applied to various trading
    TakePropips Donchian Trend Pro
    Eric John Pajarillaga Aldana
    4.82 (17)
    TakePropips Donchian Trend Pro  (MT4) is a powerful and effective tool that automatically detects the direction of the trend using the Donchian Channel and provides you with an entry and exit trading signals! This multi-function indicator includes a trend scanner, trading signals, statistical panel, screener, trading sessions, and alerts history dashboard. It is designed to provide you with trading signals and save you hours analyzing the charts! You can download the user manual and installation
    Currency Strength Wizard is a very powerful indicator that provides you with all-in-one solution for successful trading. The indicator calculates the power of this or that forex pair using the data of all currencies on multiple time frames. This data is represented in a form of easy to use currency index and currency power lines which you can use to see the power of this or that currency. All you need is attach the indicator to the chart you want to trade and the indicator will show you real str
    Break and Retest
    Mohamed Hassan
    4.43 (14)
    New update to V.4 where  Break & Retest automatically draws the take profit & stop loss levels and you also have more signals per day! ‍You can visually backtest Break & Retest to see how it behaved in the past!     Manual guide:   Click here $60 for a very limited time. Next price is $120   This Indicator only places quality trades when the market is really in your favor with a clear break and retest. Patience is key with this price action strategy! If you want more alert s
    Trend Screener
    STE S.S.COMPANY
    4.83 (88)
    Unlock the Power of  Trends trading with Trend Screener Indicator: Your Ultimate Trend Trading Solution powered by fuzzy logic and Multi-currencies System ! Elevate your trend trading with Trend Screener, the revolutionary trend indicator powered by   fuzzy logic.  It is a powerful trend-following indicator that combines over  13 premium tools and features and 3 trading strategies  , making it a versatile choice to   make your Metatrader a Trend Analyzer. LIMITED TIME OFFER : Trend Screener Indi
    M1 Arrow
    Oleg Rodin
    5 (14)
    M1 Arrow is an indicator which is based on natural trading principles of the market which include volatility and volume analysis. The indicator can be used with any time frame and forex pair. One easy to use parameter in the indicator will allow you to adapt the signals to any forex pair and time frame you want to trade. The Arrows DO NOT REPAINT and DO NOT LAG! The algorithm is based on the analysis of volumes and price waves using additional filters. The intelligent algorithm of the indicato
    NAM Order Blocks
    NAM TECH GROUP, CORP.
    5 (1)
    MT4 Multi-timeframe Order Blocks detection indicator. Features - Fully customizable on chart control panel, provides complete interaction. - Hide and show control panel wherever you want. - Detect OBs on multiple timeframes. - Select OBs quantity to display. - Different OBs user interface. - Different filters on OBs. - OB proximity alert. - ADR High and Low lines. - Notification service (Screen alerts | Push notifications). Summary Order block is a market behavior that indicates order collection
    Advanced Currency IMPULSE with ALERT
    Bernhard Schweigert
    4.91 (494)
    CURRENTLY 31% OFF !! Best Solution for any Newbie or Expert Trader! This indicator is a unique, high quality and affordable trading tool because we have incorporated a number of proprietary features and a secret formula. With only ONE chart it gives Alerts for all 28 currency pairs. Imagine how your trading will improve because you are able to pinpoint the exact trigger point of a new trend or scalping opportunity! Built on new underlying algorithms it makes it even easier to identify and confir
    Entry Points Pro
    Yury Orlov
    4.7 (226)
    Top indicator for MT4 providing accurate signals to enter a trade without repainting! Watch  the video  (6:22) with an example of processing only one signal that paid off the indicator! It can be applied to any financial assets:  forex, cryptocurrencies, metals, stocks, indices.  MT5 version is here   It will provide pretty accurate trading signals and tell you when it's best to open a trade and close it. Most traders improve their trading results during the first trading week with the help of t
    BullsEye Signal NoRepaint
    Martin Alejandro Bamonte
    BullseyeSignal – NoRepaint is a signal that, as the name suggests, never repaints under any circumstances. The signal is issued on the same candle observed in the image. It is ideal for highly volatile markets such as forex, cryptocurrencies, stocks, indices, and futures. You will only see a green arrow for buying and a red arrow for selling, but there are many indicators working together behind them to provide a more simplified trading experience. It is specifically designed to provide precise
    PRO Renko System
    Oleg Rodin
    5 (25)
    PRO Renko System is a highly accurate trading system specially designed for trading RENKO charts. The ARROWS and Trend Indicators DO NOT REPAINT! The system effectively neutralizes so called market noise giving you access to accurate reversal signals. The indicator is very easy to use and has only one parameter responsible for signal generation. You can easily adapt the tool to any trading instrument of your choice and the size of the renko bar. I am always ready to provide extra support to help
    TrendMaestro
    Stefano Frisetti
    5 (3)
    note: this indicator is for METATRADER4, if you want the version for METATRADER5 this is the link:  https://www.mql5.com/it/market/product/108106 TRENDMAESTRO ver 2.4 TRENDMAESTRO recognizes a new TREND in the bud, he never makes mistakes. The certainty of identifying a new TREND is priceless. DESCRIPTION TRENDMAESTRO identifies a new TREND in the bud, this indicator examines the volatility, volumes and momentum to identify the moment in which there is an explosion of one or more of these data a
    More from author
    Close Button
    Wang Yu
    4.78 (54)
    如果产品有任何问题或者您需要在此产品上添加功能,请联系我 Contact/message me if you encounter any issue using the product or need extra feature to add on the base version. Close Button provides you an intuitive, effective, and handy way to close your orders based on their type. The utility provides seven close options: Close All: close all orders, including trading and pending ones. Close Profit: close all orders which are in profit. Close Loss: close all orders which are in loss. Close Stop: close all stop orders. Close
    FREE
    Close Button MT5
    Wang Yu
    2.78 (23)
    如果产品有任何问题或者您需要在此产品上添加功能,请联系我 Contact/message me if you encounter any issue using the product or need extra feature to add on the base version. You can get the free Close Button MT4 version at LINK . Close Button provides you an intuitive, effective, and handy way to close your orders and/or positions based on their type and their profit status. The tool provides seven close options: Close All: close all pending orders and positions. Close Profit: close all positions which are in profit. Close
    FREE
    如果产品有任何问题或者您需要在此产品上添加功能,请联系我 Contact/message me if you encounter any issue using the product or need extra feature to add on the base version. PA Touching Alert is a tool to free you from watching price to touch certain critical price levels all day alone. With this tool, you can set two price levels: upper price and lower price, which should be greater than/less than the current price respectively. Then once price touches the upper price or lower price, alert and/or notification would be sent
    FREE
    如果产品有任何问题或者您需要在此产品上添加功能,请联系我 Contact/message me if you encounter any issue using the product or need extra feature to add on the base version. Floating Highest Lowest MT5 provides you an intuitive and user-friendly method to monitor the floating highest (profit) and lowest (loss) that all your trades together ever arrive. For example, I opened 3 orders, which arrived at $4.71 floating profit when trade following trend. Later when the trend is against me, these 3 orders arrive $30 in loss, and
    FREE
    如果产品有任何问题或者您需要在此产品上添加功能,请联系我 Contact/message me if you encounter any issue using the product or need extra feature to add on the base version. Dashboard Super Candle is an intuitive, and handy graphic tool to help you to: Have 28 pairs under control with one dashboard. Monitor candle direction, identify possible price movement and trend. Provide trading signals based on the candle direction selected by you. Automatically manage order once signal are generated. Have the ability to select which
    By applying this expert onto any char window, you are able to force download the historical data upon all time-frame (PERIOD_M1, PERIOD_M5, PERIOD_M15, PERIOD_M30, PERIOD_H1, PERIOD_H4, PERIOD_D1, PERIOD_W1, PERIOD_MN1) of 28 major pairs. The 28 major pairs are the combination of the 8 major currencies. 8 major currencies "USD", "EUR", "GBP", "JPY", "AUD", "NZD", "CAD", "CHF" 28 pairs "AUDCAD","AUDCHF","AUDJPY","AUDNZD","AUDUSD","CADCHF","CADJPY" "CHFJPY","EURAUD","EURCAD","EURCHF","EURGBP",
    FREE
    如果产品有任何问题或者您需要在此产品上添加功能,请联系我 Contact/message me if you encounter any issue using the product or need extra feature to add on the base version. Indicator Floating Highest Lowest provides you an intuitive, and user-friendly method to monitor the floating highest (profit) and lowest (loss) that all your trades together ever arrive. For example, I opened 3 orders, which arrived at $4.71 floating profit when trade following trend. Later when the trend is against me, these 3 orders arrive $30 in los
    FREE
    如果产品有任何问题或者您需要在此产品上添加功能,请联系我 Contact/message me if you encounter any issue using the product or need extra feature to add on the base version. Dashboard Genesis Matrix Trading MT5 Demo is the demo version of Dashboard Genesis Matrix Trading MT5 , which has full functionalities of the paid version, except EMA5_HA is not available Stochastic 2 is not available Stochastic 1 time-frame is fixed at M5 TVI is not available DB_timeframe is fixed at M5 Send alert function is not available Sent notific
    FREE
    如果产品有任何问题或者您需要在此产品上添加功能,请联系我 Contact/message me if you encounter any issue using the product or need extra feature to add on the base version. To access the free demo version, please re-direct to this LINK . To access the dashboard version, please re-direct to this LINK . Critical Support and Resistance is an intuitive, and handy graphic tool to help you to monitor and manage critical support and resistance price point easily with one glance to know status of all important S&R. Price is likely
    Dashboard Super MA RSI CCI Demo is the demo version of Dashboard Super MA RSI CCI, which have full functionalities of the paid version, except Timeframe of MA1, MA2, RSI, and CCI has been fixed to be TF_MA1=M30, TF_MA2=H1, TF_RSI=M30, TF_CCI=M30 (full version has ability to adjust/select full range timeframe for MA1, MA2, RSI, and CCI). To access the full version, please re-direct to this LINK . Dashboard Super MA RSI CCI is an intuitive and handy graphic tool to help you to: Have 28 pairs under
    FREE
    Dashboard Symphonie Trader System Demo is the demo version of Dashboard Symphonie Trader System , LINK , which has full functionalities of the paid version, except Stochastic 2 is not available Dashboard timeframe Stochastic 1 time-frame is fixed at M5 Extreme signal is not available Sentiment signal is not available This system basically utilizes Symphonie Indicator Set (Extreme, Emotion, Trend, and Sentiment) as the core indicators to generate trading signal mainly on time-frame M15. The signa
    FREE
    Dashboard Super CandleDemo is the demo version of Dashboard Super Candle, which have full functionalities of the paid version, except only candle of M5, M30 and H4 will be used for signal generation (full version has candle of all timeframe).   To access the full version, please re-direct to this LINK . Features Provide an intuitive way to generate trading signal, to manage trades, and to monitor trading positions. Customizable trading session: total 3 sessions can be set for autotrade. Custom
    FREE
    Dashboard Extreme TMA System Demo is the demo version of Dashboard Extreme TMA System , LINK , which has full functionalities of the paid version, except TMA3 and TMA4 are not available Only two options for TMA and TMA Band time-frame: M5 and M15 Stochastic filter is not available This system basically utilizes 4 TMA (Triangular Moving Average) slope indicators on 4 time-frame and TMA Band as the core indicators to generate trading signal mainly on time-frame M15. The signal will be further filt
    FREE
    如果产品有任何问题或者您需要在此产品上添加功能,请联系我 Contact/message me if you encounter any issue using the product or need extra feature to add on the base version Dashboard Super Currency Strength Demo is the demo version of Dashboard Super Currency Strength, which have full functionalities of the paid version, except only 1 currency strength meter with timefrme of M30 and H1 will be used for signal generation (full version has 3 currency strength meters with full timeframe selection). Please re-direct to LINK for
    FREE
    如果产品有任何问题或者您需要在此产品上添加功能,请联系我 Contact/message me if you encounter any issue using the product or need extra feature to add on the base version. To access the full version, please re-direct to this LINK . To access the dashboard version, please re-direct to this LINK . Dashboard Super Exit Demo is the demo version of Dashboard Super Exit, which have full functionalities of the paid version, except Only two support/resistance levels (Daily Pivot and Weekly Pivot) are available for RR ratio calcul
    FREE
    如果产品有任何问题或者您需要在此产品上添加功能,请联系我 Contact/message me if you encounter any issue using the product or need extra feature to add on the base version. Session TakeProfit StopLoss is basically helping to set the take profit and stop loss in dollar for the total open orders (session). Once the total profit is greater than session_tp or less than session_sl, the EA will help to close all open orders acting similarly to a take profit/stop loss for a single order. Inputs session_tp: session take profit s
    FREE
    Dashboard Super Candle Demo is the demo version of Dashboard Super Candle, which have full functionalities of the paid version, except Only candle of M5, M30 and H4 will be used for signal generation (full version has candle of all timeframe). To access the full version, please re-direct to this LINK . Dashboard Super Candle is an intuitive and handy graphic tool to help you to: Have 28 pairs under control with one dashboard. Monitor candle direction; identify possible price movement and trend.
    FREE
    如果产品有任何问题或者您需要在此产品上添加功能,请联系我 Contact/message me if you encounter any issue using the product or need extra feature to add on the base version. Dashboard Super Currency Strength MT5 Demo is the demo version of Dashboard Super Currency Strength MT5 , which has full functionalities of the paid version, except only 1 currency strength meter with time-frame of M30 and H1 will be used for signal generation (full version has 3 currency strength meters with full timeframe selection). Full version: LIN
    FREE
    Dashboard Timeframe 15 MT5 Demo is the demo version of Dashboard Timeframe 15 MT5 , which has full functionalities of the paid version, except TDI Base, TDI Price, and Round Number filter is not available. Time-frame is fixed at M5 Full version: LINK MT4 version: LINK This system basically utilizes TDI as the core indicator to generate trading signal mainly on time-frame M15. The signal will be further filtered and trimmed by 1) 200 EMA and Price; 2) 10 EMA and Heiken Ashi Candle; 3) Round num
    FREE
    如果产品有任何问题或者您需要在此产品上添加功能,请联系我 Contact/message me if you encounter any issue using the product or need extra feature to add on the base version. Dashboard Babon Scalping System MT5 Demo is the demo version of Dashboard Babon Scalping System MT5, which has full functionalities of the paid version, except TDI Cross, TDI Momentum, TDI Price are not available Slope and Ichimoku are not available Only 5 pairs are included in demo version Full version: LINK MT4 version: LINK This system basically util
    FREE
    To access the full version, please re-direct to this LINK . To access the single pair version, please re-direct to this LINK . Dashboard Super Risk Reward PanelMT5Demo is the demo version of Dashboard Super Risk Reward Panel MT5, which have full functionalities of the paid version, except Only two support/resistance levels (Daily Pivot and Weekly Pivot) are available for RR ratio calculation Sell button is disabled Features User is able to select support and resistance levels for RR ratio gene
    FREE
    Please re-direct to LINK for full version. Dashboard Super Exit Demo is the demo version of Dashboard Super Exit, which have full functionalities of the paid version, except Only two support/resistance levels (Daily Pivot and Weekly Pivot) are available for RR ratio calculation Sell button is disabled Features User is able to select support and resistance levels for RR ratio generating. Adjustable indicator panel position Make sure completing the following action items to make this dashboard w
    FREE
    Dashboard Timeframe 15Demo is the demo version of Dashboard Timeframe 15 , LINK , which have full functionalities of the paid version, except TDI Base, TDI Price, and Round Number filter is not available. Time-frame is fixed at M5 This system basically utilizes TDI as the core indicator to generate trading signal mainly on time-frame M15. The signal will be further filtered and trimmed by 1) 200 EMA and Price; 2) 10 EMA and Heiken Ashi Candle; 3) Round number. To facilitate you to understand and
    FREE
    提供专业的EA编程服务,推出特色仪表盘EA编程,将您的交易策略自动化,可视化,一个图表管理多个交易货币对,详情查看: http://www.ex4gzs.com  Providing quick Developments and Conversion of MT4/MT5 EAs, Indicators, Scripts, and Tools. If you are looking for an Dashboard EA to turn your trading strategy into auto trading algo and to manage multi trades in one chart with visualizing tool, come and visit http://www.ex4gzs.com/en for more details. 如果产品有任何问题或者您需要在此产品上添加功能,请联系我 Contact/message me if you encounter any issue using the product or need extra featur
    FREE
    Dashboard Genesis Matrix Trading Demo is the demo version of Dashboard Genesis Matrix Trading, LINK , which has full functionalities of the paid version, except EMA5_HA is not available Stochastic 2 is not available Stochastic 1 time-frame is fixed at M5 TVI is not available DB_timeframe is fixed at M5 Send alert function is not available Sent notification function is not available This system basically utilizes Genesis Indi Set (TVI, CCI, GannHilo, and T3) as the core indicators to generate tra
    FREE
    Dashboard Super MA RSI CCI Demo is the demo version of Dashboard Super MA RSI CCI, which have full functionalities of the paid version, except timeframe of MA1, MA2, RSI, and CCI has been fixed to be TF_MA1=M30, TF_MA2=H1, TF_RSI=M30, TF_CCI=M30 (full version has ability to adjust/select full range timeframe for MA1, MA2, RSI, and CCI). To access the full version, please re-direct to this LINK . Entry Signal Refer to screenshot2 Make sure completing the following action items to make this da
    FREE
    如果产品有任何问题或者您需要在此产品上添加功能,请联系我 Contact/message me if you encounter any issue using the product or need extra feature to add on the base version. To access the full version, please re-direct to this LINK . To access the single pair version, please re-direct to this LINK . Price is likely to pullback or breakout at important support and/or resistance. This dashboard is designed to help you monitor these critical support and resistance area. Once price moves close to these important support and res
    FREE
    Dashboard Super Three MA MT5 Demo is the demo version of Dashboard Super Three MA MT5 , which has full functionalities of the paid version, except MA Time-frame is fixed at M5 Filter Single is not available Full version: LINK MT4 version: LINK This system basically utilizes PA and three adjustable Moving Average as the main indicator set to generate trading signal. With the feature that all MA_timeframe, MA_period, MA_applied_price are adjustable, you can easily create almost any Moving Average
    FREE
    Dashboard Super Three MA Demo is the demo version of Dashboard Super Three MA, LINK , which have full functionalities of the paid version, except MA Time-frame is fixed at M5 Filter Single is not available This system basically utilizes PA and three adjustable Moving Average as the main indicator set to generate trading signal. With the feature that all MA_timeframe, MA_period, MA_applied_price are adjustable, you can easily create almost any Moving Average trading system with this dashboard and
    FREE
    如果产品有任何问题或者您需要在此产品上添加功能,请联系我 Contact/message me if you encounter any issue using the product or need extra feature to add on the base version. To access the full version, please re-direct to this LINK . To access the dashboard version, please re-direct to this LINK . Critical Support and Resistance Demo is the demo version of Critical Support and Resistance which have full functionalities of the paid version, except only Pivot R1/R2/R3 and Daily Open will be triggered for alert and/or notifica
    FREE
    Filter:
    Carla Cecilia Guevara
    2034
    Carla Cecilia Guevara 2020.02.19 21:47 
     

    Does anyone know how to make this dashboard work? Ive tried reaching out to the author but no luck so far. It loads a blank chart , no current price, no currencies, can someone please get back to me and help me load this dashboard?

    pnutfx503
    1524
    pnutfx503 2017.03.15 17:28 
     

    Helps you find trades at the right place and time. Very easy to pull up the anyone of the 28 pairs listed. It's a must have for anyone looking to trade multiple currency pairs, and using pivot points for their trading.

    Reply to review
    Version 1.3 2021.11.21
    Release with the latest build 2392, 11-Oct-2021