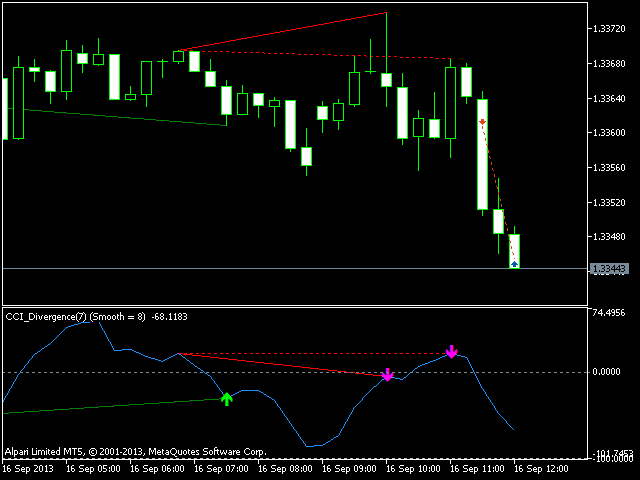
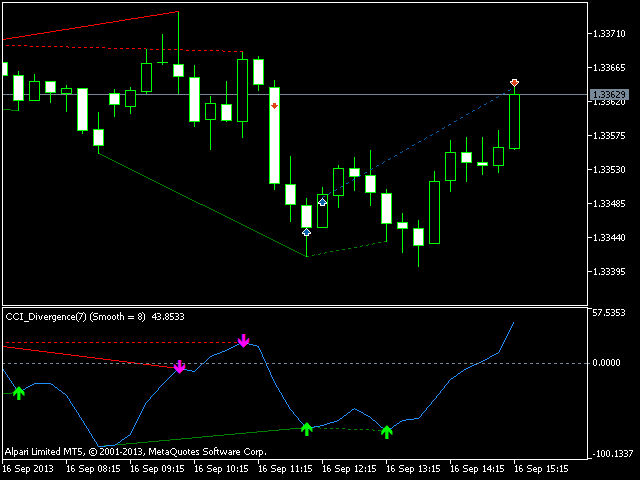
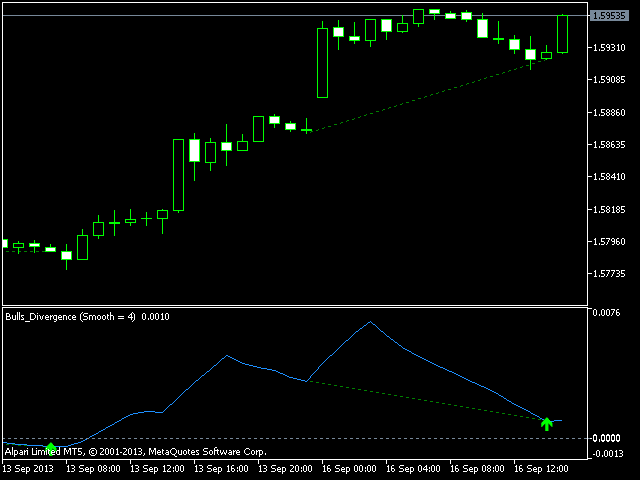
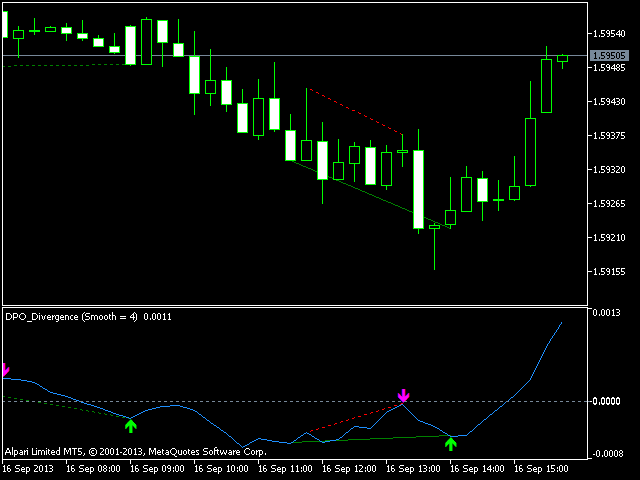
Divergence CCI or any custom

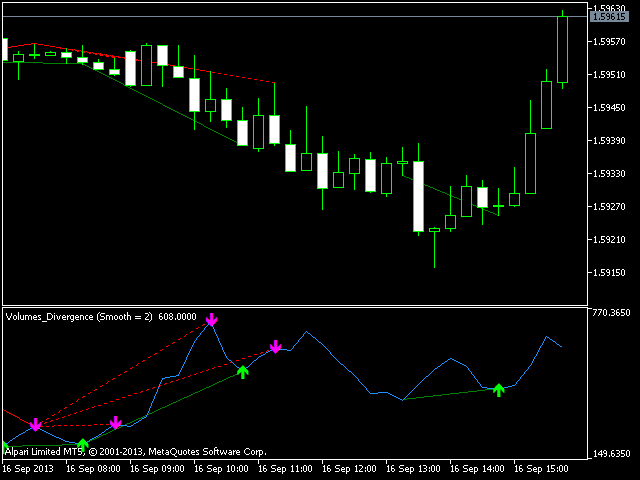
Displays divergence for any custom indicator. You just need to specify the name of an indicator name; on default it uses CCI.

In addition you can set smoothing for the selected indicator as well as levels. If one of these levels is crossed, you'll receive a notification. The custom indicator must be compiled (a file with extension EX5) and it must be located in MQL5/Indicators directory of the client terminal or in one of its subdirectories. It uses zero bar of the selected indicator with default parameters.


Input Parameters

  • Indicator name - name of an indicator, the divergence should be calculated for, CCI on default;
  • Period CCI - period of averaging of CCI, 7 on default;
  • Applied price - price used, Close price on default;
  • Smoothing method - method of smoothing, Simple on default;
  • Smooth - period of smoothing, 8 on default;
  • Level1 - level of the indicator, -100 on default;
  • Level2 - level of the indicator, -100 on default 100;
  • Calculated bar - number of bars to display divergence, 300 on default;
  • Filter by volume - volume filter, false on default. If it is enabled, then the divergence signals won't appear in case the volume is less than the average volume for previous 100 bars. Three modes are available: False, True, Auto. In Auto mode, the filter is automatically enabled on timeframes M30 and lower; and it is disabled on timeframes greater than M30;
  • Display divergence alert - enables notifications about divergence, true on default;
  • Display cross level alert - enables notifications about crossing the specified levels of the indicator, true on default;
  • Draw indicator trend lines - enables displaying the trend lines of the indicator during divergence, true on default;
  • Draw price trend lines - enables displaying the trend lines on the price chart during divergence, true on default;
  • Line bull divergence color - select a color for the trend line displayed during bullish divergence, Green on default;
  • Line bear divergence color - select a color for the trend line displayed during bearish divergence, Red on default.
Recommended products
RBreaker
Zhong Long Wu
RBreaker Gold Indicators is a short-term intraday trading strategy for gold futures that combines trend following and intraday reversal approaches. It not only captures profits during trending markets but also enables timely profit-taking and counter-trend trading during market reversals. This strategy has been ranked among the top ten most profitable trading strategies by the American magazine   Futures Truth   for 15 consecutive years. It boasts a long lifecycle and remains widely used and st
The Trend Duration Forecast MT5 indicator is designed to estimate the probable lifespan of a bullish or bearish trend. Using a Hull Moving Average (HMA) to detect directional shifts, it tracks the duration of each historical trend and calculates an average to forecast how long the current trend is statistically likely to continue. This allows traders to visualize both real-time trend strength and potential exhaustion zones with exceptional clarity. KEY FEATURES Dynamic Trend Detection:   Utiliz
This trading indicator is non-repainting, non-redrawing, and non-lagging, making it an ideal choice for both manual and automated trading. It is a Price Action–based system that leverages price strength and momentum to give traders a real edge in the market. With advanced filtering techniques to eliminate noise and false signals, it enhances trading accuracy and potential. By combining multiple layers of sophisticated algorithms, the indicator scans the chart in real-time and translates comple
Cvd Divergence
Thalles Nascimento De Carvalho
CVD Divergence – Professional Flow and Divergence Analysis CVD Divergence is a technical indicator designed to detect reliable divergences between price and Cumulative Delta Volume (CVD). It accurately identifies moments when the real order flow does not confirm the price movement, revealing potential reversals, exhaustion points, and institutional manipulation. The indicator combines aggressive volume analysis with structural price reading, delivering clear, objective, and early signals. What t
TRI Visualizer
Yoshimi Mon 三 Ura
TRI Visualizer MT5 – Thermodynamic Market Analysis Overview The TRI (Thermal Range Indicator) Visualizer Enhanced is a rare market analysis indicator that goes beyond conventional technical analysis, applying principles of thermodynamics from physics. It interprets market price fluctuations as “thermodynamic energy,” enabling the highly accurate detection of subtle market changes that are often overlooked. Innovative Mechanisms 1. Dual Calculation Engines Classic TRI Mode Formula: |Close
The Super Arrow Indicator provides non-repainting buy and sell signals with exceptional accuracy. Key Features No repainting – confirmed signals remain fixed Clear visual arrows: green for buy, red for sell Real-time alerts via pop-up, sound, and optional email Clean chart view with no unnecessary clutter Works on all markets: Forex, gold, oil, indices, crypto Adjustable Parameters TimeFrame Default:   "current time frame" Function:   Sets the time frame for indicator calculation Options:   Can
CosmiCLab SMC FIBO CosmiCLab SMC FIBO is a professional trading indicator designed for traders who use Smart Money Concepts (SMC), market structure analysis and Fibonacci retracement levels. The indicator automatically detects market swings and builds Fibonacci levels based on the latest impulse movement. It also identifies market structure changes such as BOS (Break of Structure) and CHOCH (Change of Character), helping traders understand the current market direction. CosmiCLab SMC FIBO also pr
Price Magnet — Price Density and Attraction Levels Indicator Price Magnet is a professional analytical tool designed to identify key support and resistance levels based on statistical Price Density. The indicator analyzes a specified historical period and detects price levels where the market spent the most time. These zones act as “magnets,” attracting price action or forming a structural base for potential reversals. Unlike traditional Volume Profile tools, Price Magnet focuses on price-time d
This indicator presents an alternative approach to identify Market Structure. The logic used is derived from learning material created by   DaveTeaches (on X) Upgrade v1.10: + add option to put protected high/low value to buffer (figure 11, 12) + add  Retracements  value to buffer when Show Retracements When quantifying Market Structure, it is common to use fractal highs and lows to identify "significant" swing pivots. When price closes through these pivots, we may identify a Market Structure S
Universal Soul Reaper
Pieter Gerhardus Van Zyl
Universal Soul Reaper is an atmospheric market-flow oscillator designed to interpret price behavior as a cycle of spiritual energy. Instead of reacting to raw price alone, it visualizes the state of the market’s soul —revealing when momentum is awakening, stabilizing, or fading. The indicator operates in a separate window and presents three interwoven entities: the Ectoplasmic Veil , the Spirit Boundary , and the Soul Core . Together, they form a living framework that helps traders sense pressu
Syntetic Mean Reversion
Danny Giovanni Romero Lozano
Synthetic Mean Reversion The Synthetic Mean Reversion is a technical indicator designed to analyze price momentum and its distance from dynamic equilibrium. It operates in a separate sub-window, offering a normalized view of market extensions and potential exhaustion zones based on price volatility. The indicator measures the difference between the current price and its mean, transforming market data into a visual scale of 0 to 100. This calculation helps identify periods when the price has de
Noize Absorption Index - is the manual trading system that measures the difference of pressure between bears forces and bulls forces. Green line - is a noize free index that showing curent situation. Zero value of index shows totally choppy/flat market.Values above zero level shows how powerfull bullish wave is and values below zero measures bearish forces.Up arrow appears on bearish market when it's ready to reverse, dn arrow appears on weak bullish market, as a result of reverse expectation.
Mini Chart Indicators
Flavio Javier Jarabeck
The Metatrader 5 has a hidden jewel called Chart Object, mostly unknown to the common users and hidden in a sub-menu within the platform. Called Mini Chart, this object is a miniature instance of a big/normal chart that could be added/attached to any normal chart, this way the Mini Chart will be bound to the main Chart in a very minimalist way saving a precious amount of real state on your screen. If you don't know the Mini Chart, give it a try - see the video and screenshots below. This is a gr
Owl Smart Levels MT5
Sergey Ermolov
4.03 (32)
MT4 version  |   FAQ The Owl Smart Levels Indicator is a complete trading system within the one indicator that includes such popular market analysis tools as Bill Williams' advanced fractals , Valable ZigZag which builds the correct wave structure of the market, and Fibonacci levels which mark the exact levels of entry into the market and places to take profits. Detailed description of the strategy Instructions for working with the indicator Advisor-assistant in trading Owl Helper Private User
First of all Its worth emphasizing here that this Trading Tool is Non Repainting , Non Redrawing and Non Lagging Indicator , Which makes it ideal for professional trading . [Online course] ,   and   [manual] The Smart Price Action Concepts Indicator is a very powerful tool for both new and experienced traders . It packs more than 20 useful indicators into one , combining advanced trading ideas like Inner Circle Trader Analysis and Smart Money Concepts Trading Strategies . This indicator focuses
The "MR Volume Profile Rectangles 5" indicator is a charting tool that displays trading volume at different price levels rather than time intervals. A key concept in volume profile is the point of control (POC) —the price level with the highest volume traded during the session or time range. While tools like VWAP or OBV provide volume trends, the "MR Volume Profile Rectangles 5" indicator offers granular detail about where the most market activity occurs at specific price levels. This makes it a
Schaff Trend Cycle STC
Mohammad Taher Halimi Tabrizi
The Schaff Trend Cycle indicator is the product of combining Slow Stochastics and the moving average convergence/divergence (MACD). The MACD has a reputation as a trend indicator, but it's also notorious for lagging due to its slow responsive signal line. The improved signal line gives the STC its relevance as an early warning sign to detect currency trends. this indicator is converted from Trading View code of STC Indicator - A Better MACD [SHK]
The Accumulation / Distribution is an indicator which was essentially designed to measure underlying supply and demand. It accomplishes this by trying to determine whether traders are actually accumulating (buying) or distributing (selling). This indicator should be more accurate than other default MT5 AD indicator for measuring buy/sell pressure by volume, identifying trend change through divergence and calculating Accumulation/Distribution (A/D) level. Application: - Buy/sell pressure: above
FTU Fibonacci Retrace This indicator draws fib levels for retracement type entry systems An improved and more accurate version than the mt4 Study price movement, and use a retracement type strategy for entry at or near fib levels Features: Multiple Fibo levels adjustable Change color and amount of bars from range Usage : Purpose is to study or measure price retracement Change color and amount of bars from range.  Use on any timeframe,  product/pair, non repaint, fast loading
The Gann Box (or Gann Square) is a market analysis method based on the "Mathematical formula for market predictions" article by W.D. Gann. This indicator can plot three models of Squares: 90, 52(104), 144. There are six variants of grids and two variants of arcs. You can plot multiple squares on one chart simultaneously. Parameters Square — selection of a Gann square model: 90 — square of 90 (or square of nine); 52 (104) — square of 52 (or 104); 144 — universal square of 144; 144 (full) — "ful
"Impulses and Corrections 5" is created to help traders navigate the market situation. The indicator shows multi-time frame upward and downward "Impulses" of price movements. These impulses are the basis for determining the "Base" , which is composed of zones of corrections of price movements, as well as "Potential" zones for possible scenarios of price movement. Up and down impulses are determined based on a modified formula of Bill Williams' "Fractals" indicator. The last impulse is always "U
Crash 1000 Scalping Indicator for the Crash 1000 Deriv Synthetic Index. Introduction The Crash 1000 Scalping Indicator is a specialized tool designed for the Crash 1000 index on the Deriv Synthetic market. This indicator is particularly useful for scalping on the M1 timeframe, helping traders to identify precise entry and exit points for buy positions. It is designed to be non-repainting, providing clear signals with audible alerts and push notifications, and is compatible with mobile devices th
WaveTrend 3D is the mql version of this oscillator (By jdehorty and LazyBear). WaveTrend 3D (WT3D) is a novel implementation of the famous WaveTrend (WT) indicator and has been completely redesigned from the ground up to address some of the inherent shortcomings associated with the traditional WT algorithm. WaveTrend 3D is an alternative implementation of WaveTrend that directly addresses some of the known shortcomings of the indicator, including its unbounded extremes, susceptibility to whips
Visual Keltner Trend Midline Indicator
AL MOOSAWI ABDULLAH JAFFER BAQER
Unlock the Potential of Keltner Channel Trends! The Keltner Trend Midline Indicator is a robust tool designed to assist traders in capturing midline movements and potential reversals within the Keltner Channel framework. This indicator is carefully crafted for you to optimize and tailor it to your trading style, ensuring it aligns with your strategies and goals. Key Features & Strategy Logic Midline Dynamics: The indicator focuses on the midline of the Keltner Channel, which acts as a dynamic s
InfinX Hull Mavg MT5
Stanislav Shtiliyanov
The Hull Moving Average (HMA) attempts to minimize the lag of a traditional moving average while retaining the smoothness of the moving average line. Developed by Alan Hull in 2005, this indicator makes use of weighted moving averages to prioritize more recent values and greatly reduce lag. The resulting average is more responsive and well-suited for identifying entry points. For more information, welcome to our Telegram Group.  https://t.me/InfinXx
Crypto_Forex   Indicator "RVI with Dynamic OverSold/OverBought zones" for MT5 , No Repaint. Relative_Vigor_Index (RVI) itself is a technical momentum indicator which is very useful on trend markets. It   is great for   Sell   entries from   dynamic OverBought zone and   Buy   entries from dynamic OverSold zone. Indicator   can be used on any time-frame, but it   is   especially good  on  big time frames: D1, H4, H1, M30. D ynamic   OverBought zone - above red line. Dynamic   OverSold zone - bel
Renko + ATR Trend Envelope PRO+ (Non-Repainting) Renko + ATR Trend Envelope PRO+ is a clean trend-filter indicator that combines a Renko-style step histogram with an ATR-based trend envelope. It highlights trend direction, volatility expansion/contraction and trend reversals with arrows and optional alerts. This tool is ideal for: Trend following strategies Breakout confirmation Filtering false entries during choppy markets Visualizing volatility using ATR envelopes Key Features Renko-Style Hi
Terra Infinity is a flat indicator. This improved version of the CalcFlat indicator has three additional lines that significantly increase its effectiveness. Unlike its predecessor with two static levels, Terra Infinity adds three dynamic lines above the main histogram, which are interpreted as follows: base signal line, minimum signal line, maximum signal line. These lines are formed using the additional parameter Avg, which is the average value of the histogram. Averaging produces a line cl
Build Your Own High-Frequency Trading EA with Quantum Flash with prop firm inputs included. Note this will build a number of combinations. You will need to develop further if you want it different. This is good for traders who want to get into development and need a starting point.   There are an astronomical number of total combinations the generator will create this combined with optimization including all inputs.  Read here for detail:  https://www.mql5.com/en/blogs/post/759287 We’ve all hear
**   All Symbols   x   All Timeframes   scan just by pressing scanner button ** Discount: The price is $50$, But now it is just $39, Limited time offer is active. *** Contact me  to send you instruction and add you in "Trend Reversal group" for sharing or seeing experiences with other users. Introduction: Trendlines are the most famous technical analysis in trading . Trendlines continually form on the charts of markets across all the different timeframes providing huge opportunities for traders
Buyers of this product also purchase
SuperScalp Pro
Van Minh Nguyen
5 (11)
SuperScalp Pro – Advanced Multi-Filter Scalping Indicator System SuperScalp Pro is an advanced scalping indicator system that combines the classic Supertrend with multiple intelligent confirmation filters. The indicator performs efficiently across all timeframes from M1 to H4 and is especially suitable for XAUUSD, BTCUSD and major Forex pairs. It can be used as a standalone system or flexibly integrated into existing trading strategies. The indicator integrates more than 11 filters, including fa
Divergence Bomber
Ihor Otkydach
4.89 (83)
Each buyer of this indicator also receives the following for free: The custom utility "Bomber Utility", which automatically manages every trade, sets Stop Loss and Take Profit levels, and closes trades according to the rules of this strategy Set files for configuring the indicator for various assets Set files for configuring Bomber Utility in the following modes: "Minimum Risk", "Balanced Risk", and "Wait-and-See Strategy" A step-by-step video manual to help you quickly install, configure, and s
Azimuth Pro
Ottaviano De Cicco
5 (6)
LAUNCH PROMO Azimuth Pro price is initially set at 299$ for the first 100 buyers. Final price will be 499$ . THE DIFFERENCE BETWEEN RETAIL AND INSTITUTIONAL ENTRIES ISN'T THE INDICATOR — IT'S THE LOCATION. Most traders enter at arbitrary price levels, chasing momentum or reacting to lagging signals. Institutions wait for price to reach structured levels where supply and demand actually shift. Azimuth Pro maps these levels automatically: swing-anchored VWAP, multi-timeframe structure lines, an
ARICoins
Temirlan Kdyrkhan
ARICoin is a powerful trading companion designed to generate high-probability entry signals with dynamic TP/SL/DP levels based on volatility. Built-in performance tracking shows win/loss stats, PP1/PP2 hits, and success rates all updated live. Key Features: Buy/Sell signals with adaptive volatility bands Real-time TP/SL/DP levels based on ATR Built-in MA Filter with optional ATR/StdDev volatility Performance stats panel (Success, Profit/Loss, PP1/PP2) Alerts via popup, sound, push, or email Cust
Entry In The Zone and SMC Multi Timeframe is a real-time market analysis tool developed based on Smart Money Concepts (SMC). It is designed to analyze market structure, price direction, reversal points, and key zones across multiple timeframes in a systematic way. The system displays Points of Interest (POI) and real-time No Repaint signals, with instant alerts when price reaches key zones or when signals occur within those zones. It functions as both an Indicator and a Signal System (2-in-1), c
New Update of   Smart Trend Trading System MT5 For  2026 Market: If You Buy this Indicator you will Get my Professional Trade Manager + EA  for FREE . First of all Its worth emphasizing here that this Trading System is Non-Repainting   , Non Redrawing and Non Lagging Indicator Which makes it ideal from both manual and robot trading .  [Online course] , [manual] and [download presets] . The Smart Trend Trading System MT5 is a comprehensive trading solution tailored for new and experienced traders
FX Trend MT5 NG
Daniel Stein
5 (4)
FX Trend NG: The Next Generation Multi-Market Trend Intelligence Overview FX Trend NG is a professional multi-timeframe trend and market monitoring tool designed to give you a complete structural overview of the market in seconds. Instead of switching between dozens of charts, you instantly see which symbols are trending, where momentum is fading, and where strong alignment exists across timeframes. Launch Offer – Get FX Trend NG for $30 (6 Months) or $80 Lifetime . Already part of the Stein I
Power Candles MT5
Daniel Stein
5 (6)
Power Candles – Strength-Based Entry Signals for Any Market Power Candles brings Stein Investments’ proven strength analysis directly onto your price chart. Instead of reacting to price alone, each candle is colored based on real market strength, allowing you to instantly identify momentum build-ups, strength acceleration, and clean trend transitions. One Logic for All Markets Power Candles works automatically on all trading symbols . The indicator detects whether the current symbol is a Forex p
[ My Products ] , [ My Channel ]  , [ LIVE SIGNAL ] HFT Spike Detector HFT Spike Detector is a professional tick monitoring tool designed to analyze and measure high-frequency price movements (sudden spikes caused by HFT) in real time. Its purpose is to enable you to detect abnormal slippage, liquidity gaps, and millisecond-level price spikes caused by the broker using numerical data. Because it analyzes real-time tick flow and execution conditions, it cannot be accurately evaluated in backt
Trend Screener Pro MT5
STE S.S.COMPANY
4.81 (103)
Trend Screener Indicator --Professional Trend Trading & Market Scanning System for MetaTrader Unlock the true power of trend trading with Trend Screener Indicator — a complete multi-currency, multi-timeframe trend analysis solution powered by Fuzzy Logic,Trend Pulse Technology  and advanced market structure algorithms.   Trend Screener transforms your MetaTrader platform into a professional-grade Trend Analyzer and Market Scanner, helping you identify high-probability trend opportunities, early
AriX
Temirlan Kdyrkhan
1 (4)
AriX Indicator for MT5 A powerful trend-following and signal-evaluation tool AriX is a custom MT5 indicator that combines Moving Averages and ATR-based risk/reward logic to generate clear buy/sell signals. It visualizes dynamic SL/TP levels, evaluates past trade outcomes, and displays win/loss statistics in a clean on-chart panel. Key features include: Buy/Sell signals based on MA crossovers ATR-based SL/TP1/TP2/TP3 levels with visual lines and labels Signal outcome tracking with real-time stat
RFI levels PRO MT5
Roman Podpora
3.67 (3)
The indicator accurately shows the reversal points and price return zones where the   Major players . You see where new trends are forming and make decisions with maximum precision, maintaining control over every trade. VERSION MT4     -    Reveals its maximum potential when combined with the   TREND LINES PRO   indicator What the indicator shows: Reversal structures and reversal levels with activation at the beginning of a new trend. Display of   TAKE PROFIT   and   STOP LOSS   levels with min
OmniSync Projection
Antonio-alin Teculescu
5 (1)
Chronos Fractal Engine is an innovative price projection indicator for MetaTrader 5, designed to transform your technical analysis by intelligently identifying and projecting historical price patterns. Built upon an advanced correlation algorithm and the fractal principles of the market, this powerful tool visualizes potential future price movements, giving you a unique edge in your trading decisions. What is Chronos Fractal Engine? At its core, the Chronos Fractal Engine employs a sophisticat
Grabber System MT5
Ihor Otkydach
4.83 (23)
Let me introduce you to an excellent technical indicator – Grabber, which works as a ready-to-use "All-Inclusive" trading strategy. Within a single code, it integrates powerful tools for technical market analysis, trading signals (arrows), alert functions, and push notifications. Every buyer of this indicator also receives the following for free: Grabber Utility for automatic management of open orders Step-by-step video guide: how to install, configure, and trade with the indicator Custom set fi
Atomic Analyst MT5
Issam Kassas
4.03 (30)
New Update of   Atomic Analyst MT5 For  2026 Market: If You Buy this Indicator you will Get my Professional   Trade Manager + EA  for   FREE . First of all Its worth emphasizing here that this Trading Indicator is   Non-Repainting   , Non Redrawing and Non Lagging Indicator   Indicator, Which makes it ideal from both manual and robot trading.  User manual: settings, inputs and strategy . The Atomic Analyst  is a PA Price Action Indicator that uses Strength and Momentum of the price to find a bet
FX Power MT5 NG
Daniel Stein
5 (31)
FX Power: Analyze Currency Strength for Smarter Trading Decisions Overview FX Power is your go-to tool for understanding the real strength of currencies and Gold in any market condition. By identifying strong currencies to buy and weak ones to sell, FX Power simplifies trading decisions and uncovers high-probability opportunities. Whether you’re looking to follow trends or anticipate reversals using extreme delta values, this tool adapts seamlessly to your trading style. Don’t just trade—trade
Pips Stalker mt5
Abdulkarim Karazon
5 (1)
The Pips Stalker is a long short arrow type indicator, the indicator helps traders of all levels to take better decisions trading the market,the indicator never repaints and uses RSI as main signal logic, once an arrow is given it will never repaint or back paint and arrows are not delayed. MT4 VERSION <---- FEATURES OF THE PIPS STALKER ARROW : STATS PANEL a unique info dashboard that shows overall win rate % and useful stats such as max win and lost trades in a row, as well as other usefull inf
Smart Stop Indicator – Intelligent Stop-Loss Precision Directly on Your Chart Overview The Smart Stop Indicator is the tailored solution for traders who want to place their stop loss clearly and methodically instead of guessing or relying on gut feeling. This tool combines classic price-action logic (higher highs, lower lows) with modern breakout recognition to identify where the next logical stop level truly is. Whether in trending markets, ranges, or fast breakout phases, the indicator displ
Trend indicator AI mt5
Ramil Minniakhmetov
5 (15)
Trend Ai indicator  mt5 is great tool that will enhance a trader’s market analysis by combining trend identification with actionable entry points and reversal alerts.  This indicator empowers users to navigate the complexities of the forex market with confidence and precision Beyond the primary signals, Trend Ai indicator identifies secondary entry points that arise during pullbacks or retracements, enabling traders to capitalize on price corrections within the established trend. Important Advan
Trend Lines PRO MT5
Roman Podpora
5 (1)
TREND LINES PRO  -   helps understand where the market is truly changing direction. The indicator shows real trend reversals and points where major players re-enter. You see   BOS lines   Trend changes and key levels on higher timeframes — without complex settings or unnecessary noise. Signals don't repaint and remain on the chart after the bar closes. MT4 VERSION   - Reveals its maximum potential when combined with the   RFI LEVELS PRO   indicator What the indicator shows: Real shifts   trend
ARIPoint
Temirlan Kdyrkhan
ARIPoint is a powerful trading companion designed to generate high-probability entry signals with dynamic TP/SL/DP levels based on volatility. Built-in performance tracking shows win/loss stats, PP1/PP2 hits, and success rates all updated live. Key Features: Buy/Sell signals with adaptive volatility bands Real-time TP/SL/DP levels based on ATR Built-in MA Filter with optional ATR/StdDev volatility Performance stats panel (Success, Profit/Loss, PP1/PP2) Alerts via popup, sound, push, or email Cu
Quantum TrendPulse
Bogdan Ion Puscasu
5 (22)
Introducing Quantum TrendPulse , the ultimate trading tool that combines the power of SuperTrend , RSI , and Stochastic into one comprehensive indicator to maximize your trading potential. Designed for traders who seek precision and efficiency, this indicator helps you identify market trends, momentum shifts, and optimal entry and exit points with confidence. Key Features: SuperTrend Integration: Easily follow the prevailing market trend and ride the wave of profitability. RSI Precision: Detect
FX Dynamic MT5
Daniel Stein
5 (5)
FX Dynamic: Track Volatility and Trends with Customized ATR Analysis Overview FX Dynamic is a powerful tool that leverages Average True Range (ATR) calculations to give traders unparalleled insights into daily and intraday volatility. By setting up clear volatility thresholds—such as 80%, 100%, and 130%—you can quickly identify potential profit opportunities or warnings when markets exceed typical ranges. FX Dynamic adapts to your broker’s time zone, helps you maintain a consistent measure of
FX Levels MT5
Daniel Stein
5 (13)
FX Levels: Exceptionally Accurate Support & Resistance for All Markets Quick Overview Looking for a reliable way to pinpoint support and resistance levels across any market—currencies, indices, stocks, or commodities? FX Levels merges our traditional “Lighthouse” method with a forward-thinking dynamic approach, offering near-universal accuracy. By drawing from real-world broker experience and automated daily plus real-time updates, FX Levels helps you identify reversal points, set profit targe
Market Structure Order Block Dashboard MT5 is an MT5 indicator focused on Market Structure and ICT / Smart Money Concepts: HH/HL/LH/LL , BOS , ChoCH , plus Order Blocks , Fair Value Gaps (FVG) , Liquidity (EQH/EQL, sweeps), Sessions / Kill Zones , and an integrated Volume Profile with a compact confluence dashboard. Important: This is an analysis tool . It does not execute trades (not an EA). Buyer Bonus After purchase, you can receive 2 bonus indicators (your choice) from my store. How to clai
Candle Smart Range
Gianny Alexander Lugo Sanchez
5 (1)
Candle Smart Range (CRT) for MetaTrader 5 Candle Smart Range is a technical indicator designed for the automatic identification of price ranges across multiple timeframes. This tool analyzes market structure based on candle formations and the interaction of price with previous highs and lows. Main Features: Range Detection: Automatically identifies consolidation zones before impulsive movements. False Breakout Identification: Marks instances where the price exceeds a previous level but closes wi
Crystal Heikin Ashi Signals
Muhammad Jawad Shabir
5 (1)
Crystal Heikin Ashi Signals - Professional Trend & Signal Detection Indicator Advanced Heikin Ashi Visualization with Intelligent Signal System for Manual & Automated Trading Final Price: $149 ---------> Price goes up $10 after every 10 sales . Limited slots available — act fast . Overview Crystal Heikin Ashi Signals is a professional-grade MetaTrader 5 indicator that combines pure Heikin Ashi candle visualization with an advanced momentum-shift detection system. Designed for both manual traders
This indicator is an indicator for automatic wave analysis that is perfect for practical trading! Case... Note:   I am not used to the Western name for wave classification. Influenced by the naming habit of Chaos Theory (Chanzhongshuochan), I named the basic wave as   pen   , the secondary wave band as   segment   , and the segment with trend direction   as main trend segment   (this naming method will be used in future notes, let me tell you in advance), but the algorithm is not closely relat
Btmm state engine pro
Garry James Goodchild
5 (2)
Get the user guide here  https://g-labs.software/guides/BTMM_State_Engine_Welcome_Pack.html BTMM State Engine Pro — the   all-in-one Banks   & Institutions Market Maker indicator for Meta Trader 5. Built for   BTMM traders who follow the Asian   session breakout methodology with Kill Zone timing , level stacking, peak formation detection , and multi-pair scanning — all   from a single chart. Combines   a full BTMM State Engine   with a built-in multi-pair Scanner dashboard, eliminating the need
Introduction to X3 Chart Pattern Scanner X3 Cherart Pattern Scanner is the non-repainting and non-lagging indicator detecting X3 chart patterns including Harmonic pattern, Elliott Wave pattern, X3 patterns, and Japanese Candlestick patterns. Historical patterns match with signal patterns. Hence, you can readily develop the solid trading strategy in your chart. More importantly, this superb pattern scanner can detect the optimal pattern of its kind. In addition, you can switch on and off individu
More from author
VSA Volume Spread Analysis
Vladimir Gotsulenko
4.1 (10)
The indicator produces signals according to the methodology VSA (Volume Spread Analysis) - the analysis of trade volume together with the size and form of candlesticks. The signals are displayed at closing of bars on the main chart in the form of arrows. The arrows are not redrawn. Input Parameters DisplayAlert - enable alerts, true on default; Pointer - arrow type (three types), 2 on default; Factor_distance - distance rate for arrows, 0.7 on default. Recommended timeframe - М15. Currency pair
The indicator displays divergence for any custom indicator. You only need to specify the indicator name; DeMarker is used by default. Additionally, you can opt for smoothing of values of the selected indicator and set levels whose crossing will trigger an alert. The custom indicator must be compiled (a file with ex5 extension) and located under MQL5/Indicators of the client terminal or in one of the subdirectories. It uses zero bar of the selected indicator with default parameters. Input parame
FREE
Best Wave
Vladimir Gotsulenko
3.5 (4)
The indicator of trend (flat) with a price channel. Trading Buy - the price have crossed the central line upwards (the candlestick has closed above the line) and the channel is oriented horizontally (yellow line) or directed upwards(green line). Move to breakeven when reaching the opposite border of the channel. Close positions when conditions for selling are formed. Sell - the price have crossed the central line downwards (the candlestick has closed below the line) and the channel is oriented
FREE
Trend check USDCHF
Vladimir Gotsulenko
2 (2)
This indicator gives full information about the market state: strength and direction of a trend, volatility and price movement channel. It has two graphical components: Histogram: the size and the color of a bar show the strength and direction of a trend. Positive values show an ascending trend and negative values - a descending trend. Green bar is for up motion, red one - for down motion, and the yellow one means no trend. Signal line is the value of the histogram (you can enable divergence sea
FREE
Angle Regression Line MT4
Vladimir Gotsulenko
4.67 (3)
The indicator allows determining the strength and direction of the trend precisely. The histogram displayed in a separate window shows changes of the slope of the regression line. A signal for entering a deal is crossing the zero line and/or a divergence. The indicator is also useful for wave analysis. Input Parameters: Period - period of calculation, 10 on default; Angle threshold - slope at which a flat is displayed, 6.0 on default (within the range from -6.0 to 6.0); Filter by volume - volume
The indicator produces signals according to the methodology VSA (Volume Spread Analysis) - the analysis of trade volume together with the size and form of candlesticks. The signals are displayed at closing of bars on the main chart in the form of arrows. The arrows are not redrawn. Input Parameters: DisplayAlert - enable alerts, true on default; Pointer - arrow type (three types), 2 on default; Factor_distance - distance rate for arrows, 0.7 on default. Recommended timeframe - М15. Currency pair
Trend check
Vladimir Gotsulenko
This indicator gives full information about the market state: strength and direction of a trend, volatility and price movement channel. It has two graphical components: Histogram: the size and the color of a bar show the strength and direction of a trend. Positive values show an ascending trend and negative values - a descending trend. Green bar is for up motion, red one - for down motion, and the yellow one means no trend. Signal line is the value of the histogram (you can enable divergence sea
Power MT5
Vladimir Gotsulenko
The indicator is based on readings of two oscillators: Bulls Power and Bears Power. It clearly shows the balance of buyers and sellers power. A signal for entering a deal is crossing the zero line and/or a divergence. When the volume filter is enabled, yellow histogram bar shows low trading volume (below average for 50 previous bars). Input Parameters: Period - calculation period, 13 on default; CalculatedBar - number of bars for displaying a divergence, 300 on default; Filter by volume - volume
Angle DeMarker MT5
Vladimir Gotsulenko
The indicator shows the angle of the DeMarker indicator line, which allows you to identify possible price extrema more accurately. Histogram bar color and size indicate the direction and angle of the DeMarker line. When the trade volume control is enabled, a yellow bar is an indication of the volume being lower than average over the past 50 bars. The color of the main indicator line shows whether the price has reached an overbought/oversold level in accordance with DeMarker indicator values. The
Filter:
Fadzo
206
Fadzo 2021.02.15 08:14 
 

User didn't leave any comment to the rating

Frenk
24
Frenk 2020.10.31 17:44 
 

User didn't leave any comment to the rating

Vladimir Gotsulenko
8376
Reply from developer Vladimir Gotsulenko 2020.11.01 15:42
Unfortunately no...
Valentin Butorin
4144
Valentin Butorin 2020.10.01 12:51 
 

User didn't leave any comment to the rating

Noprofit
313
Noprofit 2020.07.02 21:01 
 

User didn't leave any comment to the rating

[Deleted] 2019.01.14 06:12 
 

User didn't leave any comment to the rating

Reply to review