PZ Wolfe Waves

1

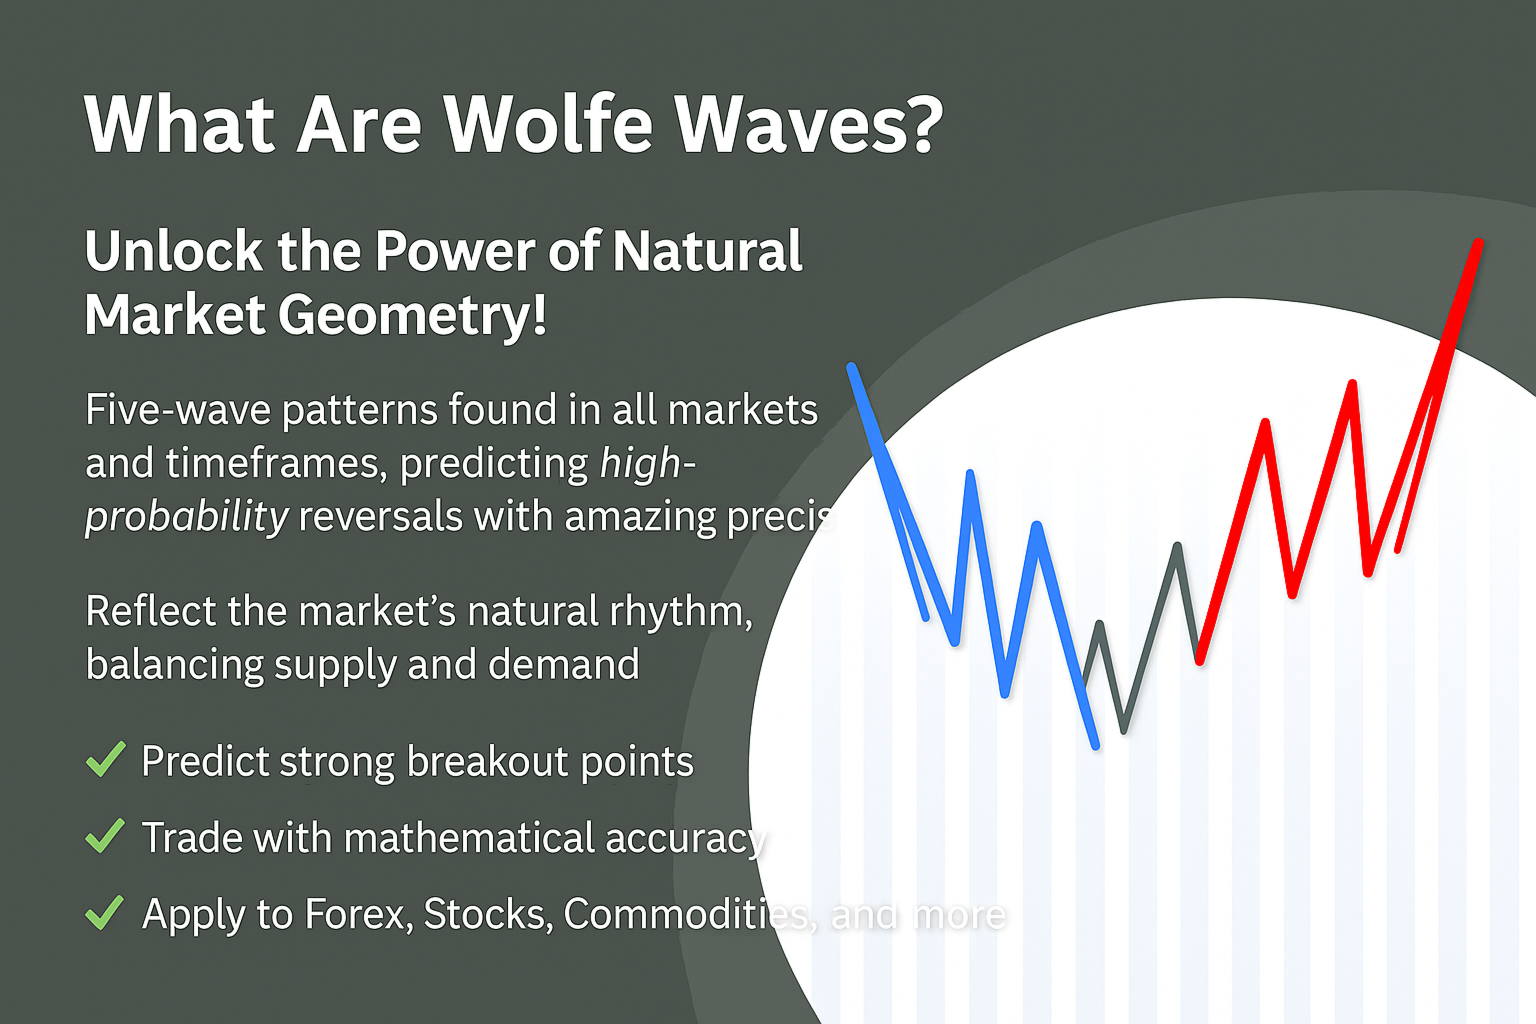
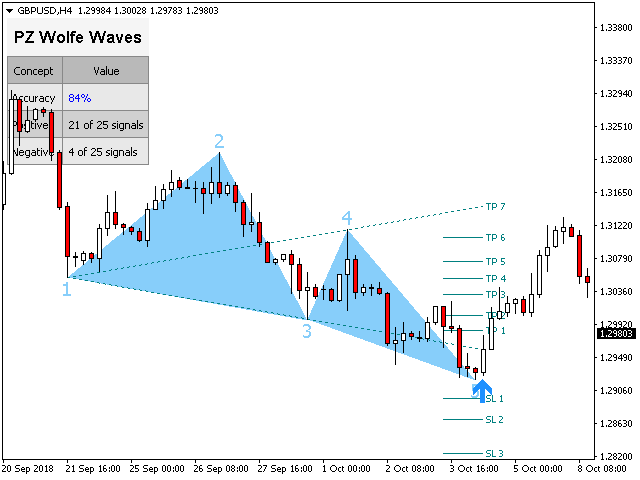
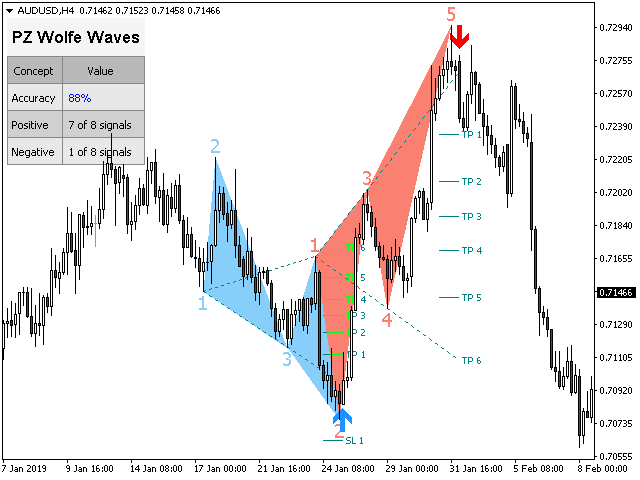
Precision trading: leverage wolfe waves for accurate signals

Wolfe Waves are naturally occurring trading patterns present in all financial markets and represent a fight towards an equilibrium price. These patterns can develop over short and long-term time frames and are one of the most reliable predictive reversal patterns in existence, normally preceding strong and long price movements.

[ Installation Guide | Update Guide | Troubleshooting | FAQ | All Products ]

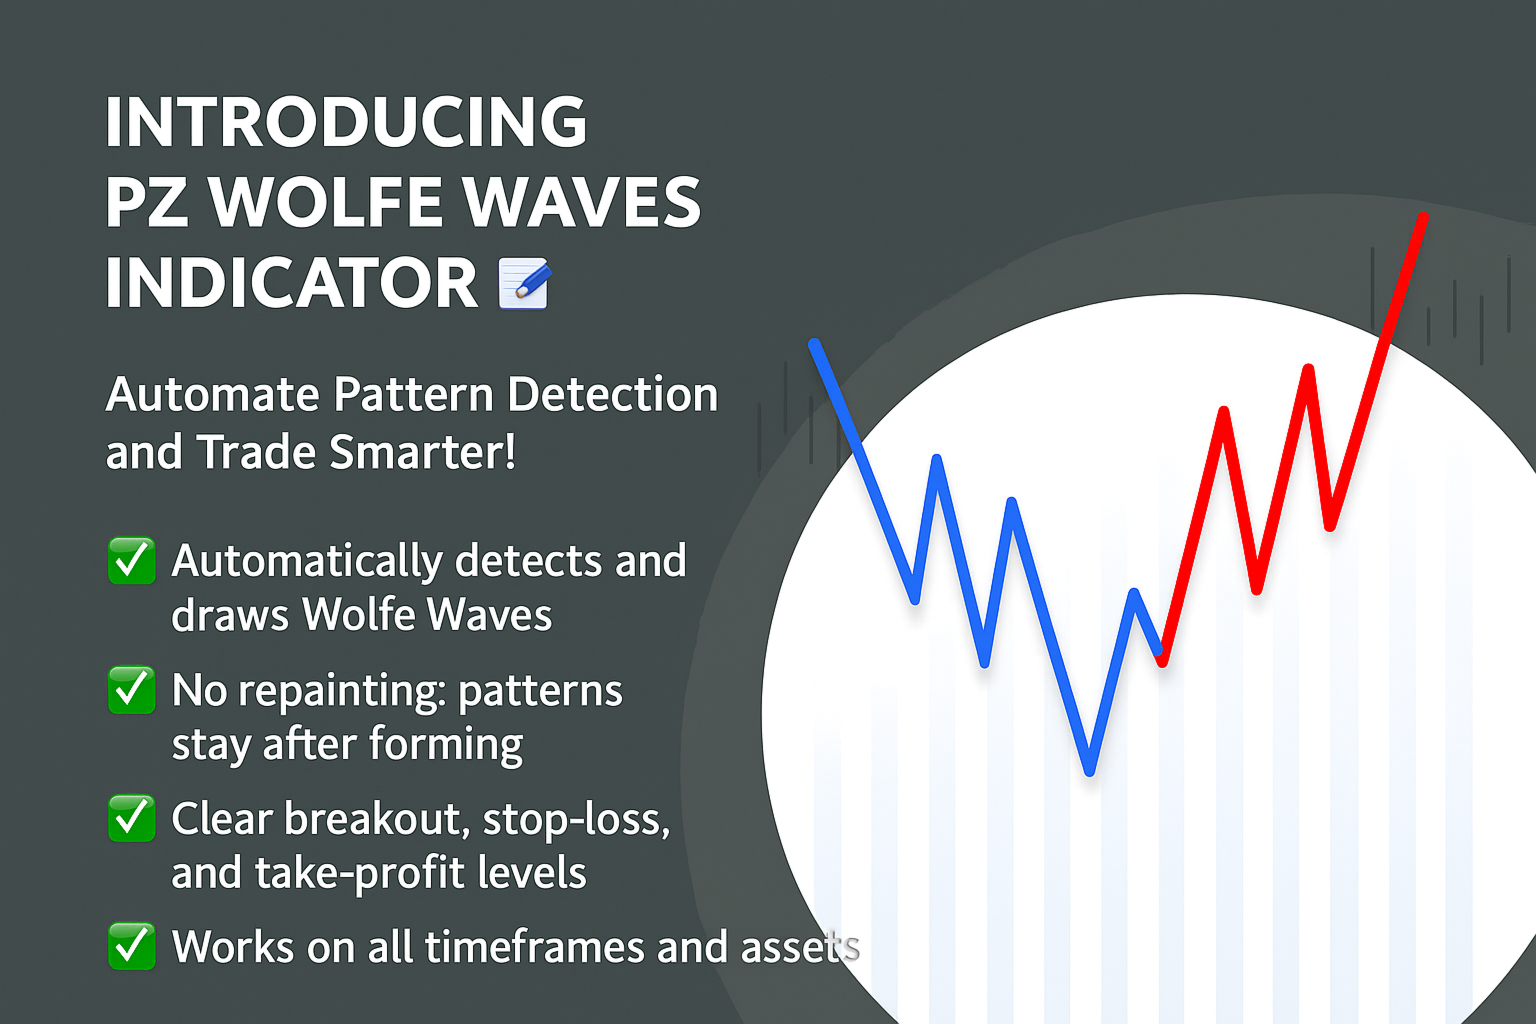
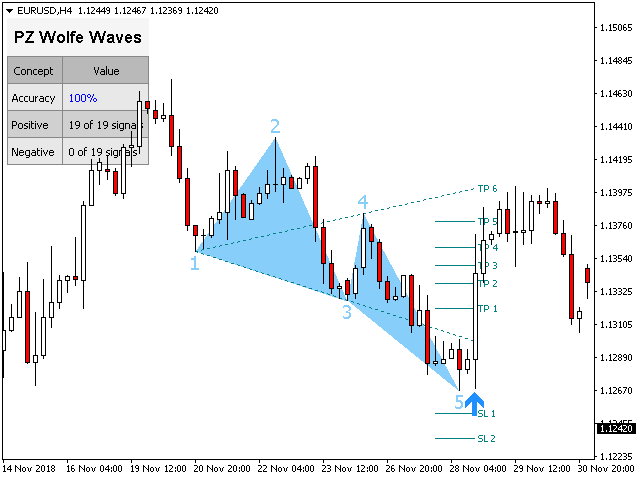
  • Clear trading signals
  • Amazingly easy to trade
  • Customizable colors and sizes
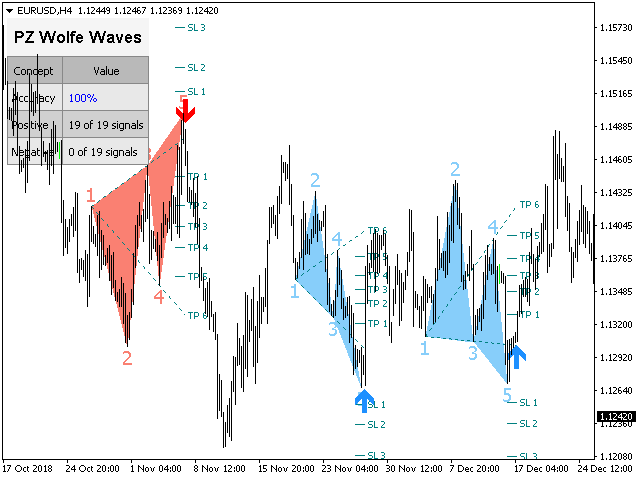
  • Implements performance statistics
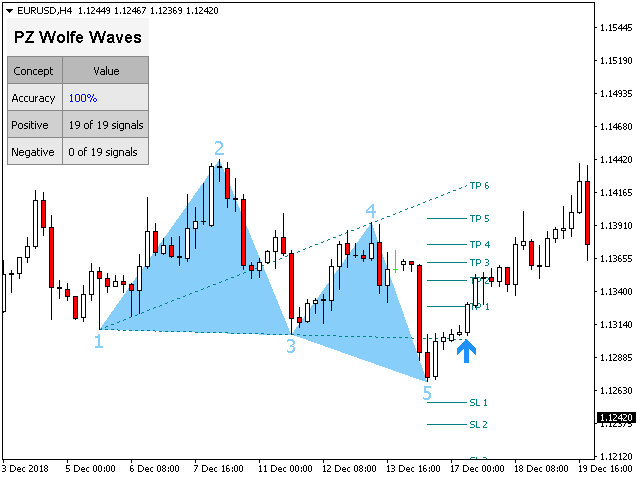
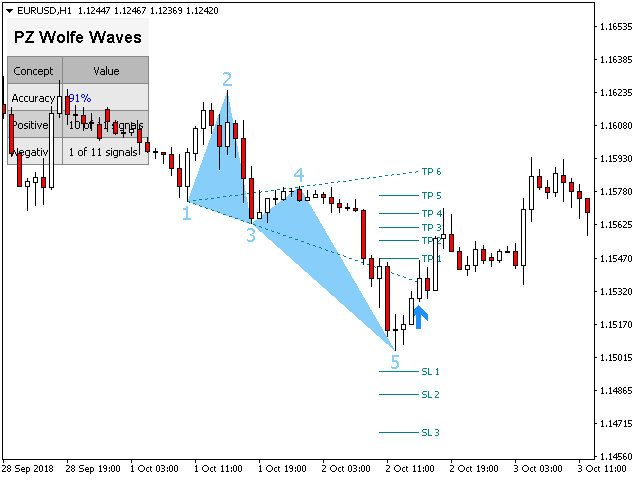
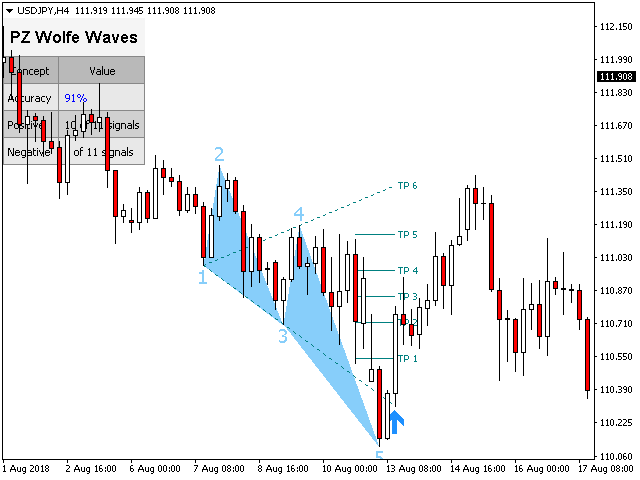
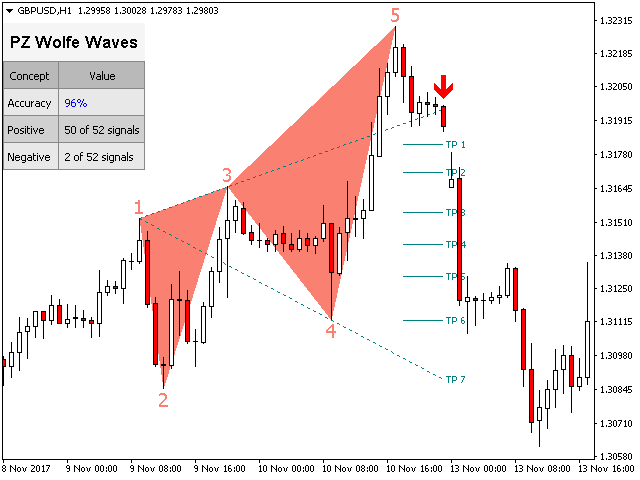
  • Displays suitable stop-loss and take-profit levels
  • It implements email/sound/visual alerts
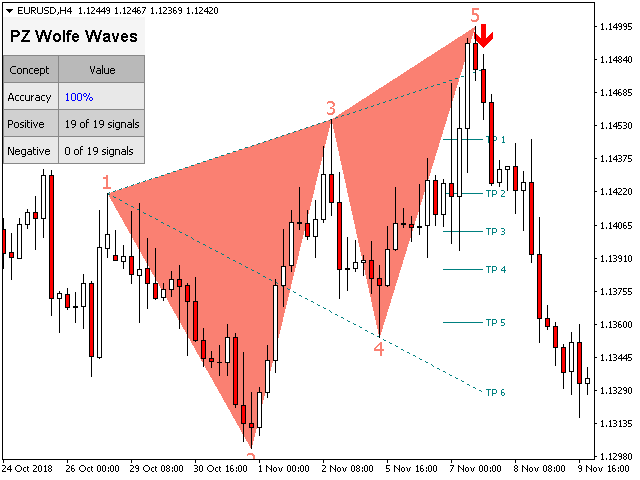
The indicator draws the pattern and the breakout arrow simultaneously to prevent the indicator from repainting the pattern as it expands. However, it might repaint sparingly -not very often-, if the entry breakout happens many times, causing the indicator to re-draw. The indicator is non-backpainting.

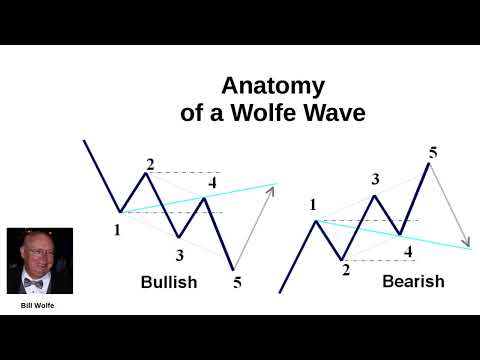
Definition of Wolve Wave

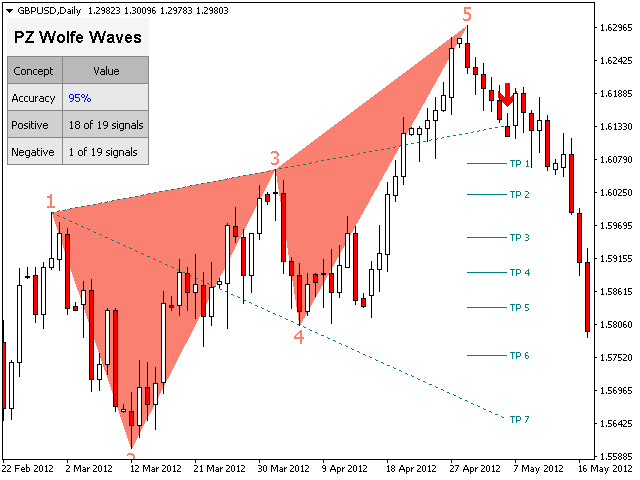
A wolfe wave must have the following characteristics. (Click here to see an example)
  • Waves 3-4 must stay within the channel created by 1-2
  • Wave 4 is within the channel created by waves 1-2
  • Wave 5 exceeds trendline created by waves 1 and 3

Input Parameters

  • Amplitude - The amplitude represents the minimum amount of bars between alternative price points. To find big patterns, increase the amplitude parameter. To find smaller patterns, decrease the amplitude parameter. You can load the indicator many times in the chart to find overlapping patterns of different sizes.
  • Breakout Period - Donchian breakout period to confirm wolfe waves breakouts. Zero means not used.
  • Max History Bars - Amount of past bars to evaluate when the indicator loads in the chart.
  • Display Stats - Show or hide the statistics dashboard and performance data.
  • Display SL/TP Levels - Show or hide suitable SL and TP levels for each signal.
  • Display Price Labels - Show or hide the pattern price labels.
  • Drawing Options - Colors and sizes for bullish or bearish lines and labels, as well as font sizes.
  • Breakouts - Colors and sizes for breakout arrows.
  • Alerts - Enable or disable alerts at will.

    Author

    Arturo López Pérez, private investor and speculator, software engineer and founder of Point Zero Trading Solutions.

    Recommended products
    Overview Harmonic Patterns MT4 is a technical analysis indicator designed for the MetaTrader 5 platform. It identifies and displays harmonic price patterns, such as Butterfly, Cypher, Crab, Bat, Shark, and Gartley, in both bullish and bearish directions. The indicator calculates key price levels, including entry, stop loss, and three take-profit levels, to assist traders in analyzing market movements. Visual elements and customizable alerts enhance usability on the chart. Features Detects six ha
    PZ Harmonacci Patterns
    PZ TRADING SLU
    3.17 (6)
    Trade smarter, not harder: Empower your trading with Harmonacci Patterns This is arguably the most complete harmonic price formation auto-recognition indicator you can find for the MetaTrader Platform. It detects 19 different patterns, takes fibonacci projections as seriously as you do, displays the Potential Reversal Zone (PRZ) and finds suitable stop-loss and take-profit levels. [ Installation Guide | Update Guide | Troubleshooting | FAQ | All Products ] It detects 19 different harmonic pric
    Monster Harmonic Indicator
    Paul Geirnaerdt
    4.59 (29)
    Monster Harmonics Indicator is a harmonic pattern indicator. It recognizes Gartley, Bat, Crab, Butterfly, Cypher, White Swan, Black Swan, Shark and several other patterns. Projected patterns that are not yet completed are recognized, too. Monster even shows the PRZ (Potential Reversal Zone). Users can add their own user defined patterns to Monster. Besides the current pattern, Monster also shows all patterns in the symbols history. Monster will provide alerts for developing patterns. Introduced
    Reversal Pattern Pro
    Boonyapagorn Rodvattanajinda
    Reversal Patterns Pro Reversal Patterns Pro is a Price Action (PA) analytical tool that scans the reversal patterns.  - Finds and marks the most dependable Japanese candlestick patterns in real-time. - Supports all time frames (Best for Scalping) - Doesn't repaint making it an exceptional indicator for Expert Advisors. Input parameters : - Support & Resistance Mode ( true or false ) for enabling advanced filtering - Donchian Period - RSI Period - RSI Oversold Level - RSI Overbought Level - Al
    All Symbols   AND  All Time frames Scan                                                                                                                 Document Introduction   The ABCD is a basic harmonic pattern. The ABCD pattern is a visual, geometric chart pattern comprised of three consecutive price swings. It looks like a diagonal lightning bolt and can indicate an upcoming trading opportu
    Price vs Vwap
    Pieter Gerhardus Van Zyl
    Check out my German Pro Signal - https://www.mql5.com/en/signals/2354346 Price vs VWAP is a clean, non-repainting indicator that compares raw market price directly against a rolling Volume Weighted Average Price (VWAP) over a configurable time window. It plots two lines in a separate window: the real closing price and a dynamically calculated VWAP based on recent volume and price interaction. By adapting the VWAP lookback to the chart timeframe, it delivers a clear view of value versus executio
    Trade with Gann on your side!! MASTER CIRCLE 360 CIRCLE CHART, originally created by Gann admitted that this is “The Mother of all charts”. It is one of the last studies that this great trader left for us. The numeric tab le is apparently quite simple like all the tables and is based on square numbers, the SQUARE OF 12 and is by evolution, one of the most important square numbers. Here we can find CYCLE, PRICE AND TIME thanks to angles and grades, to show past and future support and resistance.
    "Impulses and Corrections 4" is created to help traders navigate the market situation. The indicator shows multi-time frame upward and downward "Impulses" of price movements. These impulses are the basis for determining the "Base" , which is composed of zones of corrections of price movements, as well as "Potential" zones for possible scenarios of price movement. Up and down impulses are determined based on a modified formula of Bill Williams' "Fractals" indicator. The last impulse is always "U
    The WaveTrend Oscillator MT4 is a powerful trading indicator designed to enhance your market analysis by identifying momentum shifts and potential trend reversals. Ideal for traders of all levels, this tool offers valuable insights into overbought and oversold conditions across various markets, including forex, cryptocurrencies, and commodities. With its ability to generate accurate buy and sell signals, the WaveTrend Oscillator MT4 empowers traders to make informed decisions, effectively increa
    Alpha Trend sign has been a very popular trading tool in our company for a long time. It can verify our trading system and clearly indicate trading signals, and the signals will not drift. Main functions: Based on the market display of active areas, indicators can be used to intuitively determine whether the current market trend belongs to a trend market or a volatile market. And enter the market according to the indicator arrows, with green arrows indicating buy and red arrows indicating se
    Daily Candle Predictor is an indicator that predicts the closing price of a candle. The indicator is primarily intended for use on D1 charts. This indicator is suitable for both traditional forex trading and binary options trading. The indicator can be used as a standalone trading system, or it can act as an addition to your existing trading system. This indicator analyzes the current candle, calculating certain strength factors inside the body of the candle itself, as well as the parameters of
    Blahtech Market Profile
    Blahtech Limited
    4.53 (15)
    Was: $249  Now: $99   Market Profile defines a number of day types that can help the trader to determine market behaviour. A key feature is the Value Area, representing the range of price action where 70% of trading took place. Understanding the Value Area can give traders valuable insight into market direction and establish the higher odds trade. It is an excellent addition to any system you may be using. Blahtech Limited presents their Market Profile indicator for the MetaTrader community. Ins
    Description The Market Profile & Volume Profile Indicator is a powerful technical analysis tool designed to visualize market activity and price distribution over specific timeframes. Unlike standard technical indicators that focus solely on price over time, this indicator organizes price data to show where the market spent the most time (TPO) and where the most volume was traded (Volume Profile). It automatically calculates and displays key structural levels such as the Point of Control (POC) ,
    The   Fibonacci Confluence Toolkit   is a technical analysis tool designed to help traders identify potential price reversal zones by combining key market signals and patterns. It highlights areas of interest where significant price action or reactions are anticipated, automatically applies Fibonacci retracement levels to outline potential pullback zones, and detects engulfing candle patterns. Its unique strength lies in its reliance solely on price patterns, eliminating the need for user-define
    Trendiness Index
    Libertas LLC
    5 (3)
    "The trend is your friend" is one of the best known sayings in investing, because capturing large trendy price movements can be extremely profitable. However, trading with the trend is often easier said than done, because many indicators are based on price reversals not trends. These aren't very effective at identifying trendy periods, or predicting whether trends will continue. We developed the Trendiness Index to help address this problem by indicating the strength and direction of price trend
    Crypto_Forex Indicator "Hanging Man pattern" for MT4, No repaint, No delay. - Indicator "Hanging Man pattern" is very powerful indicator for Price Action trading. - Indicator detects bearish Hanging Man patterns on chart: Red arrow signal on chart (see pictures). - With PC, Mobile & Email alerts. - Indicator "Hanging Man pattern" is excellent to combine with Support/Resistance Levels. Click here to see high quality Trading Robots and Indicators! This is original product which is offered only
    Point61 Indicator
    Evgeniy Machok
    5 (1)
    The Point61 indicator is the result of many years of monitoring of price behavior of currency pairs and metals. It is not a secret, that in times of uncertainty, traders are looking for possible levels of support and resistance - the point, where price should stop its movement. There are 2 possible scenarios at these points: 1. Reverse (correction) to the opposite direction; 2. Breakthrough to continue movement. Very often these points are used to set stop orders - TakeProfit or StopLoss
    The Supply and Demand Zones indicator is one of the best tools we have ever made. This great tool automatically draws supply and demand zones, the best places for opening and closing positions. It has many advanced features such as multi timeframe zones support, displaying the width of zones, alert notifications for retouched zones, and much more. Because of market fractality, this indicator can be used for any kind of trading. Whether you are a positional, swing, or intraday trader does not ma
    We present you the indicator "Candle closing counter", which will become your indispensable assistant in the world of trading. That’s why knowing when the candle will close can help: If you like to trade using candle patterns, you will know when the candle will be closed. This indicator will allow you to check if a known pattern has formed and if there is a possibility of trading. The indicator will help you to prepare for market opening and market closure. You can set a timer to create a pre
    Auto Fibo Pro m
    DMITRII GRIDASOV
    "Auto FIBO Pro"   Crypto_Forex  indicator  - is great auxiliary tool in trading! Indicator automatically calculate and place on chart Fibo levels and local trend lines (red color). Fibonacci levels indicate key areas where price can reverse. Most important levels are 23.6%, 38.2%, 50% and 61.8%. You can use it   for reversal scalping  or for zone grid trading. There are plenty of opportunities to  improve your current system using Auto FIBO Pro indicator as well. It has Info Spread Swap Displa
    The CCI Divergence is a reasonably useful indicator in itself, but it is even more effective when used with divergence pattern trading. The CCI Divergence indicator signal is one of the most potent signals among the indicators that exist in the market. Here is new version for Divergence Indicator using CCI method, with more improvements. Divergences indicate a potential investment point because the directional moment does not confirm the price. A bullish divergence occurs when the underlying va
    PZ Support Resistance
    PZ TRADING SLU
    3.33 (3)
    Unlock key market insights with automated support and resistance lines Tired of plotting support and resistance lines? This is a multi-timeframe indicator that detects and plots supports and resistance lines in the chart with the same precision as a human eye would. As price levels are tested over time and its importance increases, the lines become thicker and darker, making price leves easy to glance and evaluate. [ Installation Guide | Update Guide | Troubleshooting | FAQ | All Products ] Boos
    TWO PAIRS SQUARE HEDGE METER INDICATOR Try this brilliant 2 pairs square indicator It draws a square wave of the relation between your two inputs symbols when square wave indicates -1 then it is very great opportunity to SELL pair1 and BUY Pair2 when square wave indicates +1 then it is very great opportunity to BUY pair1 and SELL Pair2 the inputs are : 2 pairs of symbols         then index value : i use 20 for M30 charts ( you can try other values : 40/50 for M15 , : 30 for M30 , : 10 for H1 ,
    Gartley Projection D
    Oleksandr Medviediev
    3.71 (7)
    The indicator identifies the harmonic patterns (XABCD) according to developments of H.M.Gartley ( "Profits in the Stock Market" , 1935г). It projects D-point as a point in the perspective projection (specify ProjectionD_Mode = true in the settings). Does not redraw. When a bar of the working timeframe closes, if the identified pattern point has not moved during Patterns_Fractal_Bars bars, an arrow appears on the chart (in the direction of the expected price movement). From this moment on, the ar
    Apollo SR Master is a Support/Resistance indicator with special features which make trading with Support/Resistance zones easier and more reliable. The indicator calculates Support/Resistance zones in real-time without any time lag by detecting local price tops and bottoms. Then to confirm the newly formed SR area, the indicator shows special signal which signalizes that the SR zone can be taken into consideration and used as an actual SELL or BUY signal. In this case the strength of the SR zone
    Harmonic Patterns Indicator: Enhancing Harmonic Trading Analysis The Harmonic Patterns Indicator is a powerful tool designed to identify harmonic patterns on your trading chart using both manual and automatic detection methods. Main Features and Functions: Manual and Automatic Detection: This indicator empowers you to identify harmonic patterns through both manual and automatic methods. Whether you draw the patterns yourself or let the indicator do it for you, it's a versatile tool to enhance y
    Title : Market Bias Indicator - Oscillator-Based Trading Tool Introduction : Discover the potential of the "Market Bias Indicator," a revolutionary oscillator-based trading tool designed for precise market analysis. If you're in search of a robust alternative to traditional bias indicators, your quest ends here. Market Bias Indicator offers unparalleled accuracy in identifying market sentiment and is your gateway to confident trading decisions. Recommended Trading Pairs : Market Bias Indicator i
    VR Cub
    Vladimir Pastushak
    VR Cub is an indicator for getting high-quality entry points. The indicator was developed to facilitate mathematical calculations and simplify the search for entry points into a position. The trading strategy for which the indicator was written has been proving its effectiveness for many years. The simplicity of the trading strategy is its great advantage, which allows even novice traders to successfully trade with it. VR Cub calculates position opening points and Take Profit and Stop Loss targe
    Risk Management and Limit Monitoring Indicator for Professional Traders and Evaluation Accounts (Prop) This tool only displays precise risk management and limit information on the chart to help you make more focused decisions. The indicator does not open/close/modify trades and does not interfere with Expert Advisors (EAs). Features Monitoring daily and total drawdown Calculates and displays daily and total drawdown based on Balance or Equity (configurable). Shows the remaining percentage to th
    KT Renko Patterns MT4
    KEENBASE SOFTWARE SOLUTIONS
    2.33 (3)
    KT Renko Patterns scans the Renko chart brick by brick to find some famous chart patterns that are frequently used by traders across the various financial markets. Compared to the time-based charts, patterns based trading is easier and more evident on Renko charts due to their uncluttered appearance. KT Renko Patterns features multiple Renko patterns, and many of these patterns are extensively explained in the book titled Profitable Trading with Renko Charts by Prashant Shah. A 100% automated
    Buyers of this product also purchase
    Scalper Inside PRO
    Alexey Minkov
    4.74 (69)
    12% OFF EASTER SALE An exclusive indicator that utilizes an innovative algorithm to swiftly and accurately determine the market trend. The indicator automatically calculates opening, closing, and profit levels, providing detailed trading statistics. With these features, you can choose the most appropriate trading instrument for the current market conditions. Additionally, you can easily integrate your own arrow indicators into Scalper Inside Pro to quickly evaluate their statistics and profitabi
    The " Dynamic Scalper System " indicator is designed for the scalping method of trading within trend waves. Tested on major currency pairs and gold, compatibility with other trading instruments is possible. Provides signals for short-term opening of positions along the trend with additional price movement support. The principle of the indicator. Large arrows determine the trend direction. An algorithm for generating signals for scalping in the form of small arrows operates within trend waves.
    Quantum Breakout Indicator PRO
    Bogdan Ion Puscasu
    4.96 (26)
    Introducing   Quantum Breakout PRO , the groundbreaking MQL5 Indicator that's transforming the way you trade Breakout Zones! Developed by a team of experienced traders with trading experience of over 13 years, Quantum Breakout PRO is designed to propel your trading journey to new heights with its innovative and dynamic breakout zone strategy. Quantum Breakout Indicator will give you signal arrows on breakout zones with 5 profit target zones and stop loss suggestion based on the breakout box. I
    Currency Strength Exotics
    Bernhard Schweigert
    4.88 (33)
    CURRENTLY 20% OFF ! Best Solution for any Newbie or Expert Trader! This Indicator is specialized to show currency strength for any symbols like Exotic Pairs Commodities, Indexes or Futures. Is first of its kind, any symbol can be added to the 9th line to show true currency strength of Gold, Silver, Oil, DAX, US30, MXN, TRY, CNH etc. This is a unique, high quality and affordable trading tool because we have incorporated a number of proprietary features and a new formula. Imagine how your trading
    Route Lines Prices is an indicator designed for finding price directions. Its simple interface contains multiple algorithms for price behavior and future direction calculations. These algorithms include volatility calculations and price smoothing based on the timeframes used. The indicator has a single parameter for changing the " Calculating Price Values " value. The default value of 1 provides a balanced automatic calculation, which can be used without manually configuring the indicator. By m
    Trend Lines PRO
    Roman Podpora
    5 (1)
    TREND LINES PRO    helps understand where the market is truly changing direction. The indicator shows real trend reversals and points where major players re-enter. You see   BOS lines   Trend changes and key levels on higher timeframes — without complex settings or unnecessary noise. Signals don't repaint and remain on the chart after the bar closes. VERSION MT 5     -     Reveals its maximum potential when paired with the   RFI LEVELS PRO  indicator What the indicator shows: Real shifts   tren
    Trading Special – 40% OFF Best Solution for any Newbie or Expert Trader! This dashboard software is working on 28 currency pairs plus one. It is based on 2 of our main indicators (Advanced Currency Strength 28 and Advanced Currency Impulse). It gives a great overview of the entire Forex market plus Gold or 1 indices. It shows Advanced Currency Strength values, currency speed of movement and signals for 28 Forex pairs in all (9) timeframes. Imagine how your trading will improve when you can watch
    Volatility Trend System - a trading system that gives signals for entries. The volatility system gives linear and point signals in the direction of the trend, as well as signals to exit it, without redrawing and delays. The trend indicator monitors the direction of the medium-term trend, shows the direction and its change. The signal indicator is based on changes in volatility and shows market entries. The indicator is equipped with several types of alerts. Can be applied to various trading ins
    Dynamic Forex28 Navigator
    Bernhard Schweigert
    4.43 (7)
    Specials Discount now. The Next Generation Forex Trading Tool. Dynamic Forex28 Navigator is the evolution of our long-time, popular indicators, combining the power of three into one: Advanced Currency Strength28 Indicator (695 reviews) + Advanced Currency IMPULSE with ALERT (520 reviews) + CS28 Combo Signals (recent Bonus) Details about the indicator  https://www.mql5.com/en/blogs/post/758844 What Does The Next-Generation Strength Indicator Offer? Everything you loved about the originals, now
    RFI levels PRO
    Roman Podpora
    5 (1)
    The indicator accurately shows the reversal points and price return zones where the   Major players . You see where new trends are forming and make decisions with maximum precision, maintaining control over every trade. VERSION MT5     -     Reveals its maximum potential when combined with the   TREND LINES PRO   indicator What the indicator shows: Reversal structures and reversal levels with activation at the beginning of a new trend. Display of   TAKE PROFIT   and   STOP LOSS   levels with mi
    GOLD Impulse with Alert
    Bernhard Schweigert
    4.67 (12)
    This indicator is a super combination of our 2 products  Advanced Currency IMPULSE with ALERT  and  Currency Strength Exotics . It works for all time frames and shows graphically impulse of strength or weakness for the 8 main currencies plus one Symbol! This Indicator is specialized to show currency strength acceleration for any symbols like Gold, Exotic Pairs, Commodities, Indexes or Futures. Is first of its kind, any symbol can be added to the 9th line to show  true currency strength accelerat
    Wave Cycle Counter
    Eric Evert Ouweneel
    Wave and Cycle counter to give an immediate indication how far the ongoing trend has progressed. Low numbers: trend has just started, ride the trend. Higher numbers: trend is 'older', watch for reversals This indicator is 100% compatible with the fantastic TopDog trading strategy. (I will NOT give any details about this Top Dog strategy) The trend direction is determined by a SMA value (or any other MA) you can set. Waves and cycles numbers and letters are derived from a SlowStoch setting. Wave
    Binary Volume Edge – Martingale Stats  Indicator for binary options with live pre-signals and full martingale stats Binary Volume Edge – Martingale Stats is a professional tool that combines powerful signal filtering, smart martingale analysis, and a unique early warning system. No magic – just clear rules and verifiable stats. What do you get? 1. Signals you can trust Absolute absence of redrawing – arrows appear only on closed candles and never change again. Preliminary signals on t
    Miraculous Indicator – 100% Non-Repaint Forex and Binary Tool Based on Gann Square of Nine This video introduces the Miraculous Indicator , a highly accurate and powerful trading tool specifically developed for Forex and Binary Options traders. What makes this indicator unique is its foundation on the legendary Gann Square of Nine and Gann's Law of Vibration , making it one of the most precise forecasting tools available in modern trading. The Miraculous Indicator is fully non-repaint, meaning t
    GEM Signal Pro GEM Signal Pro is a trend-following indicator for MetaTrader 4, designed for traders who want clearer signals, more structured trade setups, and more practical risk management directly on the chart. Instead of showing only a simple arrow, GEM Signal Pro helps present the full trade idea in a cleaner and more readable way. When conditions are confirmed, the indicator can display the entry price, stop loss, and take profit targets on the chart, helping traders review the setup more
    Linear Trend Predictor - A trend indicator that combines entry points and direction support lines. It works on the principle of breaking through the High/Low price channel. The indicator algorithm filters market noise, takes into account volatility and market dynamics. Indicator capabilities Using smoothing methods, it shows the market trend and entry points for opening BUY or SELL orders. Suitable for determining short-term and long-term market movements by analyzing charts on any timeframes.
    First of all Its worth emphasizing here that this Trading Tool is Non-Repainting Non-Redrawing and Non-Lagging Indicator Which makes it ideal for professional trading . [Online course] ,   and   [manual] The Smart Price Action Concepts Indicator is a very powerful tool for both new and experienced traders . It packs more than 20 useful indicators into one combining advanced trading ideas like Inner Circle Trader Analysis and Smart Money Concepts Trading Strategies . This indicator focuses on Sm
    Technical indicator that structures charts and identifies cyclical price movements. Can work on any charts. Several types of alerts. There are additional arrows on the chart itself. Without redrawing on history, works on closing a candle. Recommended TF from M5 and higher. Easy to use and configure parameters. When using 2 indicators with different parameters, you can use without other indicators. Has 2 input parameters Cyclicality and Signal duration These 2 parameters work with the processin
    Adaptive Volatility Range [AVR] is a powerful tool for identifying key trend reversal points. AVR accurately reflects the Average True Range (ATR) of volatility, taking into account the Volume-Weighted Average Price (VWAP). The indicator adapts to any market volatility by calculating the average volatility over a specific period, ensuring a stable rate of profitable trades. You receive not just an indicator but a professional automated trading system , AVR-EA . Advantages: Automated Trading Syst
    NAM Order Blocks
    NAM TECH GROUP, CORP.
    3.67 (3)
    MT4 Multi-timeframe Order Blocks detection indicator. Features - Fully customizable on chart control panel, provides complete interaction. - Hide and show control panel wherever you want. - Detect OBs on multiple timeframes. - Select OBs quantity to display. - Different OBs user interface. - Different filters on OBs. - OB proximity alert. - ADR High and Low lines. - Notification service (Screen alerts | Push notifications). Summary Order block is a market behavior that indicates order collection
    The Nihilist 5.0 Indicator includes Forexalien and Nihilist Easy Trend trading strategies and systems. It is composed of an MTF Dashboard where you can analyze the different input possibilities of each strategy at a glance. It has an alert system with different types of configurable filters. You can also configure which TF you want to be notified on your Metatrader 4 platform and Mobile application The indicator has the option to view how could be a TP and SL by using ATR or fixed points, even w
    Ultimate Market Master Trend Master the Market’s Direction with Precision The Ultimate Market Master Trend indicator is an all-in-one market sentiment analyser designed for traders who demand clarity, accuracy, and confidence in every move. It combines smart trend detection, multi-timeframe stochastic momentum, and dynamic visual cues to help you identify high-probability entries and exits with ease.  Key Features  1. Smart Trend System (Main Chart) Uses a 200-period LWMA baseline to determine
    MetaForecast M4
    Vahidreza Heidar Gholami
    5 (2)
    MetaForecast predicts and visualizes the future of any market based on the harmonics in price data. While the market is not always predictable, if there is a pattern in the price, MetaForecast can predict the future as accurately as possible. Compared to other similar products, Metaforecast can generate more accurate results by analyzing market trends. Input Parameters Past size Specifies the number of bars that MetaForecast uses to create a model for generating future predictions. The model is
    TPSpro RFI Levels
    Roman Podpora
    4.86 (28)
    INSTRUCTIONS RUS   /   INSTRUCTIONS   ENG   -   VERSION  MT5 Main functions: Displays active zones of sellers and buyers! The indicator displays all the correct first impulse levels/zones for purchases and sales. When these levels/zones are activated, where the search for entry points begins, the levels change color and are filled with certain colors. Arrows also appear for a more intuitive perception of the situation. LOGIC AI - Display of zones (circles) for searching entry points when activa
    The Super Arrow Indicator provides non-repainting buy and sell signals with exceptional accuracy. Key Features No repainting – confirmed signals remain fixed Clear visual arrows: green for buy, red for sell Real-time alerts via pop-up, sound, and optional email Clean chart view with no unnecessary clutter Works on all markets: Forex, gold, oil, indices, crypto Adjustable Parameters TimeFrame Default: "current time frame" Function: Sets the time frame for indicator calculation Options: Can be set
    BTMM State Engine Pro is a MetaTrader 4 indicator for traders who use the Beat The Market Maker approach: Asian session context, kill zone timing, level progression, peak formation detection, and a multi-pair scanner from a single chart. It combines cycle state logic with a built-in scanner dashboard so you do not need the same tool on many charts at once. What it does Draws the Asian session range; session times can follow broker server offset or be set in inputs. Tracks level progression (L
    Precautions for subscribing to indicator This indicator only supports the computer version of MT4 Does not support MT5, mobile phones, tablets The indicator only shows the day's entry arrow The previous history arrow will not be displayed (Live broadcast is for demonstration) The indicator is a trading aid Is not a EA automatic trading No copy trading function The indicator only indicates the entry position No exit (target profit)  The entry stop loss point is set at 30-50 PIPS Or the front hi
    MTF Supply Demand Zones
    Georgios Kalomoiropoulos
    4.82 (22)
    Next Generation Of Automated Supply And Demand Zones. New and Innovative Algorithm that Works At Any Chart. All Zones Are Being Created Dynamically According To Price Action Of The Market. AMAZING OFFER --> Activations from 5 to 20 for "MTF Supply Demand Zones" and "Automated Trendlines" If you get the MTF Supply Demand Zones you can join the " Trade Like Me " Video Series. It contains 14 Live Sessions where  i am placing trades on Forex, Stocks, Indices and Metals. You will be able to see ho
    Meravith
    Ivan Stefanov
    5 (3)
    Market makers' tool. Meravith will: Analyze all timeframes and display the current trend in force. Highlight liquidity zones (volume equilibrium) where bullish and bearish volumes are equal. Display all liquidity levels across different timeframes directly on your chart. Generate and present text-based market analysis for your reference. Calculate targets, support levels, and stop-loss points based on the current trend. Compute the risk/reward ratio for your trades. Determine position size accor
    Introducing the Delta Volume Profile Indicator - Unleash the Power of Institutional Precision!  Technical Indicator: Are you ready to trade like the pros? The Delta Volume Profile Indicator is no ordinary tool. It’s a high-precision, cutting-edge indicator that puts the power of institutional-grade trading in your hands. This unique indicator analyses delta volume distribution in real-time, revealing the market's hidden buy/sell imbalances that the biggest financial institutions rely on to antic
    More from author
    PZ Trend Trading MT5
    PZ TRADING SLU
    3.8 (5)
    Capture every opportunity: your go-to indicator for profitable trend trading Trend Trading is an indicator designed to profit as much as possible from trends taking place in the market, by timing pullbacks and breakouts. It finds trading opportunities by analyzing what the price is doing during established trends. [ Installation Guide | Update Guide | Troubleshooting | FAQ | All Products ] Trade financial markets with confidence and efficiency Profit from established trends without getting whip
    PZ Support Resistance MT5
    PZ TRADING SLU
    3.71 (7)
    Unlock key market insights with automated support and resistance lines Tired of plotting support and resistance lines? This is a multi-timeframe indicator that detects and plots supports and resistance lines in the chart with the same precision as a human eye would. As price levels are tested over time and its importance increases, the lines become thicker and darker, making price leves easy to glance and evaluate. [ Installation Guide | Update Guide | Troubleshooting | FAQ | All Products ] Boos
    Identify over 30 candlestick patterns with precision This indicator recognizes over 30 Japanese Candlestick Patterns and highlights them beautifully on the chart. It is simply one of those indicators price action traders can't live without.  [ Installation Guide | Update Guide | Troubleshooting | FAQ | All Products ] Boost your technical analysis overnight Detect japanese candlestick patterns easily Trade reliable and universal reversal patterns Hop onto established trends safely using continu
    PZ Day Trading MT5
    PZ TRADING SLU
    2.83 (6)
    Effortless trading: non-repainting indicator for accurate price reversals This indicator detects price reversals in a zig-zag fashion, using only price action analysis and a donchian channel. It has been specifically designed for short-term trading, without repainting or backpainting at all. It is a fantastic tool for shrewd traders aiming to increase the timing of their operations. [ Installation Guide | Update Guide | Troubleshooting | FAQ | All Products ] Amazingly easy to trade It provides
    PZ Swing Trading MT5
    PZ TRADING SLU
    5 (5)
    Protect against whipsaws: revolutionize your swing trading approach Swing Trading is the first indicator designed to detect swings in the direction of the trend and possible reversal swings. It uses the baseline swing trading approach, widely described in trading literature. The indicator studies several price and time vectors to track the aggregate trend direction and detects situations in which the market is oversold or overbought and ready to correct. [ Installation Guide | Update Guide | Tro
    PZ Goldfinch Scalper EA MT5
    PZ TRADING SLU
    3.28 (53)
    This is the latest iteration of my famous scalper, Goldfinch EA, published for the first time almost a decade ago. It scalps the market on sudden volatility expansions that take place in short periods of time: it assumes and tries to capitalize of inertia in price movement after a sudden price acceleration. This new version has been simplified to allow the trader use the optimization feature of the tester easily to find the best trading parameters. [ Installation Guide | Update Guide | Troublesh
    FREE
    PZ Reversal Fractals MT5
    PZ TRADING SLU
    4.51 (35)
    This is the latest iteration of my famous indicator, Reversal Fractals, published for the first time almost a decade ago. It examines the price structure of fractals to determine possible reversal points in the market, providing timing to positional traders that already have a fundamental or technical valuation model. [ Installation Guide | Update Guide | Troubleshooting | FAQ | All Products ] Reversal fractals can start long trends The indicator is non repainting It implements alerts of all ki
    FREE
    Trade smarter, not harder: Empower your trading with Harmonacci Patterns This is arguably the most complete harmonic price formation auto-recognition indicator you can find for the MetaTrader Platform. It detects 19 different patterns, takes fibonacci projections as seriously as you do, displays the Potential Reversal Zone (PRZ) and finds suitable stop-loss and take-profit levels. [ Installation Guide | Update Guide | Troubleshooting | FAQ | All Products ] It detects 19 different harmonic pri
    PZ Trade Pad MT5
    PZ TRADING SLU
    4.41 (22)
    This simple visual expert advisor allows you to trade easily from the chart. It handles risk management for you and can perform several useful tasks with your existing trades, saving time and making risk-management for each individual trade easier.  [ Installation Guide | Update Guide | Troubleshooting | FAQ | All Products ] Trade easily from the chart Trade with precise risk management, hassle free Trade pending order with drag and drop price selection Set SL and TP levels with drag and drop pr
    FREE
    PZ Goldfinch Scalper EA
    PZ TRADING SLU
    2.69 (42)
    This is the latest iteration of my famous scalper, Goldfinch EA, published for the first time almost a decade ago. It scalps the market on sudden volatility expansions that take place in short periods of time: it assumes and tries to capitalize of inertia in price movement after a sudden price acceleration. This new version has been simplified to allow the trader use the optimization feature of the tester easily to find the best trading parameters. [ Installation Guide | Update Guide | Troublesh
    FREE
    PZ Turtle Trading EA MT5
    PZ TRADING SLU
    2 (4)
    This expert advisor implements the original Dennis and Eckhardt trading system, commonly known as The Turtle Trader. It trades exactly like the original turtles did, and can be used by experienced traders to capture trends in up or down markets. [ Installation Guide | Update Guide | Troubleshooting | FAQ | All Products ] Easy to use and supervise Fully configurable strategy settings Fully configurable trading settings Works for ECN/Non-ECN brokers and 2-3-4-5 digit symbols Works for CFDs and for
    FREE
    PZ Chart Overlay MT5
    PZ TRADING SLU
    4 (1)
    Master the market: harness the power of statistical arbitrage This indicator showcases the price action of multiple instruments on a single chart, enabling you to compare the fluctuations of different assets and seamlessly implement statistical arbitrage strategies. Its main usage is to find correlated symbols which are temporarily out of whack. [ Installation Guide | Update Guide | Troubleshooting | FAQ | All Products ] Find overbought or oversold currency pairs easily Plot up to six currency
    FREE
    PZ Turtle Trading MT5
    PZ TRADING SLU
    4.67 (6)
    The Turtle Trading Indicator implements the original Dennis Richards and Bill Eckhart trading system, commonly known as The Turtle Trader. This trend following system relies on breakouts of historical highs and lows to take and close trades: it is the complete opposite to the "buy low and sell high" approach. The main rule is "Trade an N-day breakout and take profits when an M-day high or low is breached (N must me above M)".  [ Installation Guide | Update Guide | Troubleshooting | FAQ | All Pr
    FREE
    Identify precise entry and exit points with AB=CD patterns This indicator finds AB=CD retracement patterns. The AB=CD Retracement pattern is a 4-point price structure where the initial price segment is partially retraced and followed by an equidistant move from the completion of the pullback, and is the basic foundation for all harmonic patterns. [ Installation Guide | Update Guide | Troubleshooting | FAQ | All Products ] Customizable pattern sizes Customizable AC and BD ratios Customizable b
    PZ Harmonacci Patterns
    PZ TRADING SLU
    3.17 (6)
    Trade smarter, not harder: Empower your trading with Harmonacci Patterns This is arguably the most complete harmonic price formation auto-recognition indicator you can find for the MetaTrader Platform. It detects 19 different patterns, takes fibonacci projections as seriously as you do, displays the Potential Reversal Zone (PRZ) and finds suitable stop-loss and take-profit levels. [ Installation Guide | Update Guide | Troubleshooting | FAQ | All Products ] It detects 19 different harmonic pric
    PZ Lopez Impulse MT5
    PZ TRADING SLU
    5 (4)
    Transform your trading approach with reliable bullish and bearish patterns This indicator evaluates volatility and price directionality simultaneously, which finds the following events. Decisive and sudden price movements Large hammers/shooting stars patterns Strong breakouts backed by most market participants Indecisive but volatile market situations It is an extremely easy to use indicator... The blue histogram represents the bullish impulse The red histogram represents the bearish impulse The
    FREE
    PZ Day Trading
    PZ TRADING SLU
    3.67 (3)
    Effortless trading: non-repainting indicator for accurate price reversals This indicator detects price reversals in a zig-zag fashion, using only price action analysis and a donchian channel. It has been specifically designed for short-term trading, without repainting or backpainting at all. It is a fantastic tool for shrewd traders aiming to increase the timing of their operations. [ Installation Guide | Update Guide | Troubleshooting | FAQ | All Products ] Amazingly easy to trade It provides
    PZ Pivot Points MT5
    PZ TRADING SLU
    4.91 (22)
    This indicator displays pivot points in the chart, including historical vales, and supports many calculation modes for Pivot Points and S/R levels. [ Installation Guide | Update Guide | Troubleshooting | FAQ | All Products ] It plots historical levels for backtesting purposes It allows you to select the reference timeframe It implements different Pivot Point calculation modes It implements different SR calculation modes It implements customizable colors and sizes Calculation Modes The indicato
    FREE
    Noise filtering: the key to mastering trends This indicator tracks the market trend with an unmatched reliability, by ignoring sudden fluctuations and market noise. It has been designed to trend-trade intraday charts and small timeframes. Its winning ratio is around 85%. [ Installation Guide | Update Guide | Troubleshooting | FAQ | All Products ] Amazingly easy to trade Find oversold/overbought situations Enjoy noise-free trading at all times Avoid being whipsawed in intraday charts The indi
    Trade double tops and bottoms effectively The PZ Double Top/Bottom Indicator is a technical analysis tool that helps traders identify potential price reversal patterns in the market. These patterns, known as double tops and bottoms, are characterized by two consecutive peaks or valleys in the price of an asset. Double tops and bottoms are often seen as potential reversal patterns because they can signal a change in the direction of the current trend. [ Installation Guide | Update Guide | Troubl
    Unlock market continuations with the accurate pennants indicator This indicator finds pennants , which are continuation patterns identified by converging trendlines surrounding a price consolidation period. Trades are signaled using a breakout period alongside the formation breakout.  [ Installation Guide | Update Guide | Troubleshooting | FAQ | All Products ] Easy to use Customizable colors and sizes It implements breakout signals It implements alerts of all kinds Optimal Usage To see pennants
    PZ Inside Bars MT5
    PZ TRADING SLU
    4.5 (12)
    Enhance your price action strategy: inside bar breakouts at your fingertips This indicator detects inside bars of several ranges, making it very easy for price action traders to spot and act on inside bar breakouts. [ Installation Guide | Update Guide | Troubleshooting | FAQ | All Products ] Easy to use and understand Customizable color selections The indicator implements visual/mail/push/sound alerts The indicator does not repaint or backpaint An inside bar is a bar or series of bars which is/a
    FREE
    This expert advisor implements the original Dennis and Eckhardt trading system, commonly known as The Turtle Trader. It trades exactly like the original turtles did, and can be used by experienced traders to capture trends in up or down markets. [ Installation Guide | Update Guide | Troubleshooting | FAQ | All Products ] Easy to use and supervise Fully configurable strategy settings Fully configurable trading settings Works for ECN/Non-ECN brokers and 2-3-4-5 digit symbols Works for CFDs and for
    FREE
    PZ Trendlines
    PZ TRADING SLU
    4.27 (11)
    Tired of plotting trendlines? The PZ TrendLines indicator applies a mechanical approach to the construction of trend lines for you! [ Installation Guide | Update Guide | Troubleshooting | FAQ | All Products ] It can draw up to 18 trendlines Trendlines can be optionally based on fractals Each line represents a breakout level Each trendline can be broken or rejected Configurable amount of lines Configurable colors Author Arturo López Pérez, private investor and speculator, software engineer and
    FREE
    PZ Three Drives
    PZ TRADING SLU
    5 (2)
    This indicator finds Three Drives patterns. The Three Drives pattern is a 6-point reversal pattern characterised by a series of higher highs or lower lows that complete at a 127% or 161.8% Fibonacci extension. It signals that the market is exhausted and a reversal can happen. [ Installation Guide | Update Guide | Troubleshooting | FAQ | All Products ] Customizable pattern sizes Customizable colors and sizes Customizable breakout periods Customizable 1-2-3 and 0-A-B ratios It implements visual/s
    FREE
    PZ The Zone
    PZ TRADING SLU
    4.33 (3)
    This indicator displays buy or sell signals according to Bill Williams' definition of the Trading Zone. [ Installation Guide | Update Guide | Troubleshooting | FAQ | All Products ] Easy to use and understand Avoid trading flat markets Deterministic indicator with clear rules The indicator is non-repainting It implements alerts of all kinds It has straightforward trading implications. A blue arrow is a buy signal A red arrow is a sell signal According to Bill Williams trading in the zone helps to
    FREE
    Your swiss army knife to ancipate price reversals This indicator anticipates price reversals analyzing bullish and bearish pressure in the market. The buying pressure is the sum of all the accumulation bars over a certain number of days, multiplied by the volume. The selling pressure is the sum of all of the distribution over the same number of bars, multiplied by the volume. It gives you a measure of the buying pressure as a percentage of the total activity, which value should fluctuate from 0
    FREE
    PZ Turtle Trading
    PZ TRADING SLU
    3.8 (10)
    The Turtle Trading Indicator implements the original Dennis Richards and Bill Eckhart trading system, commonly known as The Turtle Trader. This trend following system relies on breakouts of historical highs and lows to take and close trades: it is the complete opposite to the "buy low and sell high" approach. The main rule is "Trade an N-day breakout and take profits when an M-day high or low is breached (N must me above M)". [ Installation Guide | Update Guide | Troubleshooting | FAQ | All Prod
    FREE
    PZ Sandwich Bars MT5
    PZ TRADING SLU
    5 (3)
    Spot high-probability trades: sandwich bar breakouts at your fingertips This indicator detects Sandwich Bars of several ranges, an extremely reliable breakout pattern. A sandwich setup consists on a single bar that engulfs several past bars, breaking and rejecting the complete price range. [ Installation Guide | Update Guide | Troubleshooting | FAQ | All Products ] Easy and effective usage Customizable bar ranges Customizable color selections The indicator implements visual/mail/push/sound aler
    FREE
    Identify trending and flat markets effortlessly This indicator calculates how much has a symbol moved in relative terms to find trending or flat markets. It displays what percentage of the latest price range is directional. It can be used to avoid trading in flat markets, or to find flat markets to execute range-bound trading strategies. [ Installation Guide | Update Guide | Troubleshooting | FAQ | All Products ] A value of zero means the market is absolutely flat A value of 100 means the marke
    FREE
    Filter:
    nunovski
    283
    nunovski 2024.05.30 20:55 
     

    Well, for the moment doens't work as it should

    PZ TRADING SLU
    844442
    Reply from developer Arturo Lopez Perez 2024.08.06 11:37
    Any errors in the expert tab that explains why the indicator is not loading?
    Reply to review