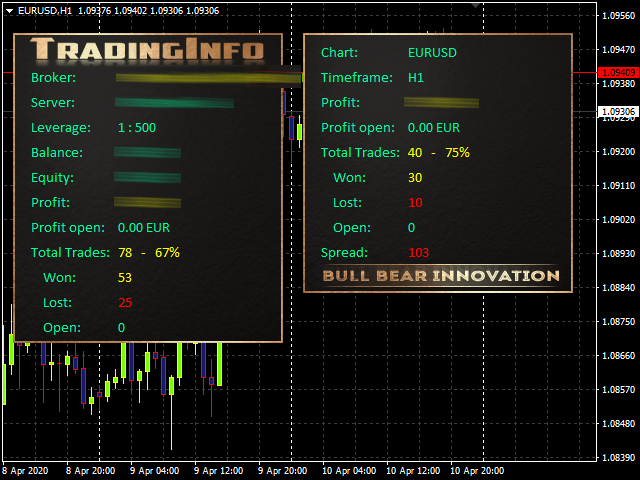
Its good!
- Overview
- Reviews (8)
- Comments (4)
- What's new
TradingInfo
TradingInfo shows you detailed Information about your Account.
It also shows you your Profit, Trades, Ratio and the Spread of current Chart.
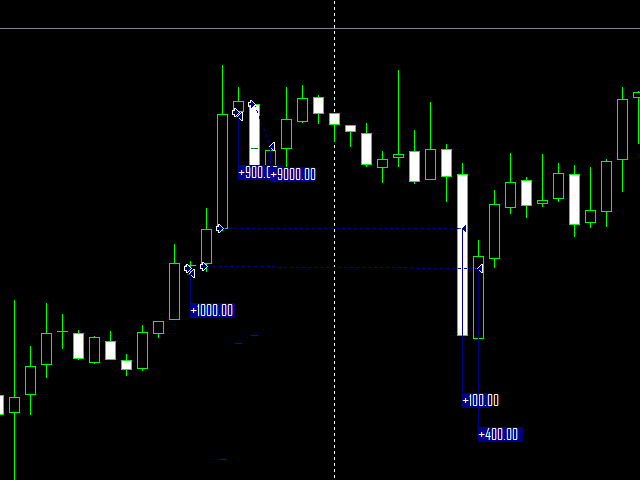
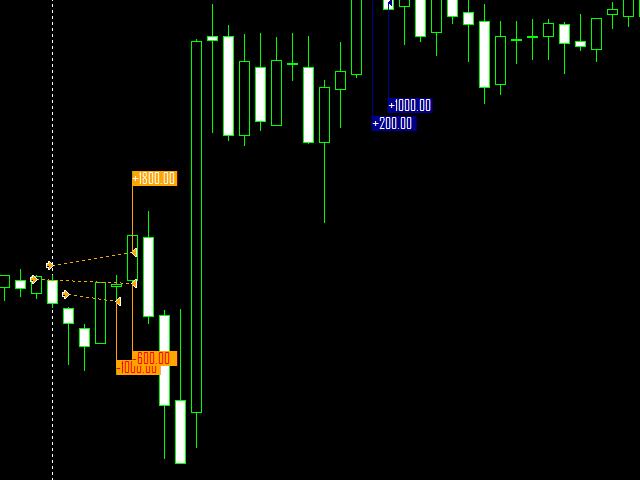
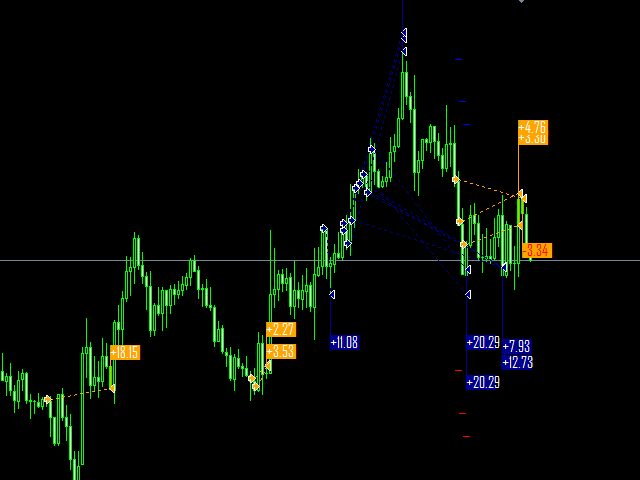
With integrated function "Draw Profit" you will get all your Orders drawn with Profit on the Chart.
You can use it on any Chart and any Timeframe, also for manual Trading or an EA.
With this powerful Tool you have a great overview of your Account.
TradingInfo Inputs
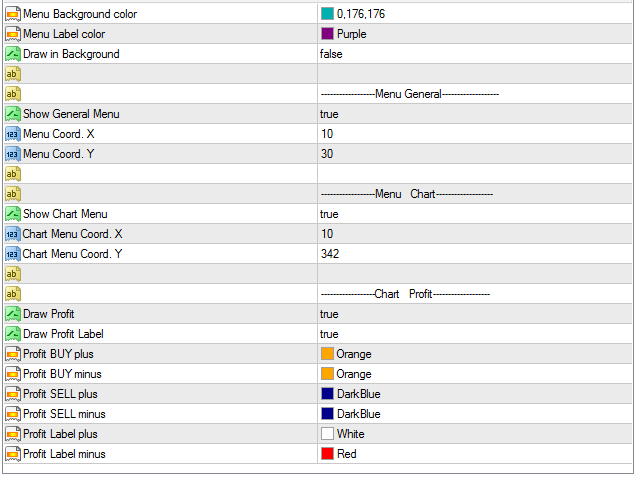
- Menu Background color - the color of menu
- Manu Label color - the color of the font
- Menu in Background - if yes, then you see other objects through the menu
Menu General:
- Show General Menu - on/off
- Menu Coord. X - X coordinate for the menu (horizontal)
- Menu Coord. Y - Y coordinate for the menu (vertical)
Menu Chart:
- Show Chart Menu - on/off
- Chart Menu Coord. X - X coordinate for the menu (horizontal)
- Chart MenuCoord. Y - Y coordinate for the menu (vertical)
Chart Profit:
- Draw Profit - on/off
- Draw Profit Label - Draw the Profit of Orders on/off
- Profit BUY plus - Color of Buy Orders ends in plus
- Profit BUY minus - Color of Buy Orders ends in minus
- Profit SELL plus - Color of Sell Orders ends in plus
- Profit SELL minus - Color of Sell Orders ends in minus
- Profit Label plus - Color of Orders Profit ends in plus
- Profit Label minus - Color of Orders Profit ends in minus
Recommended products

SAWA Framework EA
FREE
Alejandro Funes
SAWA Framework is the perfect tool for automatic or manual trading ! But this is only the DEMO version. check out the full version here !
How does it work? You can trade manually or use it in automatic mode with your own strategy. The expert advisor opens a position when all signals enabled agree on the direction of the trend.
It includes 3 types of Money Management: Fix Lot. Auto-lot calculated with a percentage of the account Balance in risk. Auto-lot calculated with a multiplier of the pr

MQLTA Support Resistance Lines DEMO
FREE
MQL4 Trading Automation
MQLTA Support Resistance Lines is an indicator that calculates the historical levels of Support and Resistance and display them as Lines on chart. It will also Alert you if the price is in a Safe or Dangerous zone to trade and show you the distance to the next level. The indicator is ideal to be used in other Expert Advisor through the iCustom function. This DEMO only works with AUDNZD, the full product can be found at https://www.mql5.com/en/market/product/26328
How does it work? The indicato

Show Pips
FREE
Roman Podpora
This information indicator allows you to always be aware of the current account status. The indicator shows various data, including profit in points, percentage and currency, as well as a current symbol spread and time before a bar is closed on the current timeframe. You can select one of the different info line location types: To the right of the price (always following it); As a comment (in the upper left corner of the chart); In a selected screen corner. You can also select a data separator:

MQLTA Support Resistance Lines
FREE
MQL4 Trading Automation
MQLTA Support Resistance Lines is an indicator that calculates the historical levels of Support and Resistance and display them as Lines on chart. It will also Alert you if the price is in a Safe or Dangerous zone to trade and show you the distance to the next level. The indicator is ideal to be used in other Expert Advisor through the iCustom function. This indicator can be tested LIVE on AUDNZD with the following DEMO https://www.mql5.com/en/market/product/26572
How does it work? The indicat

Clever Trend Force Lite
FREE
Carlos Forero
LITE VERSION ONLY EURUSD - FULL VERSION HERE Here you can access our discord community for more information about our tools and benefits. KEY LINKS: Indicator Manual – How to Install - Discord Server – Frequent Questions - All Products Description: Indicator which uses trend, breakout and reversal innovative indicators to show a complete visual trading strategy, with transparent metrics. It follows simple visual patterns, which will improve your trading significantly. Outstanding Feat

Absolute currency strength for MT4
FREE
Radim Kucera
Indicator measures strength of each currency in your list.
Main idea: It simply iterates through all combinations of pairs and adds difference between open and close in percent. Parameters: List of currencies - what currencies will be calculated (maximum is 8) Calculation type - from which data will be strength calculated Calculation data input - used as input related to calculation type Symbol suffix - used in case of suffix on symbols, e.g: when your symbols look like EURUSDm, EURUSDmicro et

Support Resistance Multi Time Frame FREE
FREE
FXsolutions
This indicator shows the latest untouched support and resistance as horizontal lines. The indicator can show support/resistance from higher timeframes. With this indicator you can e.g. easily see the support/resistance of the timeframes H4, D1 and W1 on a H1 chart, which can be a big advantage while time your entry on H1. This is the FREE version of the indicator: Support Resistance Multi Time Frame The free version works only on EURUSD and GBPUSD!
Parameters referenceTF: the timeframe from wh

Double Parabolic MTF free
FREE
Pavel Zamoshnikov
This is an advanced multi-timeframe version of the popular Parabolic SAR indicator. Double Parabolic MTF free combines two timeframes on Parabolic SAR graph. The higher timeframe Parabolic defines the trend, while the lower timeframe one searches for the market entry point in trend direction.
How to use
Buy if the lower timeframe Parabolic has switched and is under the price. The higher timeframe Parabolic should also be under the price. A stop loss can be set at the higher or lower timeframe

OandaX Positive Ratio
FREE
Andrei Trukhanovich
The OandaX product series is designed to display additional data on orders and positions provided by the Oanda FxLabs service. The OandaX Positive Ratio indicator is designed to display the history data on the ratio of buyers and sellers, who have a profitable position on the instrument, to the total number of buyers and sellers. In the Volume weighted mode, the ratio also takes into account the profit/loss size of the positions (distance from the position opening price to the current price). Fo

Fibo Zone Lite
FREE
Evgeny Galikhin
The indicator displays strong support and resistance areas near the levels of certain type calculated using ZigZag vertices with greater amplitude. The strength of levels is defined by the accumulation of Fibo levels calculated using ZigZag vertices with lower amplitude. These areas can be considered as potential reversal zones and used to perform trades and fix profit. Potential reversal zones efficiently sort out the signals received from the oscillators. Also, the functionality for the detect

ZigZag SupportAndResistance
FREE
Nikolay Churbanov
The Zigzag Support And Resistance is an indicator for showing support and resistance zones based on the ZigZag extremums.
Indicator Settings
PrecalculateBars - the number of bars for the preview; SmoothPercent - smoothing of the levels as a percentage; LiveBars - lifetime of a level in bars; D1Depth - depth of the ZigZag indicator on the D1 chart; H4Depth - depth of the ZigZag indicator on the H4 chart; H1Depth - depth of the ZigZag indicator on the H1 chart; M15Depth - depth of the ZigZag

Daily Fibonacci Levels
FREE
Andriy Svyetlichnyy
The Daily Fibonacci Levels is an indicator designed for displaying the Fibonacci levels by days using horizontal lines. Displayed levels: +100% (high) +61,8% +38,2% +23,6% average = (high+low)/2 -23.6% -38.2% -61.8% -100% (low) The indicator provides the ability to specify the hour to consider the start of the day. This may be necessary if the dates on the server are changed during the trading session.
Parameters StartHour — the hour for this indicator to consider as the start of a new day.

AverageDailyRange
FREE
Nikolay Churbanov
The Average Daily Range is an indicator for showing support and resistance zones based on the average daily price range of currency. It is necessary to look for the buy signal when the price goes over the resistance level, and for the sell signal when the price goes over the support level. The indicator shows the static and dynamic levels. Static levels are calculated based on the opening price of the day. Dynamic levels are calculated based on the daily Highs and Lows.
Indicator Settings ADRP

Wise Men Indicator demo
FREE
Bohdan Kasyanenko
The indicator displays signals according to the strategy of Bill Williams on the chart. Demo version of the indicator has the same features as the paid, except that it can work only on a demo account .
Signal "First Wise Man" is formed when there is a divergent bar with angulation. Bullish divergent bar - with lower minimum and closing price in the upper half. Bearish divergent bar - higher maximum and the closing price at the bottom half. Angulation is formed when all three lines of Alligat

Project Future FREE
FREE
Evgeny Belyaev
Project Future FREE is a professional arrow indicator with notification functions (alert, email, mobile). Project Future FREE is a demo version, which works only on the USDCAD currency pair. Unlimited version can be purchased here: https://www.mql5.com/en/market/product/25072 .
Advantages of the indicator Suitable for scalping and intraday trading. Simple and easy indicator configuration. Works on all timeframes. Does not redraw. It can be used as a stand-alone tool or in conjunction with othe

SN Levels MT4
FREE
Alexandr Gavrilin
The utility is designed as an indicator for quick and easy drawing of horizontal levels on the chart. Several indicators with different settings can work on the same chart independently.
Settings:
Right Shift-indent from the right edge of the chart in pixels. Line Width-line thickness. Label Size - size of the price label text. Line Style-line style. Line Color-line color. Label color - color of the price label. Add Key - select the function key to add a line. For notifications when you t

Trend dashboard FREE
FREE
Jan Flodin
This multi time frame and multi symbol trend indicator sends an alert (paid version only) when a strong trend or trend reversal has been identified. It can do so by selecting to build up the dashboard using Moving average (single or double (MA crossover)), RSI, Bollinger bands, ADX, Composite index, Parabolic SAR, Awesome (AO), MACD (signal line) or Stochastics crossovers. It can be used with all time frames from M5 to MN. This free version is limited to EURUSD, GBPUSD and USDJPY and without

Follow The Line
FREE
Oliver Gideon Amofa Appiah
FOLLOW THE LINE GET THE FULL VERSION HERE: https://www.mql5.com/en/market/product/36024 This indicator obeys the popular maxim that: "THE TREND IS YOUR FRIEND" It paints a GREEN line for BUY and also paints a RED line for SELL. It gives alarms and alerts of all kinds. IT DOES NOT REPAINT and can be used for all currency pairs and timeframes. Yes, as easy and simple as that. Even a newbie can use it to make great and reliable trades.
NB: For best results, get my other premium indicators for mo

Extremum Reverse Bar
FREE
Yurij Izyumov
This indicator has been created for finding the probable reversal points of the symbol price. A small candlestick reversal pattern is used it its operation in conjunction with a filter of extremums. The indicator is not redrawn! If the extremum filter is disabled, the indicator shows all points that have a pattern. If the extremum filter is enabled, the condition works – if the history Previous bars 1 candles back contains higher candles and they are farther than the Previous bars 2 candle, such

The Levels of Volatility
30 USD Sergey Efimenko
The indicator shows support/resistance levels based on the currency volatility for the selected period (number of bars) on the specified timeframe (regardless of the indicator timeframe). Price data on the selected currency and specified timeframe (by default – D1) are necessary for the indicator's normal operation. To download the necessary data, simply open the new window of the selected timeframe. МetaТrader 5 version: https://www.mql5.com/en/market/product/6832 Parameters Volatility bars co

Sm Ichimoku Scanner
FREE
Steeve Christian Martol
Multi Time Frame Indicator acts as a Scanner based on the Ichimoku Trading System. The outcome is displayed on a board. This helps you to make "at a glance" a mental picture of the System without having to open the chart. Up to 10 Currencies can be watched. Scanned elements And Legend "KUMO Futur" - Green : The Kumo Futur is Bullish. "KUMO Futur" - Red : The Kumo Futur is Bearish. "PRICE Cross KJ" - Green : The Price is Above the Kijun Sen. "PRICE Cross KJ" - Red : The Price is Below the Kijun

Time Range Separator
FREE
Chantal Sala
Time Range Separator is a useful tool to display a separator period on your platform. You could go in the properties of the indicator, select the desired range and that's ALL. We believe it is a useful and necessary that we wish to share with you for free all our followers.
Input Values: TimeFrame Period Separator GMT_Hour (ex. +1 or -1) to move the lines at Period Time +/- tot hours in input Hide_dates to show or hide the datetime on vertical lines VLine_Color = Vertical Color Line VLine_Styl

Ultimate Double Top Bottom Reversal Indicator FREE
FREE
FXsolutions
This indicator is designed to detect high probability reversal patterns: Double Tops/Bottoms with fake breakouts . This is the FREE version of the indicator: https://www.mql5.com/en/market/product/26371 The free version works only on EURUSD and GBPUSD! Please read also the blog post " Professional Trading With Double Tops/Bottoms And Divergences! " which explains the concepts behind the ULTIMATE Double Top/Bottom indicator and how you can use a professional top-down approach. The provided video

Close America Europa
FREE
Dmitry Melnichenko
Simple indicator that shows the closing levels of the US and European sessions. Parameters AmericaTime - specify the closing time of the US session. EuropeanTime - specify the closing time of the European session. ColorAmerica - color of the US session level. ColorEuropa - color of the European session level. Pressing the "1" key (on the numeric keypad): hide/display the US closing levels; "2" key - European levels.

FFx RVI
FREE
Eric Venturi-Bloxs
The purpose of this new version of the MT4 standard indicator provided in your platform is to display in a sub-window multiple timeframes of the same indicator. See the example shown in the picture below. But the display isn’t like a simple MTF indicator. This is the real display of the indicator on its timeframe. Here's the options available in the FFx indicator: Select the timeframes to be displayed (M1 to Monthly) Define the width (number of bars) for each timeframe box Alert pop up/sound/ema

Support and Resistance Custom For Free
FREE
Wen Cheng Wen
Support and Resistance is a very important reference for trading. This indicator provides customized support and resistance levels, automatic draw line and play music functions. In addition to the custom RS, the default RS includes Pivot Point, Fibonacci, integer Price, MA, Bollinger Bands. Pivot Point is a resistance and support system. It has been widely used at froex,stocks, futures, treasury bonds and indexes. It is an effective support resistance analysis system. Fibonacci also known as t

Volume Ticks ResSup Demo
FREE
Sergey Zhukov
The market price is moved by the market makers with large amounts of equity. The only way to understand intentions of big players is to track their activity by concentration of volumes on one level or another. Volume Ticks ResSup draws a level with the maximum concentration of a tick volume since the beginning of a day. In most cases, such level is an actual support or resistance level. This version works only on a demo account with the EURUSD currency pair. The full version of the indicator . P

Mad MB lite
FREE
Chenchen Liu
Mad MB I am a Chinese, my English level is not good, if you can understand Chinese, please switch to Chinese, the introduction is more detailed. MadMB EA is based on custom variation of Bands indicator and MA. Ea's profitability is not high, but relatively stable.Every order have stoploss level. The default parameters are applicable to XAUUSD at 5m. it you have any quession you can Leaving a message. This is a preliminary version, the signal is not filtered. I will gradually raise the price of t

Classic Keltner Channel Demo
FREE
Muhammad Elbermawi
This is a Demo version that works only on EURUSD , one-hour chart with full functionality. Read CKC Manual: https://www.mql5.com/en/blogs/post/736577 CKC Full version: https://www.mql5.com/en/market/product/24390 CKC Expert Advisor Example: https://www.mql5.com/en/blogs/post/734150 Why demo version
Try before you buy on live charts, without the MT4 Tester restrictions. Try Mobile Notifications and email service. Try all indicator color lists. About CKC
This indicator works depending on

Free automatic fibonacci
FREE
Tonny Obare
Free automatic fibonacci is an indicator that automatically plots a fibonacci retracement based on the number of bars you select on the BarsToScan setting in the indicator. The fibonacci is automatically updated in real time as new highest and lowest values appears amongst the selected bars. You can select which level values to be displayed in the indicator settings. You can also select the color of the levels thus enabling the trader to be able to attach the indicator several times with differe
Buyers of this product also purchase

Entry Points Pro
125 USD Yury Orlov
This is a trend indicator for MT4 providing accurate signals to enter a trade without redrawing or delays.
It can be applied to any financial assets: forex, cryptocurrencies, metals, stocks, indices . The best results are on the timeframe M15+
Our Telegram group | MT5 version of the indicator
IMPORTANT! Contact me after your purchase to get the detailed guide and bonus. Video (6:22) - one signal that made a profit equal to triple the price of the indicator. Video (4:4

Advanced Supply Demand
148 USD Bernhard Schweigert
CURRENTLY 33% OFF !! Best Solution for any Newbie or Expert Trader! This indicator is a unique, high quality and affordable trading tool because we have incorporated a number of proprietary features and a new formula. With this update, you will be able to show double timeframe zones . You will not only be able to show a higher TF but to show both, the chart TF, PLUS the higher TF: SHOWING NESTED ZONES . All Supply Demand traders will love it. :) Important Information Revealed
Maximize th

Advanced Currency Strength28 Indicator
148 USD Bernhard Schweigert
CURRENTLY 26% OFF Best Solution for any Newbie or Expert Trader! This Indicator is a unique, high quality and affordable trading tool because we have incorporated a number of proprietary features and a new formula. With only ONE chart you can read Currency Strength for 28 Forex pairs! Imagine how your trading will improve because you are able to pinpoint the exact trigger point of a new trend or scalping opportunity? User manual: click here That's the first one, the original! Don't buy a worthle

Best Currency Strength Indicator
149 USD Tumelo Rakotsoane
Advanced Currency Strength Indicator
The Advanced Divergence Currency Strength Indicator. Not only it breaks down all 28 forex currency pairs and calculates the strength of individual currencies across all timeframes , but, You'll be analyzing the WHOLE forex market in 1 window (In just 1 minute) . This indicator is very powerful because it reveals the true movements of the market. It is highly recommended to analyze charts knowing the performance of individual currencies or the countries ec

PipFinite Breakout EDGE
98 USD Karlo Wilson Vendiola
The Missing Edge You Need To Catch Breakouts Like A Pro. Follow a step-by-step system that detects the most powerful breakouts!
Discover market patterns that generate massive rewards based on a proven and tested strategy.
Unlock Your Serious Edge
Get it here www.mql5.com/en/blogs/post/723208
Have access to the game changing indicator that will take your trading to the next level!
How To Trade
Execute your trades in 3 Easy Steps!
Step 1: Trade Setup Enter a signal if Success Rate is

PipFinite Trend PRO
98 USD Karlo Wilson Vendiola
Breakthrough Solution For Trend Trading And Filtering With All Important Features Built Inside One Tool! Trend Pro's smart algorithm detects the trend, filters out market noise and gives entry signals with exit levels. The new features with enhanced rules for statistical calculation improved the overall performance of this indicator.
Important Information Revealed Maximize the potential of Trend Pro, please visit www.mql5.com/en/blogs/post/713938 Test the demo version and explore its feature

FX Volume
75 USD Daniel Stein
You want to become a constantly profitable 5-star forex trader? 1. Read the basic description of our simple trading system & and it's major strategy update in 2020 2. Send a screenshot of your purchase to get your personal invitation to our exclusive trading chat
Following the smart money is finally possible! FX Volume is the FIRST and ONLY volume indicator that provides a REAL insight into the market sentiment from a broker's point of view. It provides awesome insights into how ins

FX Power
75 USD Daniel Stein
️️️️️ You want to become a constantly profitable 5-star forex trader? ️️️️️ 1. Read the basic description of our simple trading system & and it's major strategy update in 2020 2. Send a screenshot of your purchase to get your personal invitation to our exclusive trading chat
FX Power is the first currency strength meter with a complete history across all time frames.
It analyzes the momentum and strength of all major currencies to determine high probability trades. Key Fe

Bermaui Deviation Percent
50 USD Muhammad Elbermawi
Or ( BD% ) which is a volatility index that measures volatility in percent rather than points. The idea of BD% is to make an index depending on the Classic Standard Deviation (CSD) that moves between 0 and 100 percent.
You can use BD% to compare volatility for the same security in different time periods or different time-frames. In addition, you can use BD% to compare volatility between different securities in different markets in terms of percent rather than points.
The idea behind th

Advanced Currency IMPULSE with ALERT
78 USD Bernhard Schweigert
CURRENTLY 39% OFF !! Best Solution for any Newbie or Expert Trader! This indicator is a unique, high quality and affordable trading tool because we have incorporated a number of proprietary features and a secret formula. With only ONE chart it gives Alerts for all 28 currency pairs . Imagine how your trading will improve because you are able to pinpoint the exact trigger point of a new trend or scalping opportunity! Built on new underlying algorithms it makes it even easier to identify an

Infinity TrendLine PRO
99 USD Evgenii Aksenov
PROMO: Buy Trend Line PRO today and contact me to get for free:
1) User's Manual about the indicator and built in pop-up Scanner 2) Settings files for Bitcoin, GOLD, EURUSD, GBPUSD 3) HTF Histogram (basement indicator) which shows Higher TimeFrame trend in the bottom of chart TrendLine PRO indicator is based on the analysis of the strength of bulls and bears. TrendLine PRO never repaint and does not change the levels!!! It shows the highlighted trend line (blue is bulls and red is bea

Bermaui Bands
50 USD Muhammad Elbermawi
Bermaui Bands (BB) is a technical analysis tool that helps filter between ranging and trending price movements. The idea behind this indicator can be explained in the next steps: Calculate Standard Deviation as an oscillator that moves between 0 and 100. I will name it Bermaui Deviation percent (BD %). If "BD %" is near zero then volatility is at its extreme. In addition, if "BD %" is near 100 then volatility is very low. High volatility means a great probability for a trending market, whi

True Direction Oscillator
60 USD Muhammad Elbermawi
Or (TDO) which is an index that measures the price rate of change using the principle of " Pure Momentum ".
When a security price advances from 10 to 15 then the price rate of change is 150% but when it declines back from 15 to 10 then price rate of change is 33.3% only. That is why technical analysis indicators like "Price Rate of Change" (ROC) or "Momentum" gives higher readings for ascending price movements than that given to descending ones. TDO fixes this problem to help traders at

PipTick VSA MT4
97 USD Michal Jurnik
PipTick VSA is based on the original Volume Spread Analysis method. It was designed for quick and easy recognition of VSA patterns. Even though this indicator looks very simple, it is the most sophisticated tool that we have ever made. PipTick VSA indicator is a really powerful analytical tool that generates very reliable trading signals. Because it is very user friendly and understandable, it is suitable for every type of trader, regardless of their experience.
What Is VSA? VSA (Volume Spread

Heiken Ashi Scanner
50 USD Philip Pankaj
Heikin-Ashi charts , developed by Munehisa Homma in the 1700s. Munehisa Honma was a rice merchant from Sakata, Japan who traded in the Dojima Rice market in Osaka during the Tokugawa Shogunate. He is considered to be the father of the candlestick chart. Th e man who invented the use of candlestick charts for finding and profiting from chart patterns.He was a billionaire trader on those days if we compared his net-worth with todays dollar . Heikin Ashi Scanner is an Multi-Currency and Multi

FX Trend
75 USD Daniel Stein
️️️️️ You want to become a constantly profitable 5-star forex trader? ️️️️️ 1. Read the basic description of our simple trading system & and it's major strategy update in 2020 2. Send a screenshot of your purchase to get your personal invitation to our exclusive trading chat
FX Trend displays the trend direction, duration, intensity and the resulting trend rating for all time frames in real time.
You'll see at a glance at which direction the trends are running, how long

Precision Support Resistance MT4
60 USD Young Ho Seo
Support and Resistance are the important price levels to watch out during intraday market. These price levels are often tested before development of new trend or often stop the existing trend causing trend reversal at this point. Highly precise support and resistance are indispensable for experienced traders. Many typical trading strategies like breakout or trend reversal can be played well around these support and resistance levels. The Precision Support and Resistance are highly accurate suppo

Advanced Parabolic SAR Scanner
59 USD FXsolutions
This scanner shows the trend values of the well known indicator Parabolic SAR for up to 30 instruments and 8 time frames. You can get alerts via MT4, Email and Push-Notification as soon as the direction of the trend changes.
Important Information How you can maximize the potential of the scanner, please read here: www.mql5.com/en/blogs/post/718074
You have many possibilities to use the scanner. Here are two examples: With this scanner you can trade a top-down approach easily. If two higher t

Centaurus Trend Engine
50 USD Philip Muga
Centaurus Trend Engine is an indicator that uses custom indicators to give the current momentum moves of the market with a multi-timeframe approach to trading. Features Value Area -It is the (red/green) rectangular box on your chart based on the dynamic structure period set;Green to indicate you focus on LONG moves & Red for SHORT moves Analysis - Displays The Market Analysis Strength - Displays The Market Strength Trend - Displays The Market Trend Entry State - Displays the BEST entry time for

CME CallPut Option Ratio MT4
50 USD Vasiliy Sokolov
Call/Put Ratio is one of the most well-known indicators of the market sentiment. The indicator has been developed by Martin Zweig. It is based on real volumes of the CBOE option market. As we know, a Call option gives its owner the right to buy the underlying asset at a predetermined price. A Put option gives the right to sell it. Thus, increasing volumes for Call options indicate the increasing demand. The growth of Put option volumes shows that supply starts exceeding demand. If we divide the

VR Small Chart
59 USD Vladimir Pastushak
The indicator displays a separate mini chart in a working window similar to МТ5 mini charts. You can expand/collapse the chart, change the chart symbol, period, as well as time and price scales. The app works in the strategy tester and you can switch the period of a mini chart.
Settings Select symbols - All Symbols: all symbols provided by a broker, Only market watch: only the symbols present in the Market Watch Prefix - two letters for distinguishing between a few indicator copies (if more th

Actual Levels
99 USD Ilya Fomin
The indicator shows significant support and resistance levels. When the price approaches these levels, it in some way responds either to the levels themselves, or to the areas that are near these levels. These levels can be viewed as potential reversal zone. Accordingly, the levels can be used for performing trading operations or closing previously opened positions.
For example You can buy if the price rolls back from the support level upwards, or sell if the price rolls back from the resistan

Best And Worst Dashboard
100 USD Chantal Sala
Best and worst Dashboard was born from the idea to have a panel that includes all the symbols in a chart. It is very importance to understand which symbols are both positive and negative. In the past, we realized the single indicator Best and Worst ( https://www.mql5.com/en/market/product/11784 ), now thanks to the upgrading of the Metatrader the dashboard displays all the instruments simultaneously. A great revolution. This Dashboard is able to calculate performance at any time frame and clicki

ARIMA Trend Forecaster
50 USD Ilya Antipin
The ARIMA Trend Forecaster indicator is designed for analyzing and forecasting the trend component of a financial instrument based on the integrated ARIMA autoregressive model. The ARIMA methodology aims at identifying the presence of unit roots and the order of time series integration. In financial markets, autoregressive models are used for working with price time series to predict future price points. The ARIMA Trend Forecaster indicator using all the advantages of the ARIMA method allows to

Trading System
50 USD aleksey kasyanov
The Trading System indicator is a fully functional trading system suitable for both novice and experienced traders. Timeframe is from M5 to H4, settings are optimized for any mentioned timeframe (no adjustable settings). Examples of the system operation can be seen in screenshots. The simplest example of its operation is Buy and Sell signals and level of probable breakthrough rollback, which is plotted basing on data from all available timeframes (a vertical line on the chart is also a signal of

Blahtech Supply Demand
124 USD Blahtech Limited
Supply Demand uses previous price action to identify potential imbalances between buyers and sellers. The key is to identify the better odds zones, not just the untouched ones. Blahtech Supply Demand indicator delivers functionality previously unavailable on any trading platform. This 4-in-1 indicator not only highlights the higher probability zones using a multi-criteria strength engine, but also combines it with multi-timeframe trend analysis, previously confirmed swings and engulfing detector

Lighthouse
75 USD Daniel Stein
You want to become a constantly profitable 5-star forex trader? 1. Read the basic description of our simple trading system & and it's major strategy update in 2020 2. Send a screenshot of your purchase to get your personal invitation to our exclusive trading chat
Lighthouse is an amazing precise and reliable support and resistance indicator.
It displays the most important trading levels and draws them according to their relevance.
If a level is clearly broken, it changes its rol

FXtraderariel Indicator
100 USD Ariel Capja
This is the FXTraderariel-Indicator . It scans the market for opportunities and creates a buy or sell signal. Depending on the settings and trading style, it can be used for scalping or long-term trading . The indicator can be used on every time frame , but we advise to use it on H1, H4 and D1 . Especially if you are a novice trader. Pro Traders can also you use it for scalping in smaller timeframes (M1, M5 and M15). This indicator is not a complete trading system. It doesn't give you exit point

TPA True Price Action MT4 Indicator
168 USD InvestSoft
TPA True Price Action indicator reveals the true price action of the market makers through 100% non-repainting signals (except early signals mode) strictly at the close of a candle!
TPA shows entries and re-entries, every time the bulls are definitely stronger than the bears and vice versa. Not to confuse with red/green candles. The shift of power gets confirmed at the earliest stage and is ONE exit strategy of several. The first part of the TPA manual "The Basics" is now available (free to g

Advanced Dashboard for Currency Strength and Speed
199 USD Bernhard Schweigert
CURRENTLY 20% OFF !! Best Solution for any Newbie or Expert Trader! This dashboard software is working on 28 currency pairs. It is based on 2 of our main indicators (Advanced Currency Strength 28 and Advanced Currency Impulse). It gives a great overview of the entire Forex market. It shows Advanced Currency Strength values, currency speed of movement and signals for 28 Forex pairs in all (9) timeframes. Imagine how your trading will improve when you can watch the entire market using a sin
More from author

IPRO Zar EA
479 USD Paul Reymkhe
B ULL B EAR I NNOVATION
️ Technology To Success ️
LAUNCH PROMO - 35% SALE ! - on request we have decided to offer 5 LAST COPIES - 2 LEFT!
After all the years of hard research, development and testing, we present to you o

TrendfollowerSR
119 USD Paul Reymkhe
B ULL B EAR I NNOVATION
️ Technology To Success ️
Correct identification of the trends in stock investments are pivotal and TrendFollowerSR ensures this perspective while displaying the correct trend on multiply timeframes to help you go long way as much as possible. The latest technology of the Indicator enables to track whether if a certain trend has just begun ,

PROscalper
99 USD Paul Reymkhe
PROscalper is a perfect tool for traders who use the scalping strategy! It gives you the visual view of the main Stoploss , Takeprofits and current/last pips on the chart and also in the integrated menu . So with this overview you have the high quality indicator for scalping! You can use PROscalper on any timeframes and on any pairs , but lower timeframes are recommended. To improve results , you can combine PROscalper with a Trendindicator (TrendfollowerSR) to get a dual confirmation for the en

Daily Breakouts
99 USD Paul Reymkhe
DailyBreakouts is the perfect tool for traders who use the breakout strategy! First, DailyBreakouts analyzes the last day; then, the beginning of the new day. After that, it gives you the signal for the breakout . With the integrated menu, you have the perfect overview of the pips, breakout zones, stop loss, and take profit. DailyBreakouts works on M30 and H1 timeframes, because it gives you one signal per day - so it is pointless to use lower or higher timeframes. To improve results, you can co

BreakOutSR
69 USD Paul Reymkhe
BreakoutSR shows you possible breakouts for current/following day . With integrated Support and Resistance lines and a menu you have a better overview of the chart. If the candle closes above "LONG" go long , if the candle closes below "SHORT" go short . Same is for SHORT/LONG Breakouts. Quick and easy to understand - tool, perfect for all types of traders.
BreakOutSR Inputs MT4 Alert - Alerts you on ur MT4 Terminal Broker GTM - your Broker GTM BreakOuts: Draw Breakouts - Draw the Breakout lin

SpreadLive
FREE
Paul Reymkhe
SpreadLive shows the full Spread history of a chart with different colors. It alerts you (MT4, E-Mail and Mobile) when the spread reaches the limit, which you can define in the settings. The menu contains Current Spread , Average Spread and Highest Spread of current chart. The main idea is to use it with an EA and analyze negative profits from the spread history. This helps you to see how your broker varies the spread.
Inputs Spread limit - limit to alert. Type - Show in points or pips. Alert:

Binary Options DayTrading
349 USD Paul Reymkhe
BO - DayTrading is a perfect tool for traders who trade Binary Options! It is based on candle analysis , several oscillators and trend indicators. The signals consist of a buffer in a separate window, a vertical line in the main window and a horizontal line ("entry line") in the main window. BO - DayTrading has three options to trade: 60 Seconds 5min Long term Use " 60 Seconds " function only on M1 Chart, " 5min " on M1 and M5 and " Long term " function on M5, M15 and M30 timeframes.
Menu Si

PROvolumes
89 USD Paul Reymkhe
PROvolumes is the tool for traders who trade on lower Timeframes such as M1 and M5. The Indicator is based on serveral Oscillators with Multitimeframe Trendfilters - The entries in the Market are really tight by this Indicator. It gives you visual view of the Signalratio for current Chart and Timeframe and will also notify you when it's time to go long or short. For maximum Profit you can use our top Trendindicator TrendFollowerSR to get even better Winrate. You don't need to configurate PROvolu
Filter:

Dmitry Yurkov
2015.11.23 18:19
#
Полезный индикатор. Периодически бывает необходима информация по сделкам непосредственно на самом графике. Спасибо!
Version 1.60
2020.04.12
Changes:
- New Menu
- Fix in Proft Drawin on Chart
- New Menu
- Fix in Proft Drawin on Chart
Version 1.50
2016.09.09
Added commission to the calculation
Very helpful indicator