Fractals Dynamic MT4
- Indicators
- Ivan Butko
- Version: 1.0
Fractals Dynamic
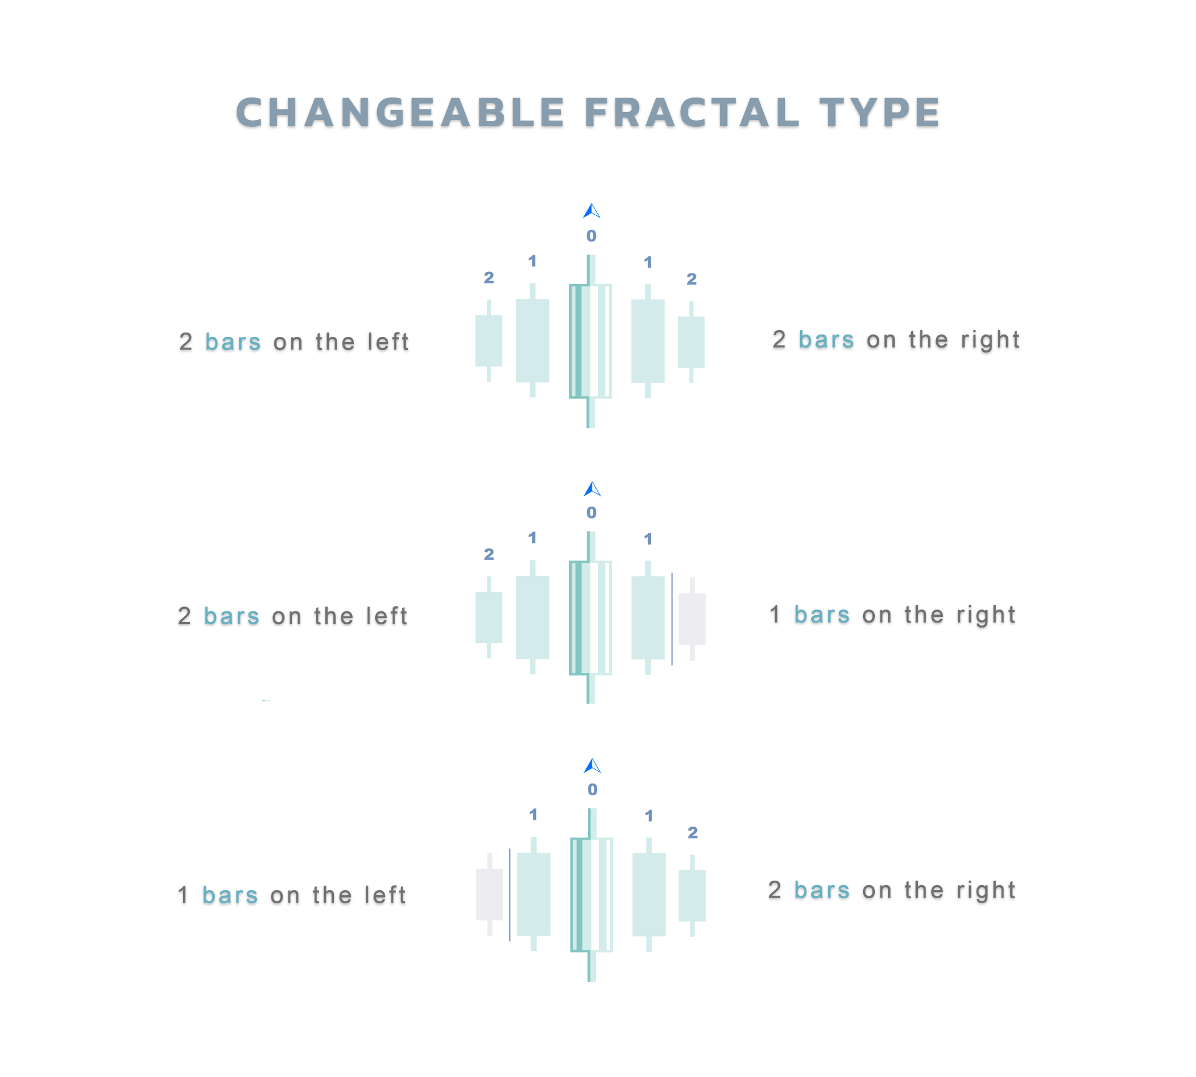
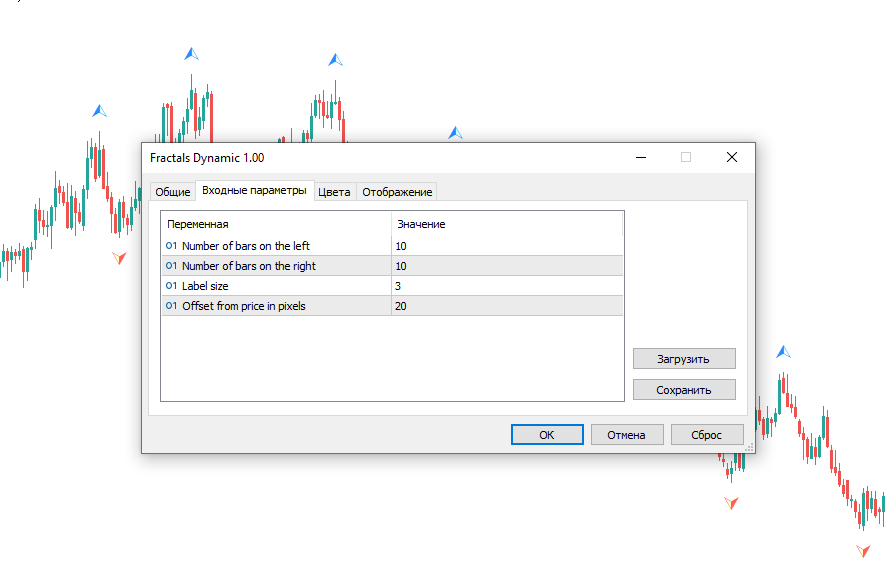
Fractals Dynamic – is a modified free fractal indicator by Bill Williams, in which you can manually set the number of bars on the left and right, thereby building unique patterns on the chart.
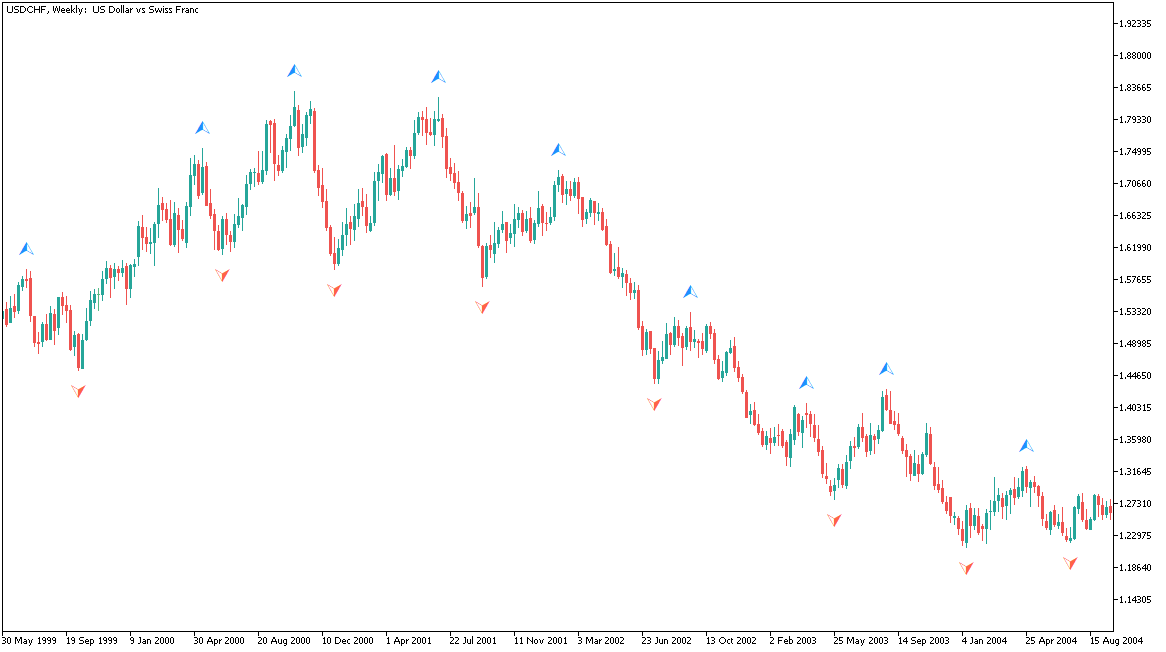
Now all trading strategies based on or based on the Fractals Dynamic indicator will have an additional signal.
In addition, fractals can act as support and resistance levels. And in some trading strategies, show liquidity levels. For this purpose, levels were introduced in this version of the multifractal and multitime frame indicator MultiFractal Levels.
Use the Fractals Dynamic indicator as an addition to your trading system
Try also my other products in the market https://www.mql5.com/ru/users/capitalplus/seller
Wishing you great profits in trading!