• Overview
  • Reviews
  • Comments

FOTSI Oscillator

Want to see the performance of the indicator? Copy trades of the FOTSI Reversal Expert trading signal for MetaTrader 4 - 30 EUR per month - Sidi Mohamed El Alaoui (mql5.com)

The trades were performed by the EA using FOTSI, the input and output parameters are different from those specified below.

For now only the signal is available, soon the expert will be on sale.

FOTSI (Forex Overview True Strength Index) for MT4

FOTSI is an indicator that analyzes the relative strength of currencies in major Forex pairs. It aims to anticipate corrections in currency pairs following strong trends by identifying potential entry signals through overbought and oversold target areas.

Theoretical Logic of Construction:

  • Calculation of Individual Currency Momentum: FOTSI starts by calculating the momentum for each currency pair that includes a specific currency, then aggregates by the currency of interest (EUR, USD, GBP, CHF, JPY, AUD, CAD, NZD).
  • Application of the TSI Formula: The "True Strength Index (TSI)" formula is applied to the momentum of individual currencies obtained in point 1. This produces an oscillator that oscillates above and below 0.
  • Responsiveness and Lag Minimization: FOTSI uses double smoothing on the momentum of individual currencies through TSI. This feature provides the indicator with a clean curve on the oscillator, attempting to minimize delays in trend reversals.

OPERATIONAL SYNTHESIS

A "Mean Reverting" strategy is suggested for the indicator, with the following suggested operational steps to identify, open, and close positions.

The identification areas are as follows:

  • OVERBOUGHT: Greater than 50. 
  • OVERSOLD: Less than -50. 
  • FLAT AREAS: Between -25 and +25. 
Other details:
  • It is advisable to use it on H1, H4, and D1 timeframes. 
  • When applied to the chart, the oscillator varies when changing the timeframe. 
  • If the timeframe remains the same but the currency pair changes, the indicator stays the same (as it represents currency strength). 
  • The two moving averages applied in the TSI formula are on 25 and 15 periods. These are standard values but can be changed to lower values if more investment opportunities are desired (which can also cause an increase in false alarms).

The suggested operation is as follows:

  • Currency Identification: Identify a currency in the overbought area (+50) or oversold area (-50).
  • Selection of Opposite Currencies: Identify currencies opposite the flat area (in the case of overbought in point 1, the currencies to identify will be those <-25, conversely >+25).
  • Opening the Position: Open the currency pair composed of the two identified currencies. The position is opened when there is convergence towards the center of the identified curve, either in overbought or oversold. It opens at the beginning of the new candle after registering the FOTSI convergence on the indicated currency.
  • Closing Conditions: At the discretion of the trader, it is suggested to close when the price surpasses the 50-period and 100-period exponential moving averages (thus opening 2 positions in point 3).
  • Stoploss and Position Sizing: It is recommended not to use a stoploss. If necessary, set it to 5 times the ATR on the reference timeframe. Pay attention to position sizing, as it is a countertrend strategy.

Practical Example (related to the points above):

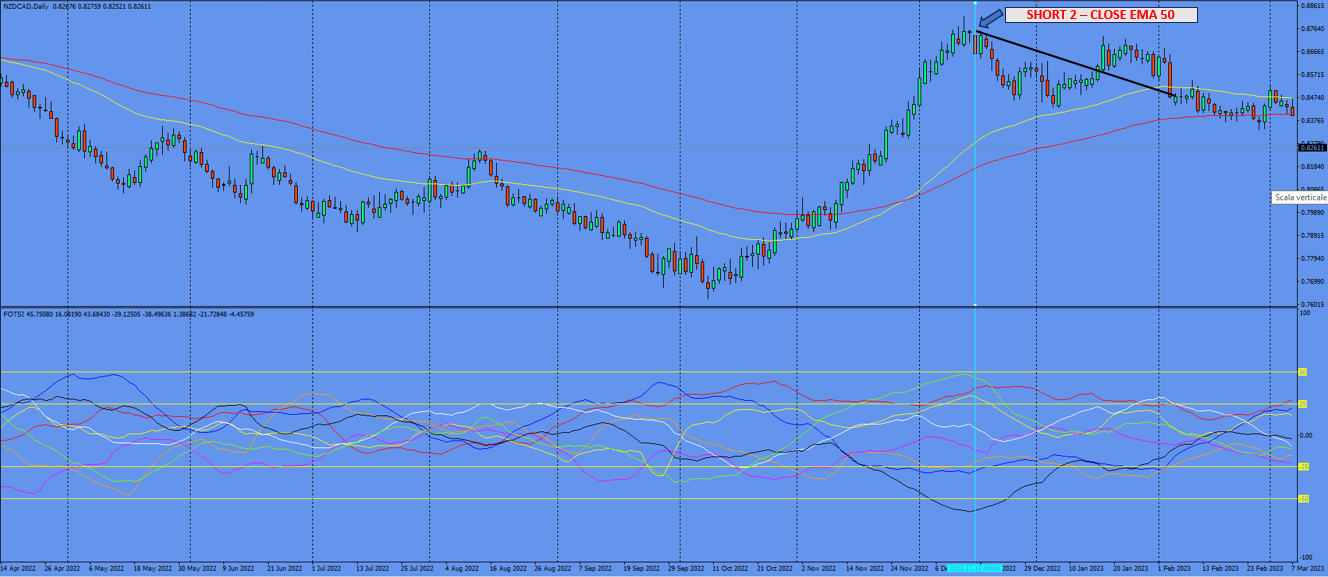
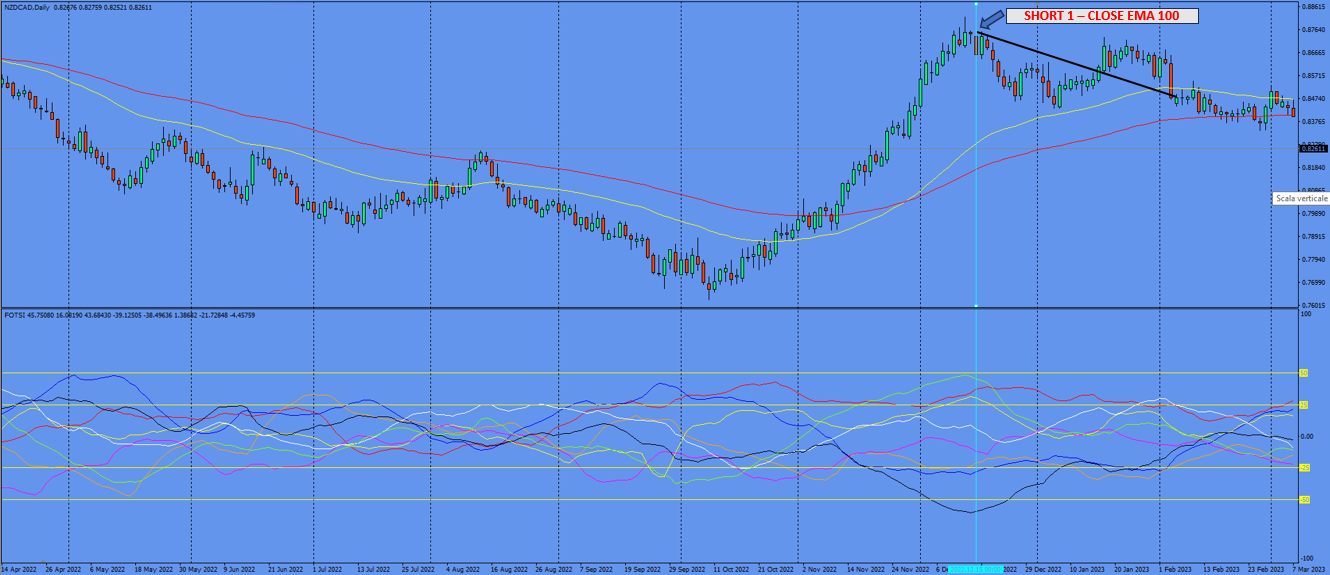
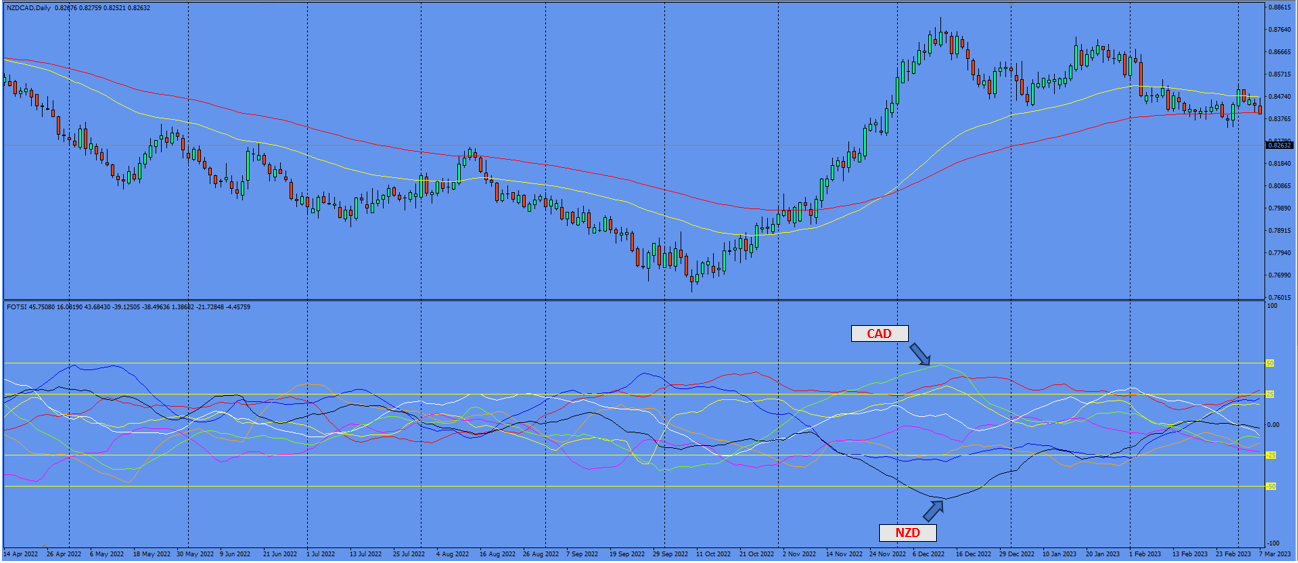
  • Identified oversold in Dec-2022 on NZD (below -50), opposite currencies CAD, EUR, and GBP (above +25). In this example, only screens of the NZDCAD case will be shown [IMG_1.png]. 
  • Open the first Short position on NZDCAD to close it at the previous close below EMA100 (red line) [IMG_2.png]. 
  • Open the second Short position on NZDCAD to close it at the previous close below EMA50 (yellow line) [IMG_3.png].

SETTINGS and INPUTS

The DEFAULT settings are suitable for all charts.

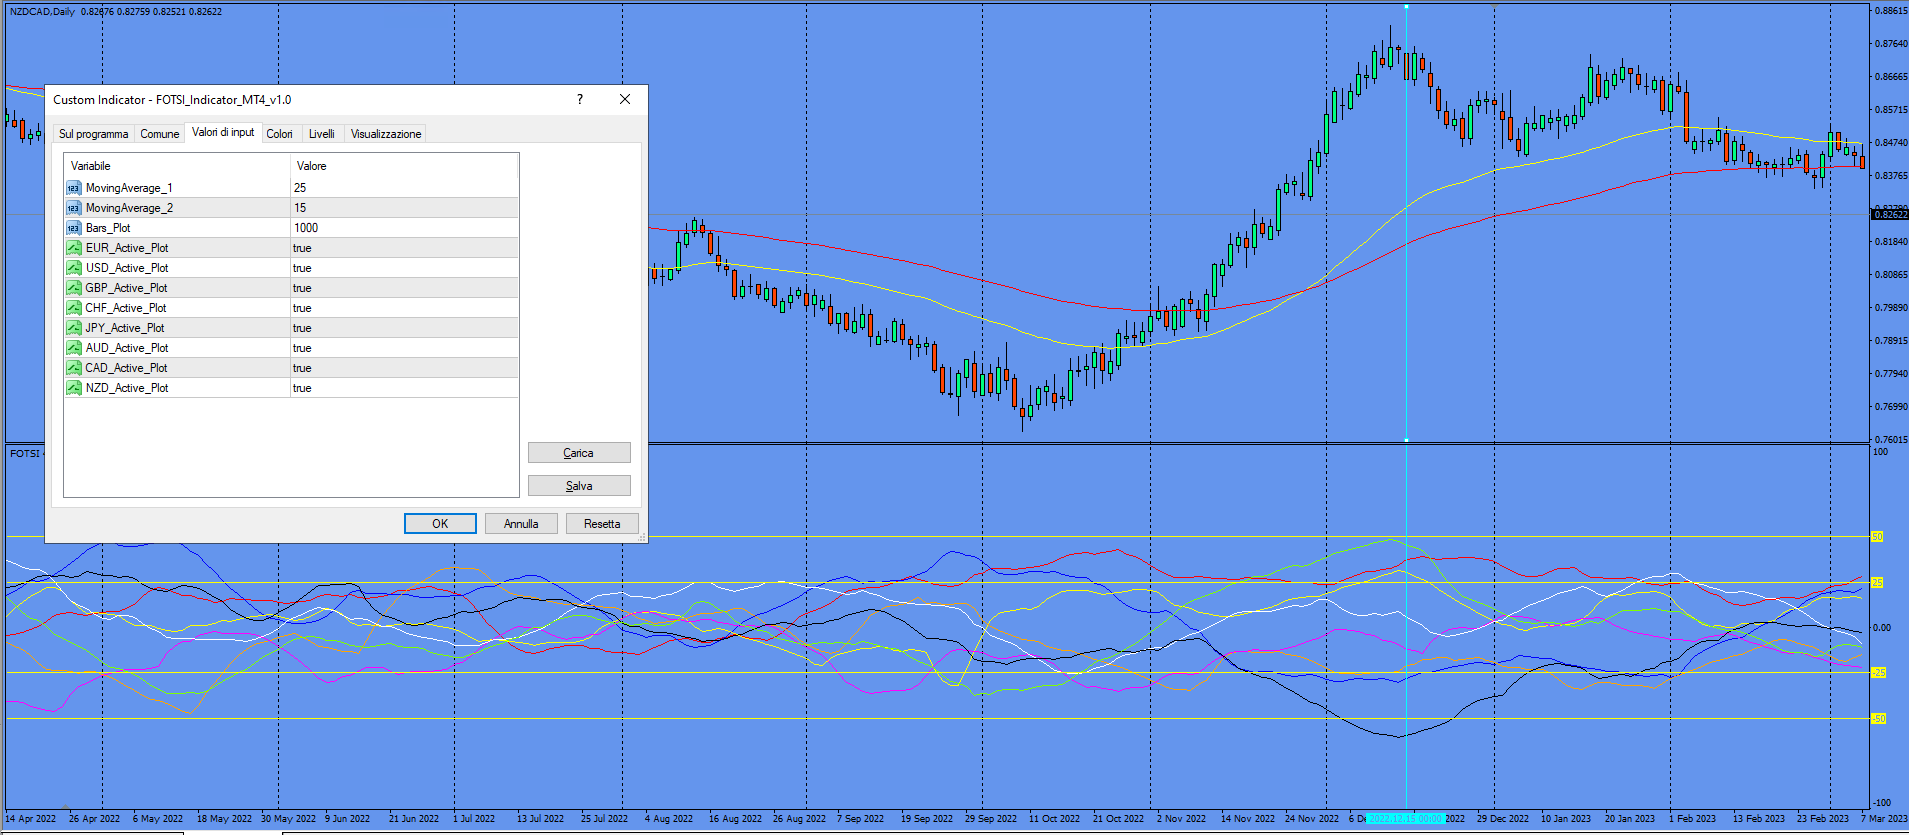
The explanation of inputs follows [IMG_4.png]:

  • MovingAverage_1 and MovingAverage_2: Periods of the two moving averages to apply the TSI formula. 
  • Bars_Plot: Number of candles to apply FOTSI (the first candles starting from the left will have a FOTSI not to consider; this aspect will be improved in the next release). It is advisable to keep it at 1000. 
  • EUR_Active_Plot, USD_Active_Plot...etc: Parameters that allow showing various currencies in the oscillator window. 

How to use the parameters (version 1.0 of the indicator):

  • For a macro analysis of all currencies, keep all currencies active (Active_Plot = TRUE) and Bars_Plot = 1000, on the indicated timeframes. 
  • For a specific analysis of 2/3 currencies, deactivate the others (also for convenience in viewing) and try increasing Bars_Plot for a greater historical depth. 
  • Keeping all currencies active and Bars_Plot>1000 may cause the indicator to slow down due to too much data to process. It is advisable to adhere to the above recommendations.

FUTURE DEVELOPMENTS:

Following is the roadmap for FOTSI developments:

DISTRIBUTION

  • All rental and purchase licenses include: 5 activations per user on 5 different computers owned by the buyer.

  • No expiration date for installations if purchased.

  • For contact regarding improvement suggestions and/or technical support: mt4.datatrade@gmail.com


Recommended products
Chart Patterns Detect 15 patterns (Ascending Triangle, Descending Triangle, Rising Wedge, Falling Wedge, Bullish Flag, Bearish Flag, Bullish Rectangle, Bearish Rectangle Symmetrical triangle, Head and Shoulders, Inverted Head and Shoulders, Triple top, Triple Bottom, Double Top, Double Bottom) Use historical data to calculate the probability of each pattern to succeed (possibility to filter notification according to the chance of success) gives graphic indication about the invalidation level and
This is an arrow indicator without a future function,developed based on the most advanced profit trading algorithms.It has the most innovative and advanced dual trend analysis module, as well as the latest and highly effective market trend prediction algorithm.Trends are your friends, and following larger trends can earn the maximum profit in foreign exchange. This indicator helps traders identify current trends and track them. Someone once made a profit of 10 times in a week by relying on it.No
Owl smart levels
Sergey Ermolov
4.63 (54)
MT5 version  |  FAQ The Owl Smart Levels Indicator  is a complete trading system within the one indicator that includes such popular market analysis tools as  Bill Williams' advanced fractals , Valable ZigZag which builds  the correct wave structure  of the market, and  Fibonacci levels  which mark the exact levels of entry into the market and places to take profits. Detailed description of the strategy Instructions for working with the indicator Advisor-assistant in trading Owl Helper Private
PZ Trend Trading
PZ TRADING SLU
4.75 (4)
Trend Trading is an indicator designed to profit as much as possible from trends taking place in the market, by timing pullbacks and breakouts. It finds trading opportunities by analyzing what the price is doing during established trends. [ Installation Guide | Update Guide | Troubleshooting | FAQ | All Products ] Trade financial markets with confidence and efficiency Profit from established trends without getting whipsawed Recognize profitable pullbacks, breakouts and early reversals The ind
Advanced Trend Regime
Shellard Securities (Pty) Ltd
The indicator has been designed to function on any time-frame and any pair.   This regime filter will help the trader better evaluate whether the current market is trending, and in which direction. It quickly reacts to changes in market dynamics using a series of advanced calculations. The user is able to select whether the calculation remains standard, or if a further filter constraint is added to the calculation.   A Yellow moving average of the signal has been included for the trader to smoot
The indicator builds current quotes, which can be compared with historical ones and on this basis make a price movement forecast. The indicator has a text field for quick navigation to the desired date. Options: Symbol - selection of the symbol that the indicator will display; SymbolPeriod - selection of the period from which the indicator will take data; IndicatorColor - indicator color; Inverse - true reverses quotes, false - original view; Next are the settings of the te
Atomic Analyst
Issam Kassas
5 (3)
First of all Its worth emphasizing here that this Trading Indicator is   Non-Repainting ,   Non-Redrawing   and   Non-Lagging   Indicator, Which makes it ideal from both manual and robot trading.  The Atomic Analyst  is a PA Price Action Indicator that uses Strength and Momentum of the price to find a better edge in the market. Equipped with Advanced filters which help remove noises and false signals, and Increase Trading Potential. Using Multiple layers of complex Indicators, the Atomic Anal
Trend PA
Mikhail Nazarenko
5 (3)
The Trend PA indicator uses   Price Action   and its own filtering algorithm to determine the trend. This approach helps to accurately determine entry points and the current trend on any timeframe. The indicator uses its own algorithm for analyzing price changes and Price Action. Which gives you the advantage of recognizing, without delay, a new nascent trend with fewer false positives. Trend filtering conditions can be selected in the settings individually for your trading style. The indicator
Infinity Trend Pro
Yaroslav Varankin
1 (1)
This is a trend indicator without redrawing Developed instead of the binary options strategy (by the color of the Martingale candlestick) Also works well in forex trading When to open trades (binary options) A signal will appear in the place with a candle signaling the current candle It is recommended to open a deal for one candle of the current timeframe M1 and M5 When a blue dot appears, open a deal up When a red dot appears, open a trade down. How to open trades on Forex. When a signal is rec
VR Cub
Vladimir Pastushak
VR Cub is an indicator for getting high-quality entry points. The indicator was developed to facilitate mathematical calculations and simplify the search for entry points into a position. The trading strategy for which the indicator was written has been proving its effectiveness for many years. The simplicity of the trading strategy is its great advantage, which allows even novice traders to successfully trade with it. VR Cub calculates position opening points and Take Profit and Stop Loss targe
Trendiness Index
Libertas LLC
5 (3)
"The trend is your friend" is one of the best known sayings in investing, because capturing large trendy price movements can be extremely profitable. However, trading with the trend is often easier said than done, because many indicators are based on price reversals not trends. These aren't very effective at identifying trendy periods, or predicting whether trends will continue. We developed the Trendiness Index to help address this problem by indicating the strength and direction of price trend
Black series MT4
Dmitriy Kashevich
1 (1)
Black series MT4 - The indicator is designed for trading on binary options with Timeframe M1-M5-M15 Multicurrency (Works on cryptocurrency and currency pairs) The signal appears when the candle opens Up to 90% correct signals There is no signal redrawing at all Can be used with other indicators. Good for scalping! In Settings there is: -Indicator working methods -I Allert Arrow color Red signal down Blue signal up Also watch the video how the indicator works and signals
Forex Gump
Andrey Kozak
2.83 (6)
Forex Gump is a fully finished semi-automatic trading system. In the form of arrows, signals are displayed on the screen for opening and closing deals. All you need is to follow the instructions of the indicator. When the indicator shows a blue arrow, you need to open a buy order. When the indicator shows a red arrow, you need to open a sell order. Close orders when the indicator draws a yellow cross. In order to get the most effective result, we recommend using the timeframes H1, H4, D1. There
Power Renko MT4
Pierce Vallieres
Power Renko is an indicator which plots Renko bricks underneath the chart using a histogram. You can select the brick size and the timeframe of the Renko bricks as well as whether or not to use the close price or the high/low price of the candles. Renko bricks are based on price alone, not time, therefor the Renko bricks will not be aligned with the chart's time. They are extremely useful for trend trading and many different strategies can be formed from them. Buffers are provided allowing you t
BinaryUniversal
Andrey Spiridonov
BinaryUniversal is a signal indicator for binary options and Forex. In its work, the indicator uses a complex algorithm for generating signals. Before forming a signal, the indicator analyzes volatility, candlestick patterns, important support and resistance levels. The indicator has the ability to adjust the accuracy of the signals, which makes it possible to apply this indicator for both aggressive and conservative trading. The indicator is set in the usual way, it works on any time period and
Smooth price for Monarch MT4
Konstantin Gruzdev
3.67 (3)
The Smooth Price technical indicator is used for plotting a smoothed line as close to the price of the financial instrument as possible, and serves to eliminate its noise components. The indicator is part of the Monarch trading system, but here it is presented as an independent technical analysis tool. The indicator is based on the cluster digital filter , which, unlike the ClusterSMA , is applied directly to the price time series. Smooth Price does not redraw (except the very last, zero bar) an
Strength and weakness of currencies : Shows the currency status at any time, values between 50 and -50 are neutral, everything outside indicates a trend change  Waves : Current state of waves, daily, weekly monthly and yearly Recommended volume for trading a specific number of waves Yearly High Low Drawn waves on which the market will react in advance, without redrawing Yearly candle with bonus levels used to display deviations  For more info contact me
PipFinite Trend PRO
Karlo Wilson Vendiola
4.9 (2775)
Breakthrough Solution For Trend Trading And Filtering With All Important Features Built Inside One Tool! Trend PRO's smart algorithm detects the trend, filters out market noise and gives entry signals with exit levels. The new features with enhanced rules for statistical calculation improved the overall performance of this indicator. Important Information Revealed Maximize the potential of Trend Pro, please visit www.mql5.com/en/blogs/post/713938 The Powerful Expert Advisor Version Automa
Daily Candle Predictor is an indicator that predicts the closing price of a candle. The indicator is primarily intended for use on D1 charts. This indicator is suitable for both traditional forex trading and binary options trading. The indicator can be used as a standalone trading system, or it can act as an addition to your existing trading system. This indicator analyzes the current candle, calculating certain strength factors inside the body of the candle itself, as well as the parameters of
WanaScalper MT4
Isaac Wanasolo
1 (1)
A scalping indicator based on mathematical patterns, which on average gives signals with relatively small SL, and also occasionally helps to catch big moves in the markets (more information in the video) This indicator has three main types of notifications: The first type warns of a possible/upcoming signal on the next bar The second type indicates the presence of a ready signal to enter the market/open a position The third type is for SL and TP levels - you will be notified every time price r
Introduction to Chart Pattern MT Chart Pattern MT is a chart pattern scanner to detect the triangle pattern, falling wedge pattern, rising wedge pattern, channel pattern and so on. Chart Pattern MT uses highly sophisticated chart pattern detection algorithm. However, we have designed it in the easy to use with intuitive user interface. Chart Pattern MT will show all the patterns in your chart in the most efficient format for your trading. You do not have to do tedious manual pattern detection an
This innovative indicator for measuring the strength of currencies from INFINITY is an indispensable assistant for scalpers and traders trading for a long time. The system for analyzing the Strength / weakness of currencies has long been known and used in the market by the world's leading traders. Any arbitrage trading is not complete without this analysis. Our indicator easily determines the strength of the base currencies in relation to each other. It displays line charts for all or the curren
Magic Balance
Daniil Evstratenko
The indicator shows which trading pairs, strategies, robots and signals that you use are profitable and which are not. The statistic of trades and balance graph are displayed in the account currency and pips - to switch simply click on the graph. button "$"(top left) - minimize/expand and move the indicator panel button ">"(bottom right) - stretching and resetting to the original size Statistic of trades 1 line - account balance, current profit and lot of open trades; 2 line - the number of al
Gyroscopes
Nadiya Mirosh
Gyroscope        professional forex expert   (for EURUSD, GBPUSD, USDJPY, AUDUSD, USDCHF, EURGBP, EURJPY, NZDUSD, USDCAD, EURCHF, AUDJPY, CADJPY pairs)   alyzing the market using the Elliot Wave Index. Elliott wave theory is the interpretation of processes in financial markets through a system of visual models (waves) on price charts. The author of the theory, Ralph Elliott, identified eight variants of alternating waves (of which five are in the trend and three are against the trend). The mo
Stepping Trend
Mpendulo Chiliza
The Stepping Trend Indicator     The Steppi ng Trend indicator uses the  average true range  (ATR indicator) in its calculation. This gives you control to set your own average true range period, I set the Default as 10.   Indicator Details. Green Arrow Up: This means you are at the starting point of a new bullish trend, it’s time to buy.   Red  Arrow  Down : This means you are at the starting point of a new  bearish  trend, it’ s time to sell .   What if you miss the Arrow Signal?   No
Binary Options Support Resistance Indicator This indicator is designed for binary options trading and effectively shows retracements from support and resistance levels. Signals appear on the current candle. A red arrow pointing downwards indicates a potential selling opportunity, while a blue arrow pointing upwards suggests buying opportunities. All that needs adjustment is the color of the signal arrows. It is recommended to use it on the M1-M5 timeframes as signals are frequent on these timef
Fourteen plus nine TD Sequential
MOHAMMED IMAD HUSSEIN BASSEE
Fourteen plus nine What is it for? Applying Tom DeMark’s TD Sequential serves the purpose of identifying a price point where an uptrend or a downtrend exhausts itself and reverses. . What are the main components of TD Sequential? TD Sequential has two parts – TD Setup and TD Countdown. The first phase of TD Sequential starts with a TD Setup and is completed with a 9 count. When the 9 count is completed, it is at that point, a price pause, price pullback, or reversal is likely. It is also at tha
Trend Ray
Andriy Sydoruk
The indicator shows the potential trend direction by cyclical-wave dependence. Thus, all the rays of the intersection will be optimal rays, in the direction of which the price is expected to move, taking into account the indicator period. Rays can be used as a direction for potential market movement. But we must not forget that the approach must be comprehensive, the indicator signals require additional information to enter the market.
ZhiBiCCI MT4
Qiuyang Zheng
5 (1)
[ZhiBiCCI] indicators are suitable for all cycle use, and are also suitable for all market varieties. [ZhiBiCCI] Green solid line is a reversal of bullish divergence. The green dotted line is a classic bullish divergence. [ZhiBiCCI] The solid line to the red is a reverse bearish divergence. The red dotted line is a classical bearish divergence. [ZhiBiCCI] can be set in the parameters (Alert, Send mail, Send notification), set to (true) to send instant signals to the alarm window, email, in
Super Gator
Agustinus Biotamalo Lumbantoruan
This indi shows the following 1. Supertrend 2. Alligator (Not a regular alligator) 3. ZigZag 4. Moving Average 5. Trend Continuation/Mini correction Signal (plotted in X) (See screenshots in green background color 6. Early Signal Detection (See screenshots in green background color) You may treat Alligator as the lagging indicator The leading indicator is the supertrend. The zig zag is based on the leading indicator where it gets plotted when the leading indicator got broken to the opposite.
Buyers of this product also purchase
Introducing the Miraculous Forex Indicator: Unleash the Power of Precision Trading Are you tired of searching for the perfect forex indicator that truly delivers exceptional results across all time frames? Look no further! The Miraculous Forex Indicator has arrived to revolutionize your trading experience and propel your profits to new heights. Built upon a foundation of cutting-edge technology and years of meticulous development, the Miraculous Forex Indicator stands as the pinnacle of str
PZ Harmonacci Patterns
PZ TRADING SLU
3.43 (7)
This is arguably the most complete harmonic price formation auto-recognition indicator you can find for the MetaTrader Platform. It detects 19 different patterns, takes fibonacci projections as seriously as you do, displays the Potential Reversal Zone (PRZ) and finds suitable stop-loss and take-profit levels. [ Installation Guide | Update Guide | Troubleshooting | FAQ | All Products ] It detects 19 different harmonic price formations It plots primary, derived and complementary Fibonacci pro
How to use Pair Trading Station Pair Trading Station is recommended for H1 time frame and you can use it for any currency pairs. To generate buy and sell signal, follow few steps below to apply Pair Trading Station to your MetaTrader terminal. When you load Pair Trading Station on your chart, Pair Trading station will assess available historical data in your MetaTrader platforms for each currency pair. On your chart, the amount of historical data available will be displayed for each currency pai
TrendMaestro
Stefano Frisetti
5 (2)
note: this indicator is for METATRADER4, if you want the version for METATRADER5 this is the link:  https://www.mql5.com/it/market/product/108106 TRENDMAESTRO ver 2.4 TRENDMAESTRO recognizes a new TREND in the bud, he never makes mistakes. The certainty of identifying a new TREND is priceless. DESCRIPTION TRENDMAESTRO identifies a new TREND in the bud, this indicator examines the volatility, volumes and momentum to identify the moment in which there is an explosion of one or more of these data a
Indicator : RealValueIndicator Description : RealValueIndicator is a powerful tool designed specifically for trading on the EURUSD pair. This indicator analyzes all EUR and USD pairs, calculates their real currency strength values, and displays them as a single realistic value to give you a head start on price. This indicator will tell you moves before they happen if you use it right. RealValueIndicator allows you to get a quick and accurate overview of the EURUSD currency pair tops and bottoms,
Alqannas
Mouhcine Haddad
ALQANNAS (Sniper) Indicator Overview: Welcome to ALQANNAS, your ultimate sniper in the forex market! ALQANNAS is a powerful and versatile trading indicator designed to enhance your trading experience. Whether you're a beginner or an experienced trader, ALQANNAS provides you with accurate non repainting signals, trend direction and strength, and advanced features to elevate your trading strategy.   Key Features: Buy and Sell Signals: ALQANNAS is equipped with a sophisticated algorithm that genera
The "Easy Ichimoku Wave Meter" indicator is a basic tool to automatically determine Waves according to Ichimoku! The indicator gives the possibility to simultaneously apply the Wave Theory, Time Theory and Target Price Theory according to the "Little Ichimoku" strategy developed by Sense Hosoda on the MT4 platform.  The use of this tool allows not only novice traders to instantly (fully automatic) determine the waves and their rapid interpretation, it also allows to automatically measure the p
Binary FX Ideal
Yaroslav Varankin
3.5 (2)
great tool for any trader for both Forex and binary options suitable for any trader no need to configure anything, everything has been perfected by time and experience The tool combines 5 indicators and 3 proprietary strategies works great during flats and trends It indicates a trend reversal at its very beginning, it works well with the trend Trading Recommendations The signal is formulated on the current candle You should enter the trade at the next Possible recount (rare)
Gann Signal
Kirill Borovskii
Gann Signal is a very simple indicator at first glance, but hidden inside is many years of experience in studying W.D.Ganna methods. The indicator gives accurate BUY/SELL signals, without redrawing. The indicator is very easy to use. All you need to do is attach it to your chart and follow its recommendations. The indicator constantly analyzes the market for entry opportunities. When such an opportunity appears, the indicator gives a signal in the form of an arrow. I repeat, all signals are NOT
ON Trade Optuma Astro
Abdullah Alrai
5 (4)
This is an astronomy indicator for the MT4 platform like optuma program that performs a variety of functions. It uses complex algorithms to perform its own calculations, which are so accurate. The indicator has a panel that provides astronomical information such as planets' geo/heliocentric cords, distance of sun/earth, magnitude, elongation, constellation, ecliptic cords, equatorial cords, and horizontal cords depending on  the vertical line that generated by the indicator depend on the time va
A percent graphic is a type of graph or chart used to represent data as a percentage of a whole. Percent graphics are often used to illustrate how a given set of data is distributed between different categories or how certain trends have changed over time. Percent graphics can be used to show the composition of a dow jones , or the performance of a company over a given period of time   d1 percet  w1 perncet  m1 percent  y1 percenty
Weis Wave with Alert
Trade The Volume Waves Single Member P.C.
4.79 (19)
Rental/Lifetime Package Options and Privileges' * For optimum results the yearly or lifetime package is suggested due to live training and Discord  channel trading with the  creator! Rent Monthly Six Months   Yearly/Lifetime Weis Wave with Speed with Alert+Speed Index x x x Manual  x x x Quick Set up Video x x x Blog x x x Lifetime Updates x x x Setup and Training Material x x Free Rectangle Break Alert Tool      x Discord Access Channel "The SI traders" x 2-hour live methodology traini
VTrende Pro mt4
Andrii Diachenko
3 (2)
VTrende Pro MT4 - MTF indicator for trend trading with a display panel for MT5 *** Videos can be translated into any language using subtitles (video language - Russian) Although the signals of the VTrende Pro indicator can be used as signals of a full-fledged trading system, it is recommended to use them in conjunction with the Bill Williams TS. VTrende Pro  MT4 is an extended version of the VTrende indicator. Difference between Pro version and VTrende: - Time zones - Signal V - signal 1-
The Nihilist 5.0 Indicator includes Forexalien and Nihilist Easy Trend trading strategies and systems. It is composed of an MTF Dashboard where you can analyze the different input possibilities of each strategy at a glance. It has an alert system with different types of configurable filters. You can also configure which TF you want to be notified on your Metatrader 4 platform and Mobile application The indicator has the option to view how could be a TP and SL by using ATR or fixed points, even
Full STO
Roman Smoroda
Full STO indicator (includes all versions of three STO indicators: Premium, Gold, Silver) - STABLE TRADE OPTION is designed for automatic binary options trading.  READ CAREFULLY!!!!! IMPORTANT In one terminal create two templates with different expirations, a template for 18:01, 18:02 with expirations from 1 to 15 minutes and a template for 22:00 with expirations from 10 to 20 minutes. Winrate: 71% over the past 5 years Money management: 0.3% from the deposit This version of the indic
Order Block Indicator MT4
Diego Arribas Lopez
5 (3)
[ MT5 Version ] Order Block Indicator MT4 Order Block Indicator MT4  is currently the most accurate and customizable indicator in the market. It has been developed to facilitate the analysis of operations based on Order Blocks and Supply and Demand Zones. These zones are possible reversal points of a movement. Order Blocks indicate a possible accumulation of orders in one area. The price usually gets to reach and react strongly to those areas. The most relevant levels for this reaction are the c
PZ Day Trading
PZ TRADING SLU
3.67 (3)
This indicator detects price reversals in a zig-zag fashion, using only price action analysis and a donchian channel. It has been specifically designed for short-term trading, without repainting or backpainting at all. It is a fantastic tool for shrewd traders aiming to increase the timing of their operations. [ Installation Guide | Update Guide | Troubleshooting | FAQ | All Products ] Amazingly easy to trade It provides value on every timeframe It provides suitable SL and TP levels It impl
Chaos Indicator
Stefano Frisetti
DESCRIPTION The CHAOS INDICATOR has been developed to be used for the TRADING STRATEGY OF CHAOS, as described in the book. The book is in italian language only and can be obtained only on my website indicated below. DATAS COLLECTED AND SHOWN ON GRAPHS The CHAOS INDICATOR apply easily to any graph and any asset, and it is a TRADING FACILITATOR, as it identify immediately the following items on any graph: - The GP (= RIGHT PRICE) i.e. the price to which the asset should be attracted within 24
Gann Swing Structure
Kirill Borovskii
5 (1)
This indicator is based on the mathematics of the great trader W.D. Ganna. With its help, you can easily find strong levels by analyzing swings to find the optimal entry point. The indicator works on all instruments and all timeframes. The indicator is fully manual and has control buttons. All you need to do is press the NEW button, a segment will appear, which you can place on any movement, swing or even 1 candle that you want to analyze. By placing the segment, press the OK button. A grid (th
PZ Swing Trading
PZ TRADING SLU
5 (4)
Swing Trading is the first indicator designed to detect swings in the direction of the trend and possible reversal swings. It uses the baseline swing trading approach, widely described in trading literature. The indicator studies several price and time vectors to track the aggregate trend direction and detects situations in which the market is oversold or overbought and ready to correct. [ Installation Guide | Update Guide | Troubleshooting | FAQ | All Products ] Profit for market swings with
Please send me Direct message on MQL5 CHAT after purchasing the Indicator for Training and Installation Support There are some additional files that is important to use with the Indicator . So be sure to contact me after purchasing the Indicator So that I can add you for training and support . If you find any difficulty with installation then send me Direct message here So that I can connect with you via Anydesk or Teamview for the product installation. " Smart Order Block Indicator " to find
The BB Reversal Arrows technical trading system has been developed to predict reverse points for making retail decisions. The current market situation is analyzed by the indicator and structured for several criteria: the expectation of reversal moments, potential turning points, purchase and sale signals. The indicator does not contain excess information, has a visual understandable interface, allowing traders to make reasonable decisions. All arrows appear to close the candle, without redr
Gold Channel is a volatility-based indicator, developed with a specific timing algorithm for the XAUUSD pair, which consists of finding possible corrections in the market. This indicator shows two outer lines, an inner line (retracement line) and an arrow sign, where the theory of the channel is to help identify overbought and oversold conditions in the market. The market price will generally fall between the boundaries of the channel. If prices touch or move outside the channel it is a tra
ECM Channel MT4
Paulo Rocha
5 (1)
ECM Elite Channel is a volatility-based indicator, developed with a specific time algorithm, which consists of finding possible corrections in the market. This indicator shows two outer lines, an inner line (retracement line) and an arrow sign, where the channel theory is to help identify overbought and oversold conditions in the market. The market price will generally fall between the boundaries of the channel. If prices touch or move outside the channel, it's a trading opportunity. The
Gann Zone Pro
Kirill Borovskii
This indicator identifies and displays zones, as it were areas of strength, where the price will unfold. The indicator can work on any chart, any instrument, at any timeframe. The indicator has two modes. The indicator is equipped with a control panel with buttons for convenience and split into two modes. Manual mode: To work with manual mode, you need to press the NEW button, a segment will appear. This segment is stretched over the movement and the LVL button is pressed. The level is displayed
Full Forex Market View Dashboard
Opengates Success International
5 (2)
FULL FOREX MARKET VIEW Dashboard Indicator This is a custom indicator created to give Traders a full view of what is going on in the market. It uses a real time data to access the market and display every bit of information needed to make successful trading. INSTALLATION : Before attaching this Indicator to your window chart, go to your MT4's Market Watch panel and HIDE all the Currency pairs you don't need or trade and leave the rest there. The reason is that FFMV Dashboard will DISPLAY ALL the
The indicator is designed to work on any trading platform. The program is based on proprietary algorithms and W.D.Ganna's mathematics, allowing you to calculate target levels of price movement based on three points with the highest degree of certainty. It is a great tool for stock trading. The indicator has three buttons: NEW - call up a triangle for calculation. DEL - delete the selected triangle. DELS - completely remove all constructions. The probability of achieving the goals is more than 80
EZT Trend
Tibor Rituper
4 (1)
The EZT Trend indicator will show you the trend, the pullback and the entry opportunities. Optional filtering and all type of alerts are available. E-mail and push notification alerts are added. We are also developing an EA based on this indicator, which will be available soon. It is a multi-functional indicator consisting of two color histograms and a line. It is a visual representation of a trend direction and strength, also you will find divergence many times, either on the line or on the his
IA Trendx3 PRO
Marco Aurelio Santos Costa
What if God Created a Trade System? No miracles... Just see how mathematics can be effective in the market. We managed to combine technical analysis / price action into indicators, creating the best setup for trading, be it in Forex, Indices, or stocks. It took us 2 years to create something that really works, and now it's time for you to discover it. TrendX3 is a revolution in trend analysis. Based on advanced algorithms and real-time data, it provides valuable insights so that you can make inf
The 5X target indicator is an indicator that plots the optimal entry zone and the target for the trading day. It also plots a level where the stoploss can be moved to breakeven for a risk free trade which is 2X. This indicator has time window inputs. The default settings are from 02:00 to 19:00 CET+1 time zone. This indicator is based used with a direction bias for the day. I post the direction bias for several pairs in the comments section. Added a new feature Time Zone to help trade the highes
More from author
FOTSI Oscillator MT5
Sidi Mohamed El Alaoui
Want to see the performance of the indicator applied to Expert Advisor?   Copy trades of the FOTSI Reversal Expert trading signal for MetaTrader 4 - 30 EUR per month - Sidi Mohamed El Alaoui (mql5.com) The trades were performed by the EA using FOTSI, the input and output parameters are different from those specified below. For now only the signal is available, soon the expert will be on sale. FOTSI (Forex Overview True Strength Index) for MT5! FOTSI is an indicator that analyzes the relative
Filter:
No reviews
Reply to review