ArwByIdx MT5
- Indicators
- Sajiro- Yoshizaki
- Version: 2.13
- Activations: 20
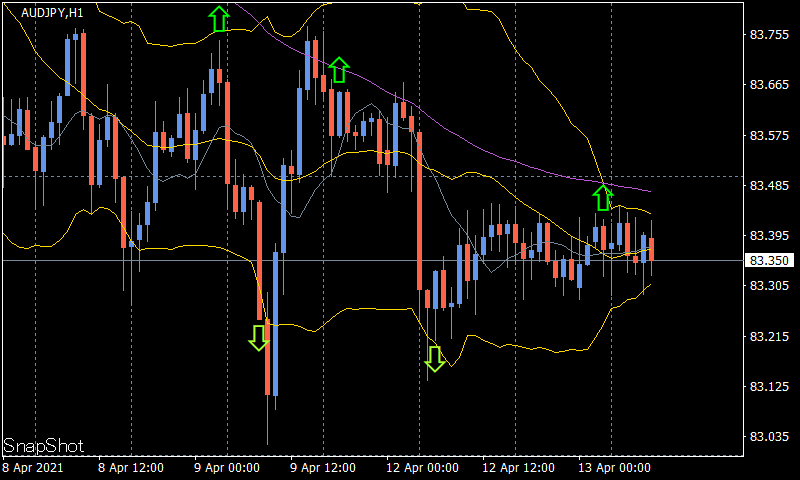
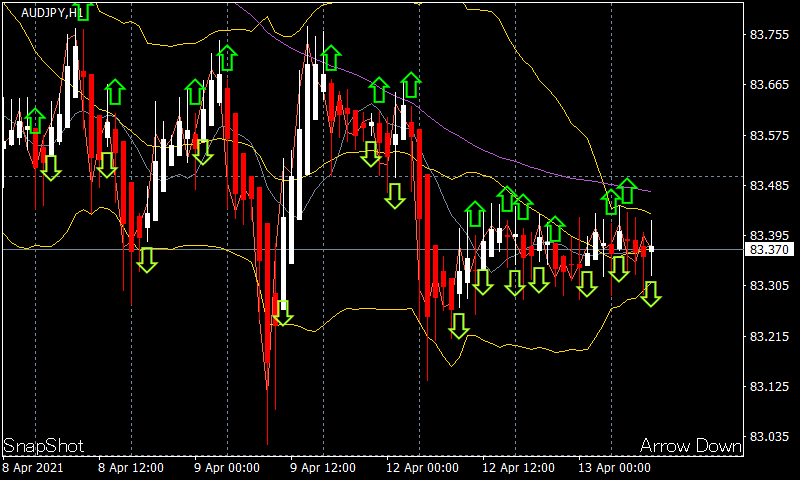
This product receives information from indicators/signal tools and displays arrows or notifications when specific conditions are met.
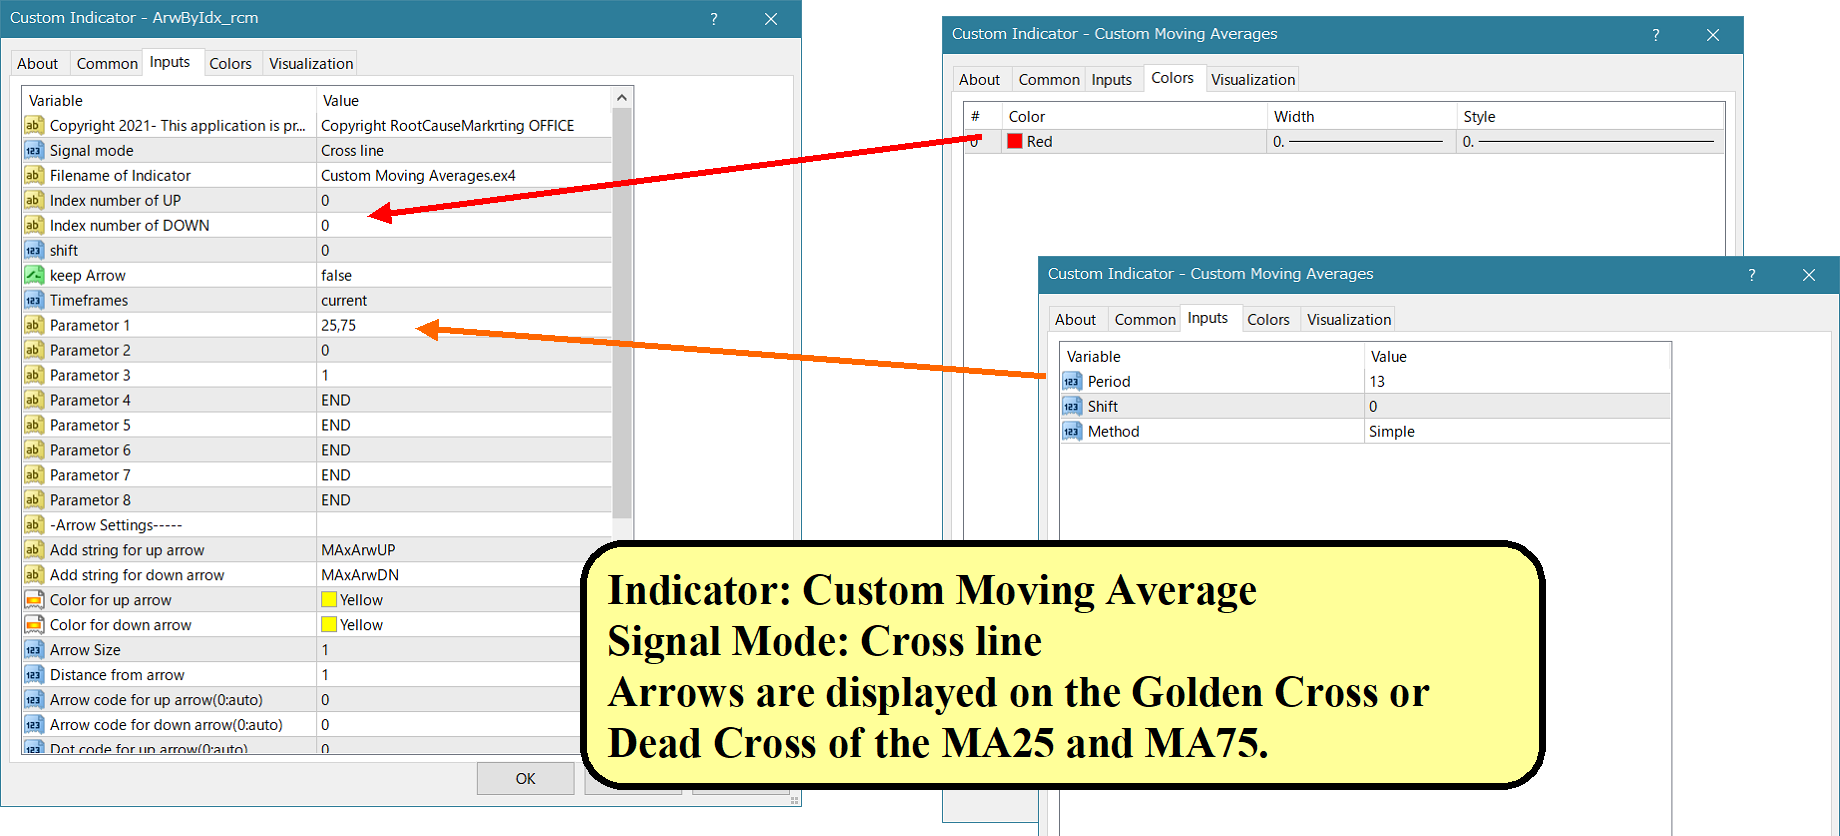
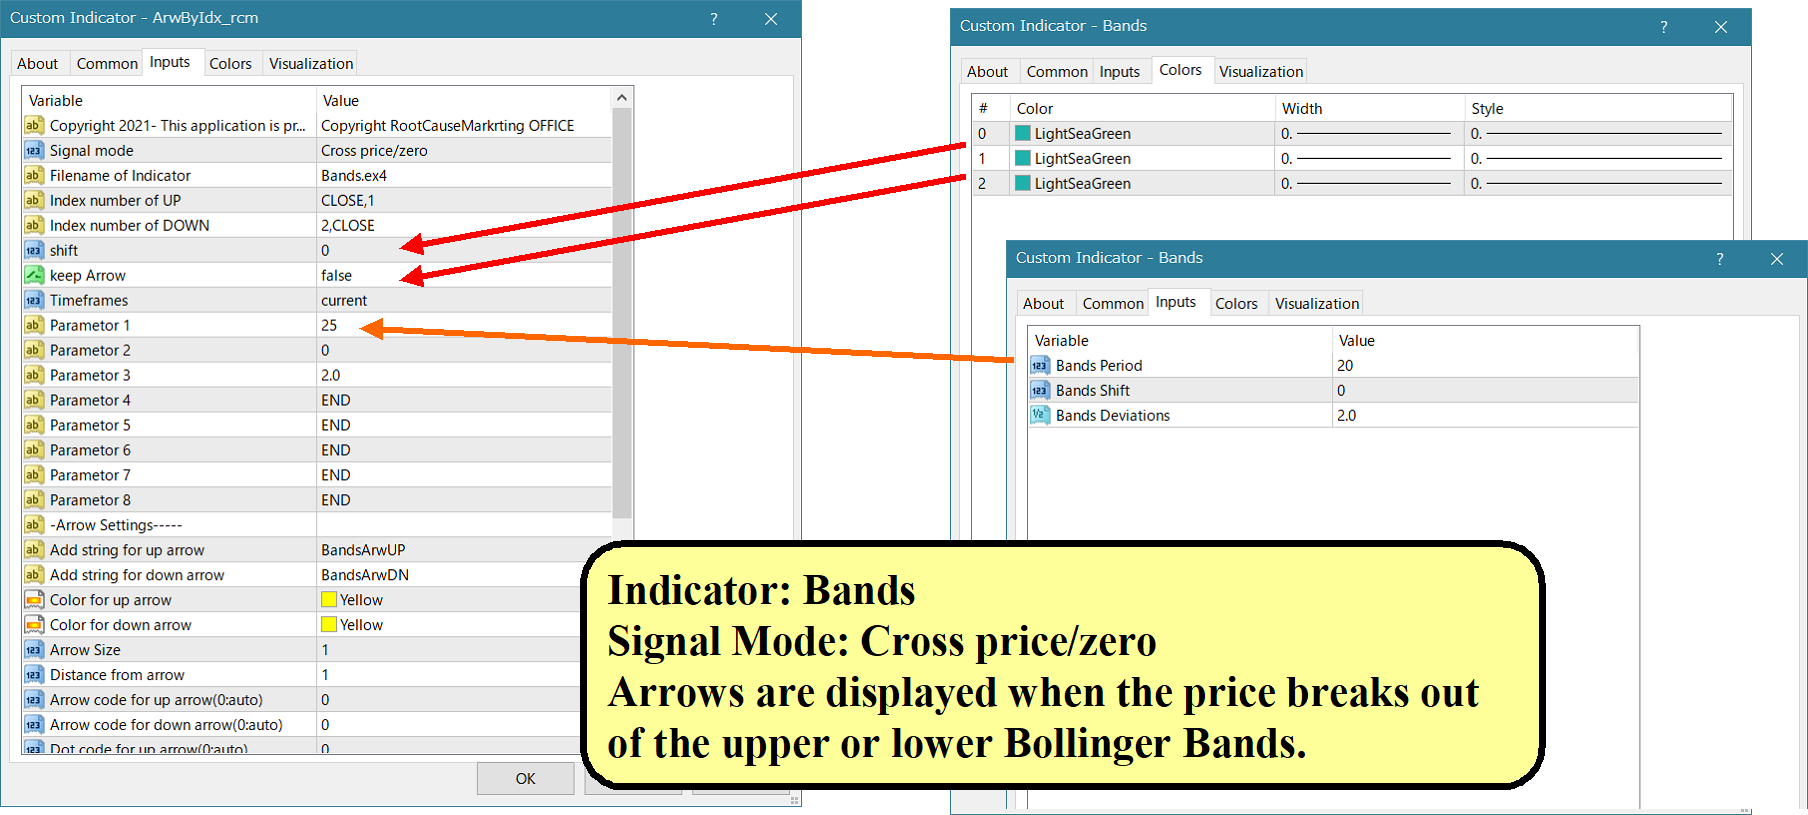
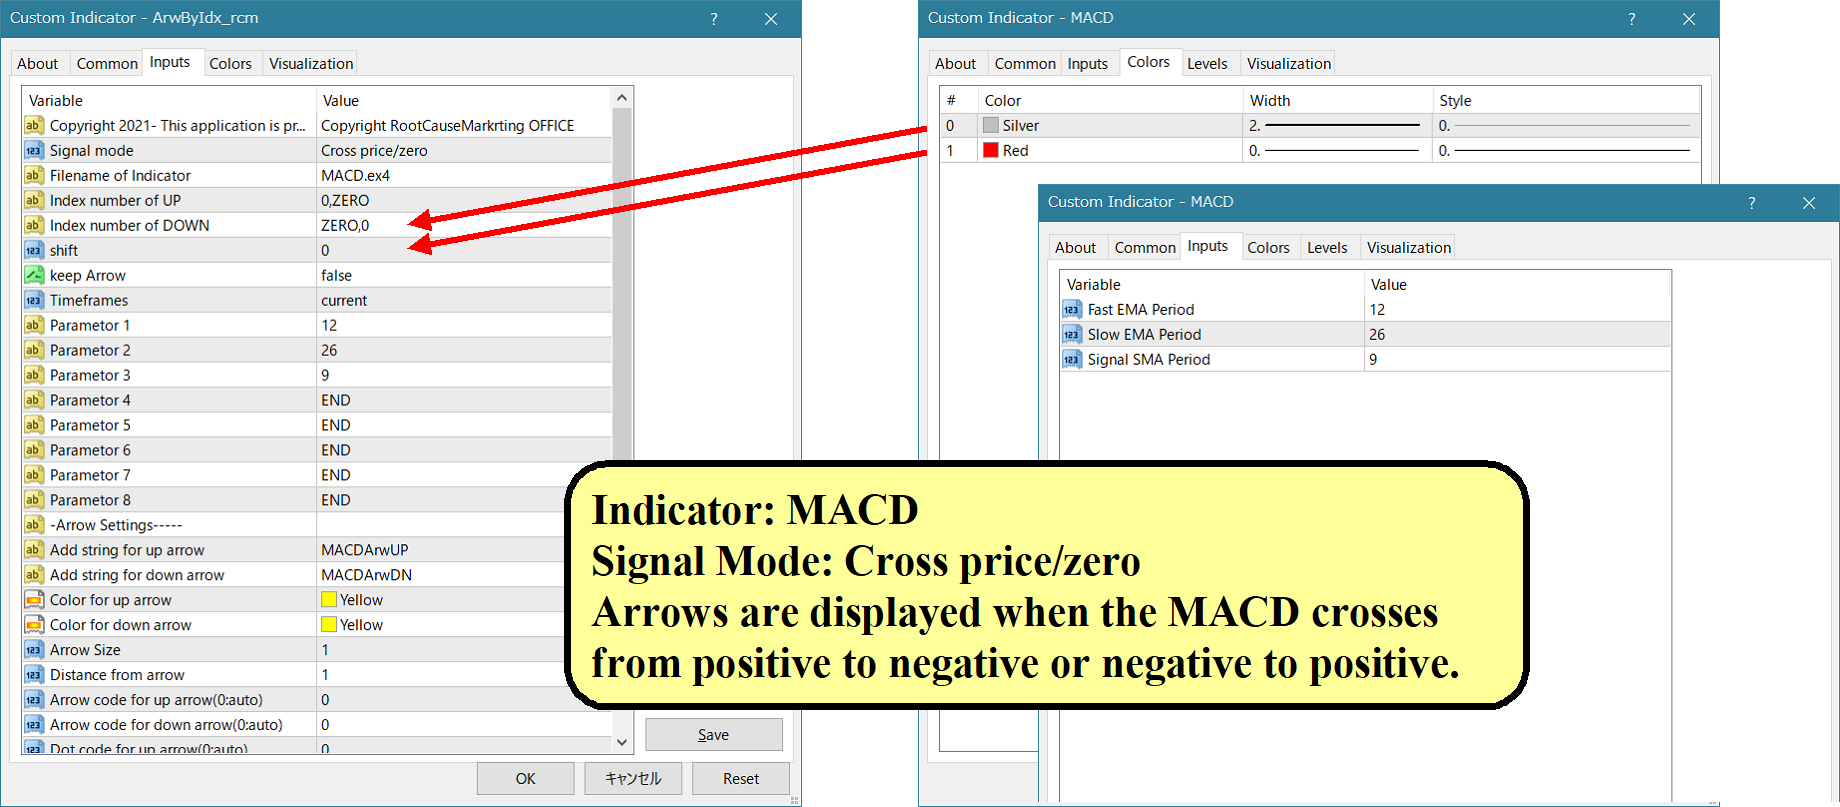
For example, arrows and notifications are shown when MA25 and MA50 cross, when SAR reverses, when MACD changes its plus/minus, or when the closing price crosses the Bollinger Bands.
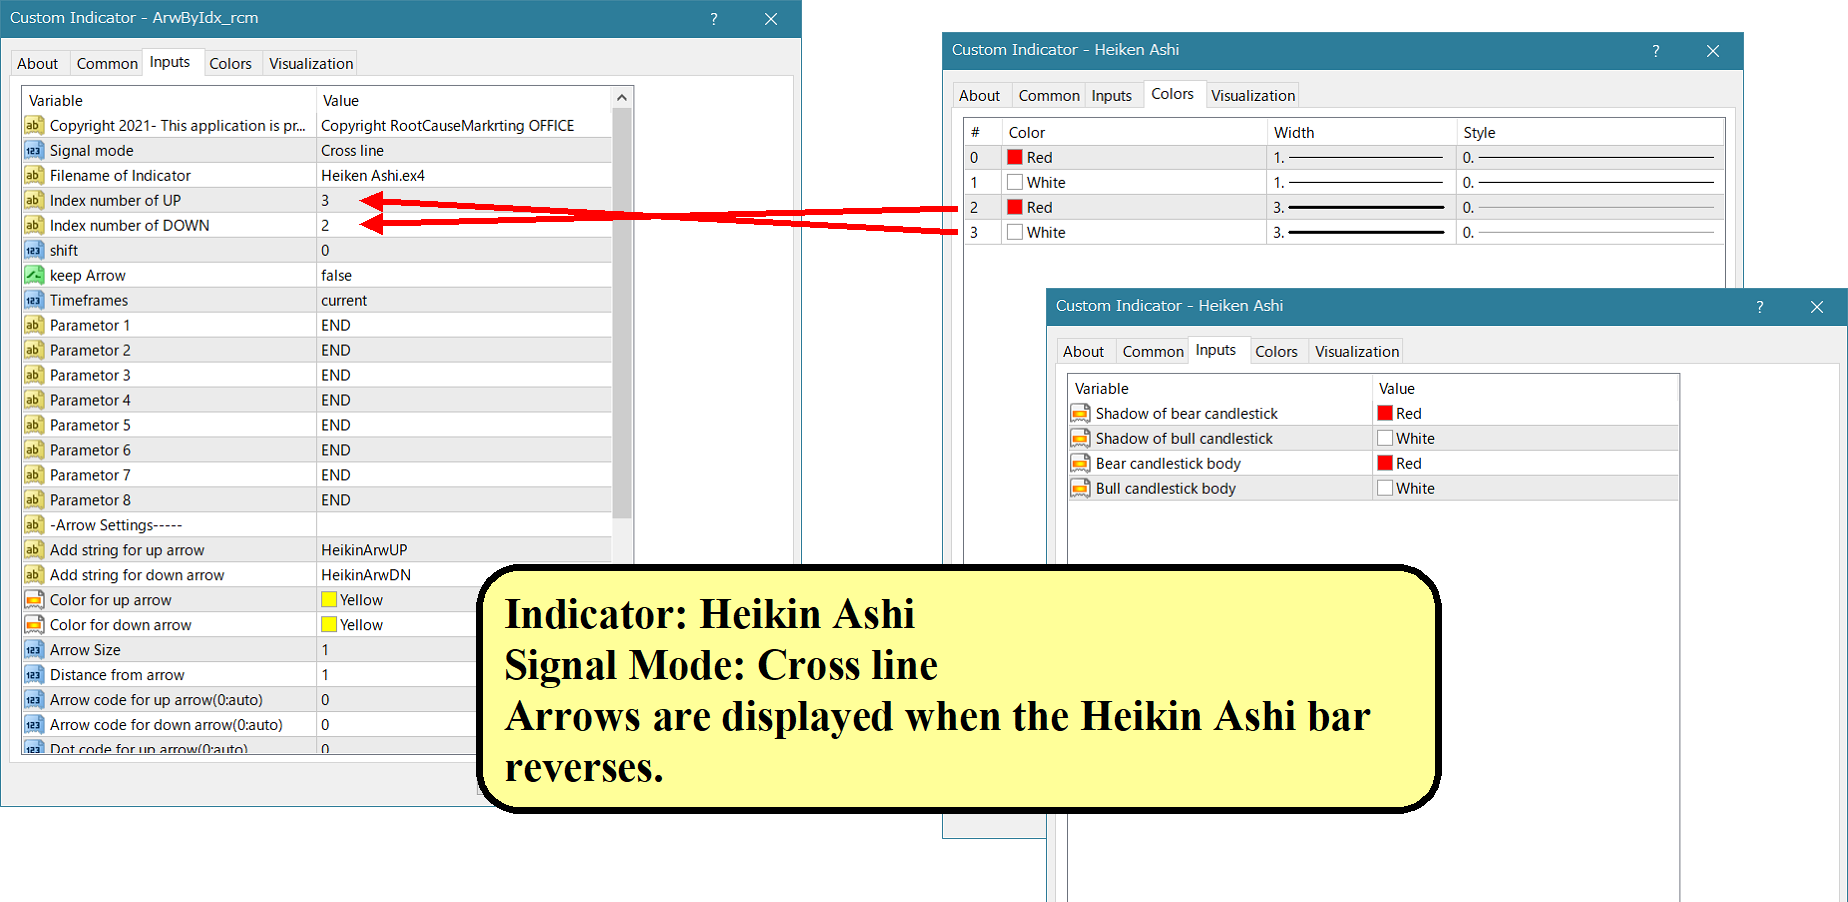
Please refer to the sample settings image for specific configurations.
For detailed manuals and configuration files:
https://www.mql5.com/en/blogs/post/755082
A free version is also available for download.
You can generate signals with various settings like this.
Depending on the idea, I believe there are infinite combinations.
You can also coordinate notifications with signals, such as push notifications to your smartphone or email notifications.
It can be used as an event notification feature in conjunction with your existing signal tools.