FVGs
- Indicators
- Andrii Hurin
- Version: 1.3
- Updated: 24 February 2024
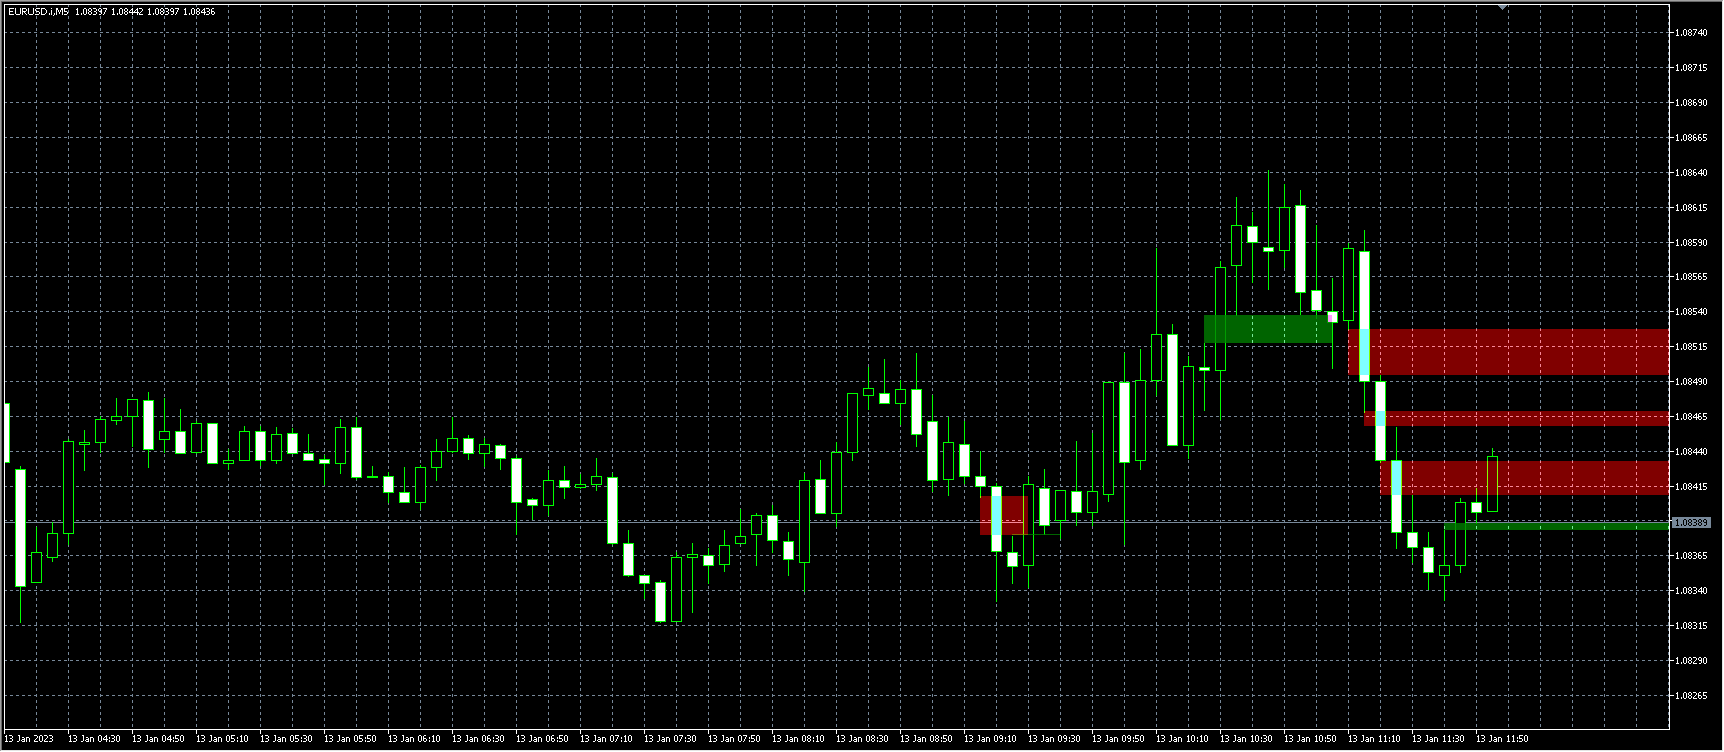
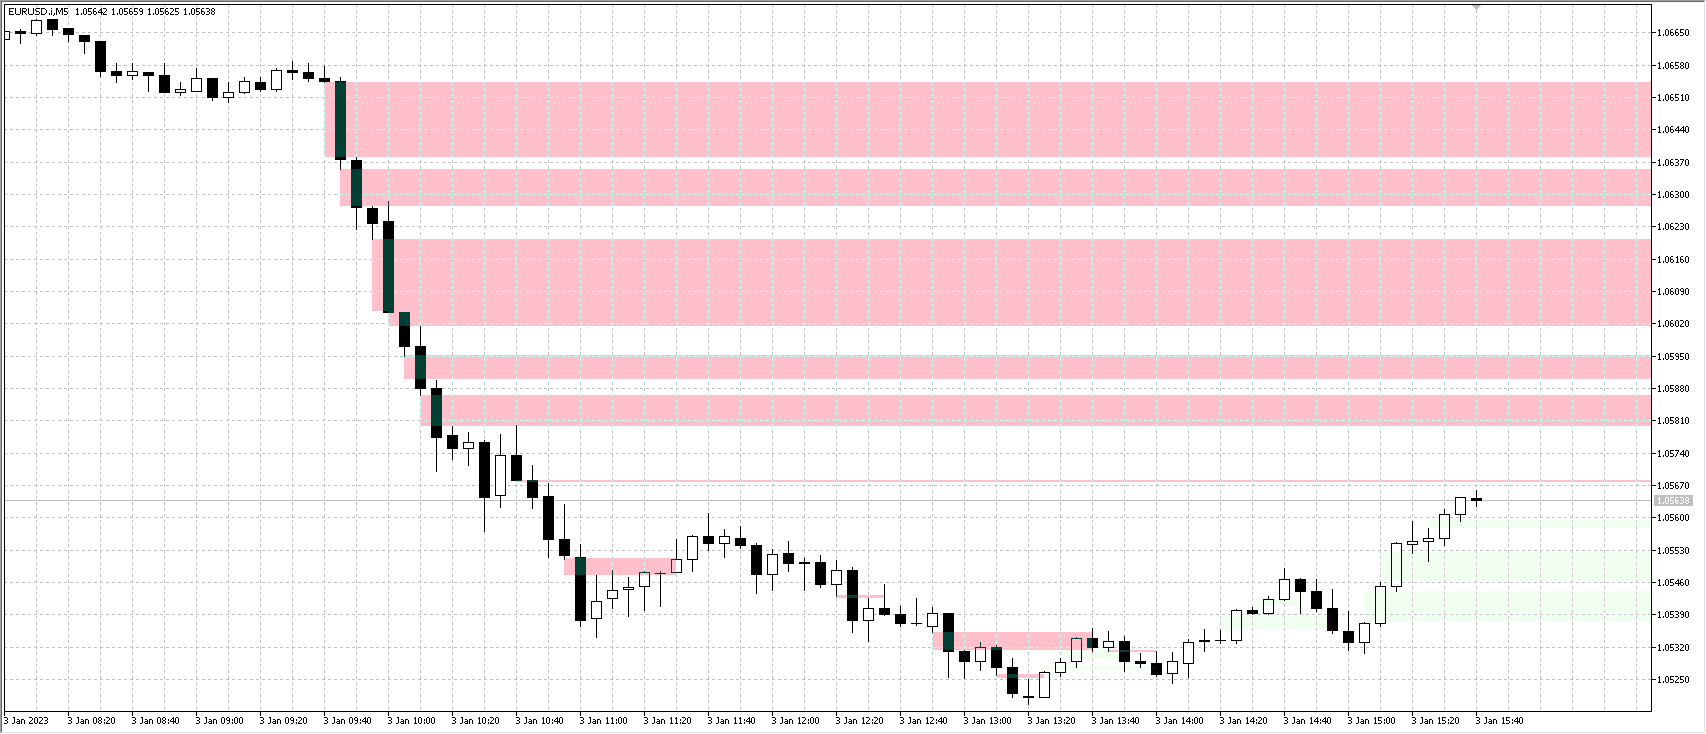
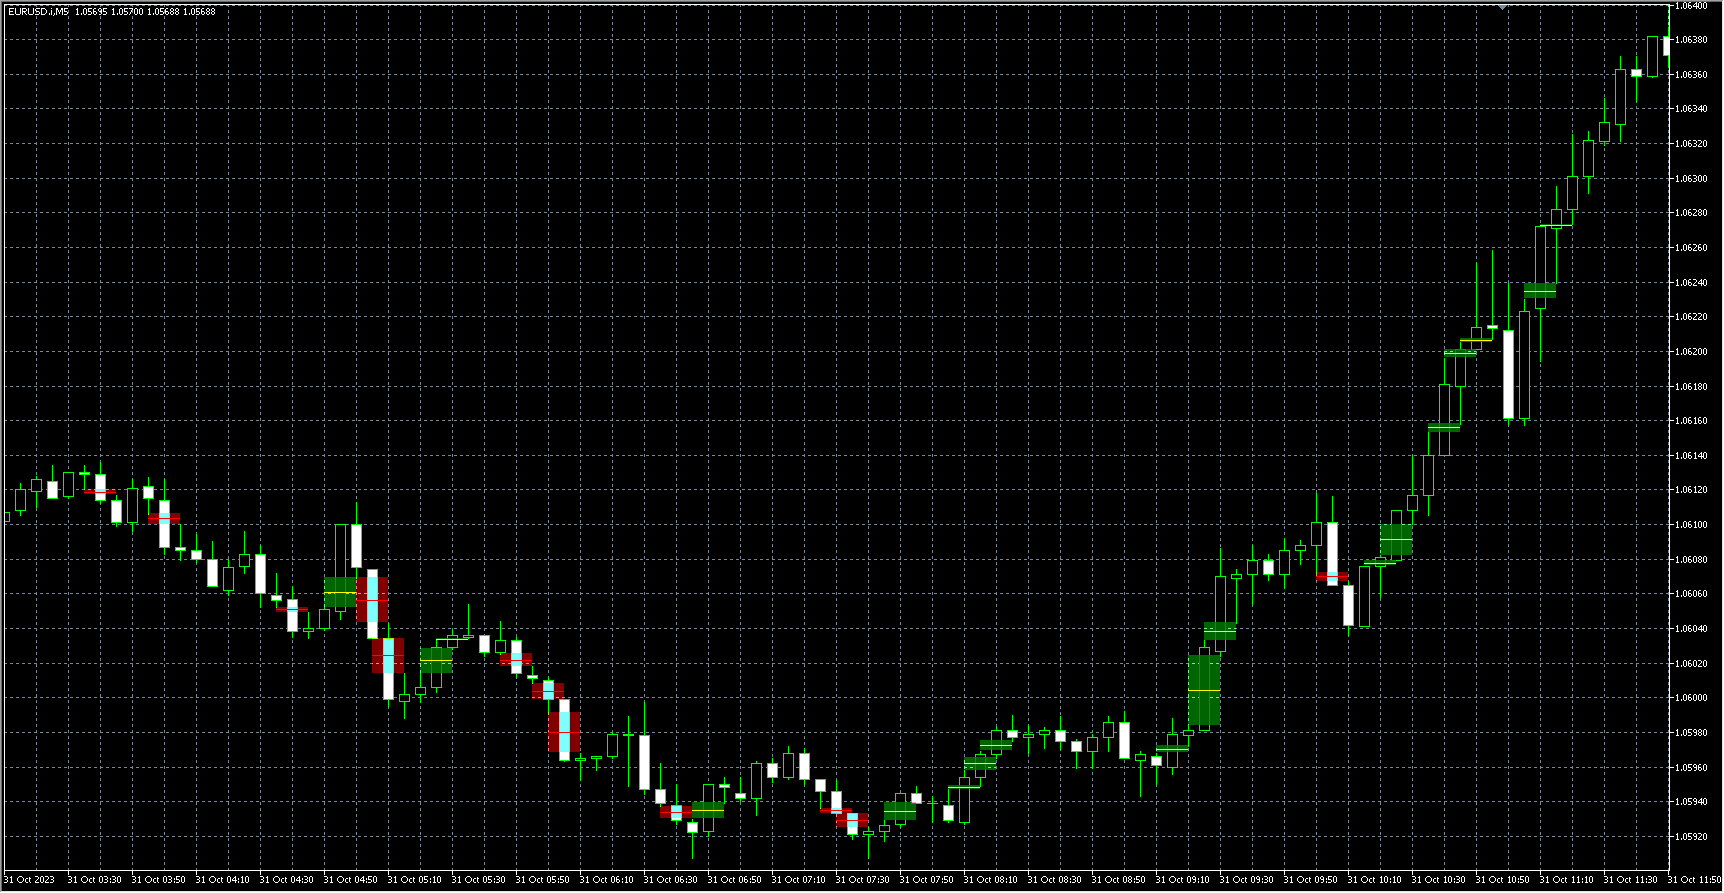
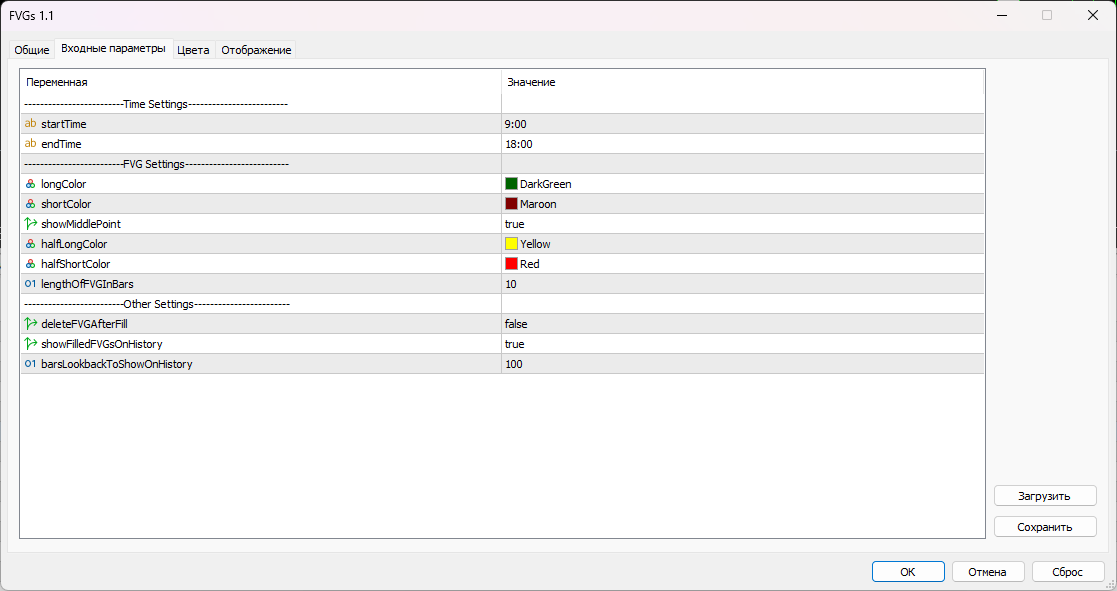
A simple indicator that automatically highlights all FVGs (Fair Value Gaps) formed on the chart, as well as FVGs on history. It is possible to select colors for FVGs of different directions (long or short), select the time interval, select the color of middle point and you can also choose whether to delete filled FVGs or leave them on the chart (the option is beneficial for backtesting).
The indicator can be very useful for those, who trade according to the concept of smart money, ICT, or simply use the FVG pattern in their trading.
MT4 version: CLICK


good