Black Horse indicator
- Indicators
- Shengzu Zhong
- Version: 1.21
- Updated: 18 November 2023
- Activations: 10
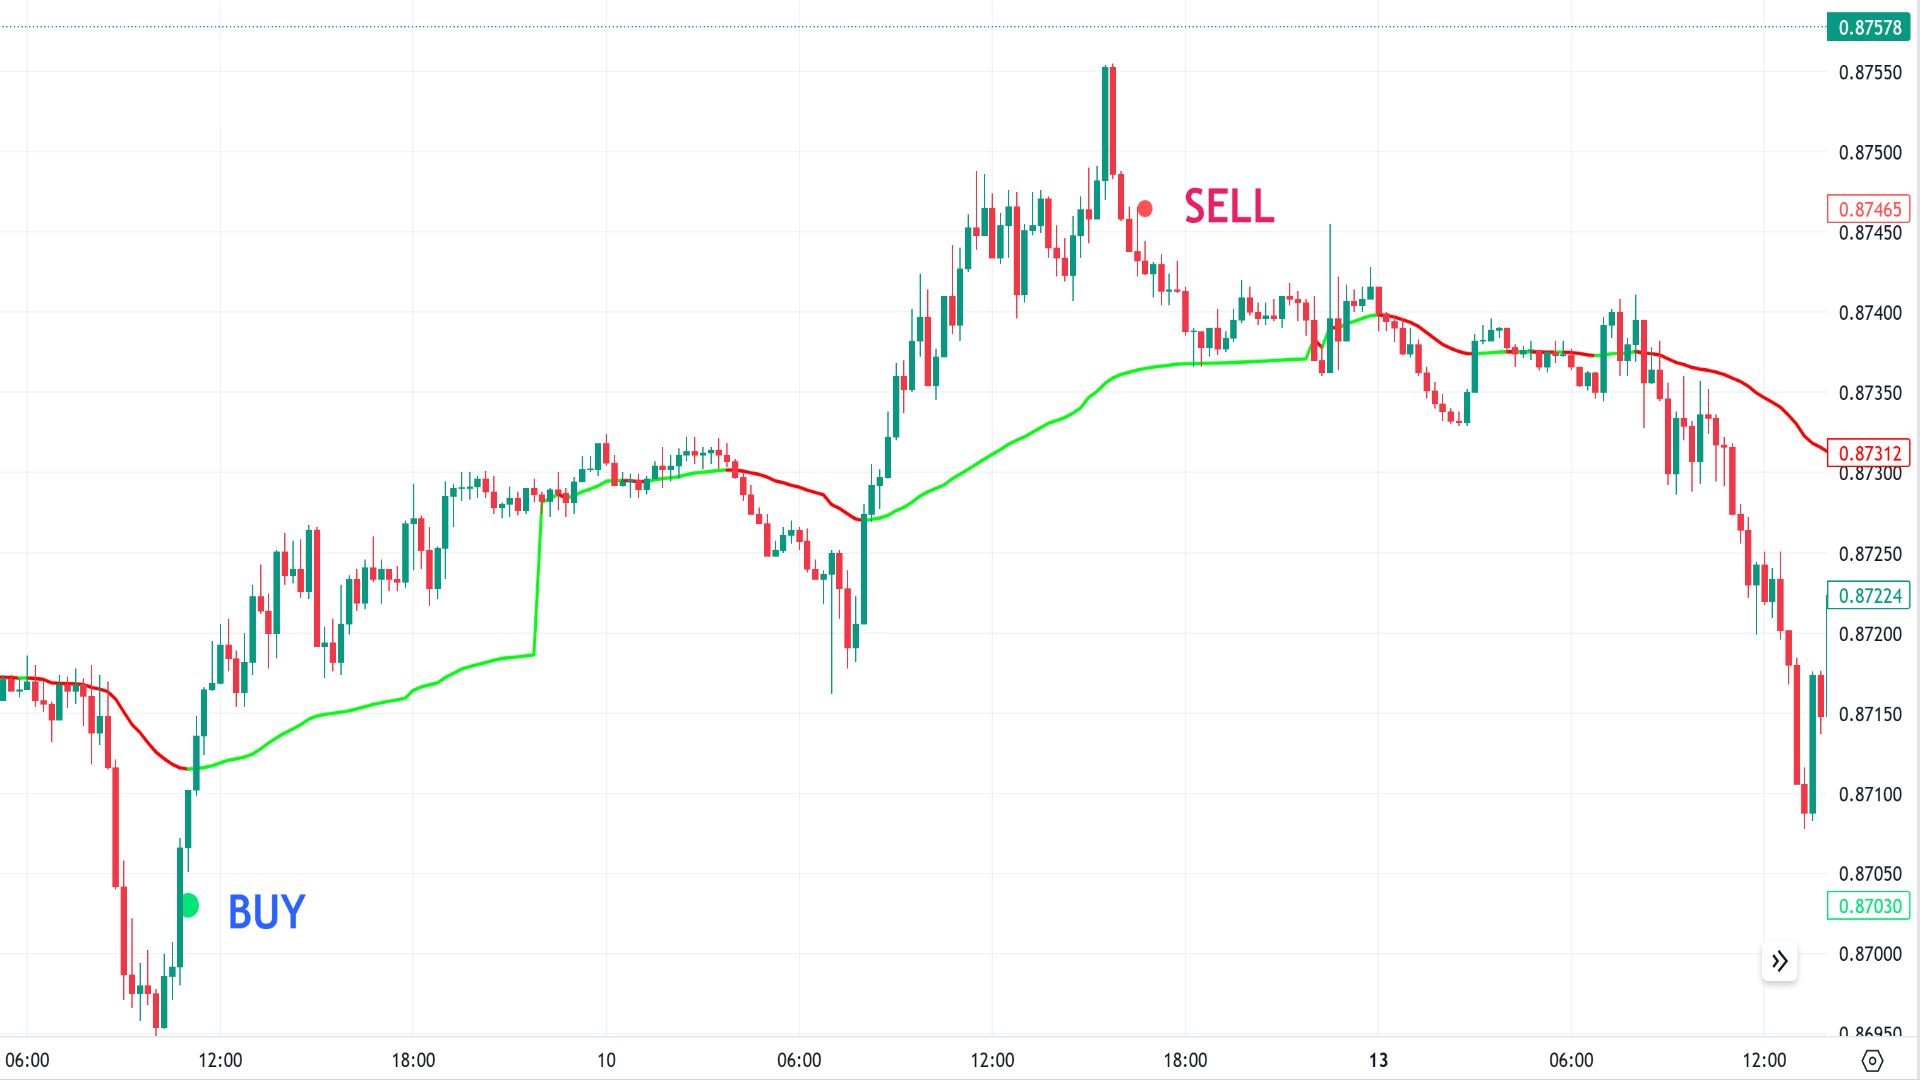
The objective of the black horse indicator is to identify divergences between price action and the VWAP indicator. It employs filters to sift through potential false divergences and signals high-quality, accurate alerts.
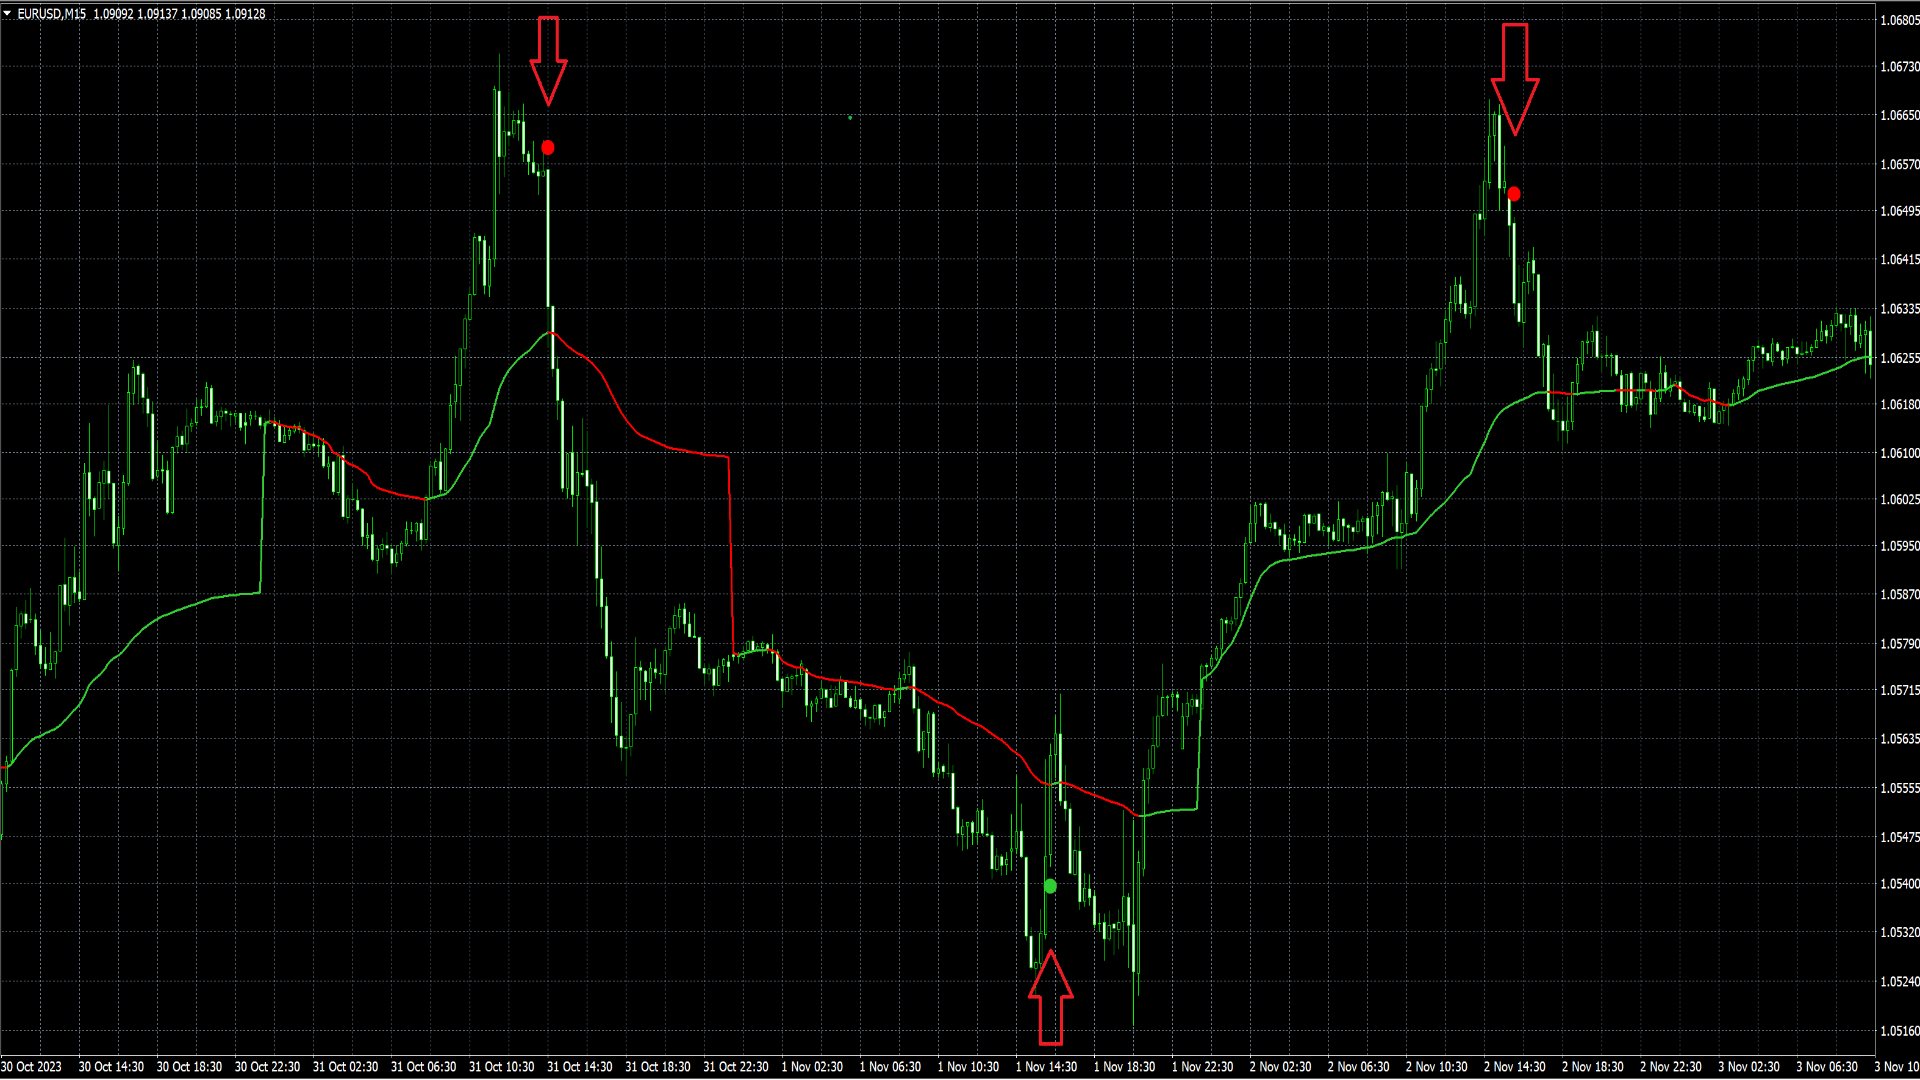
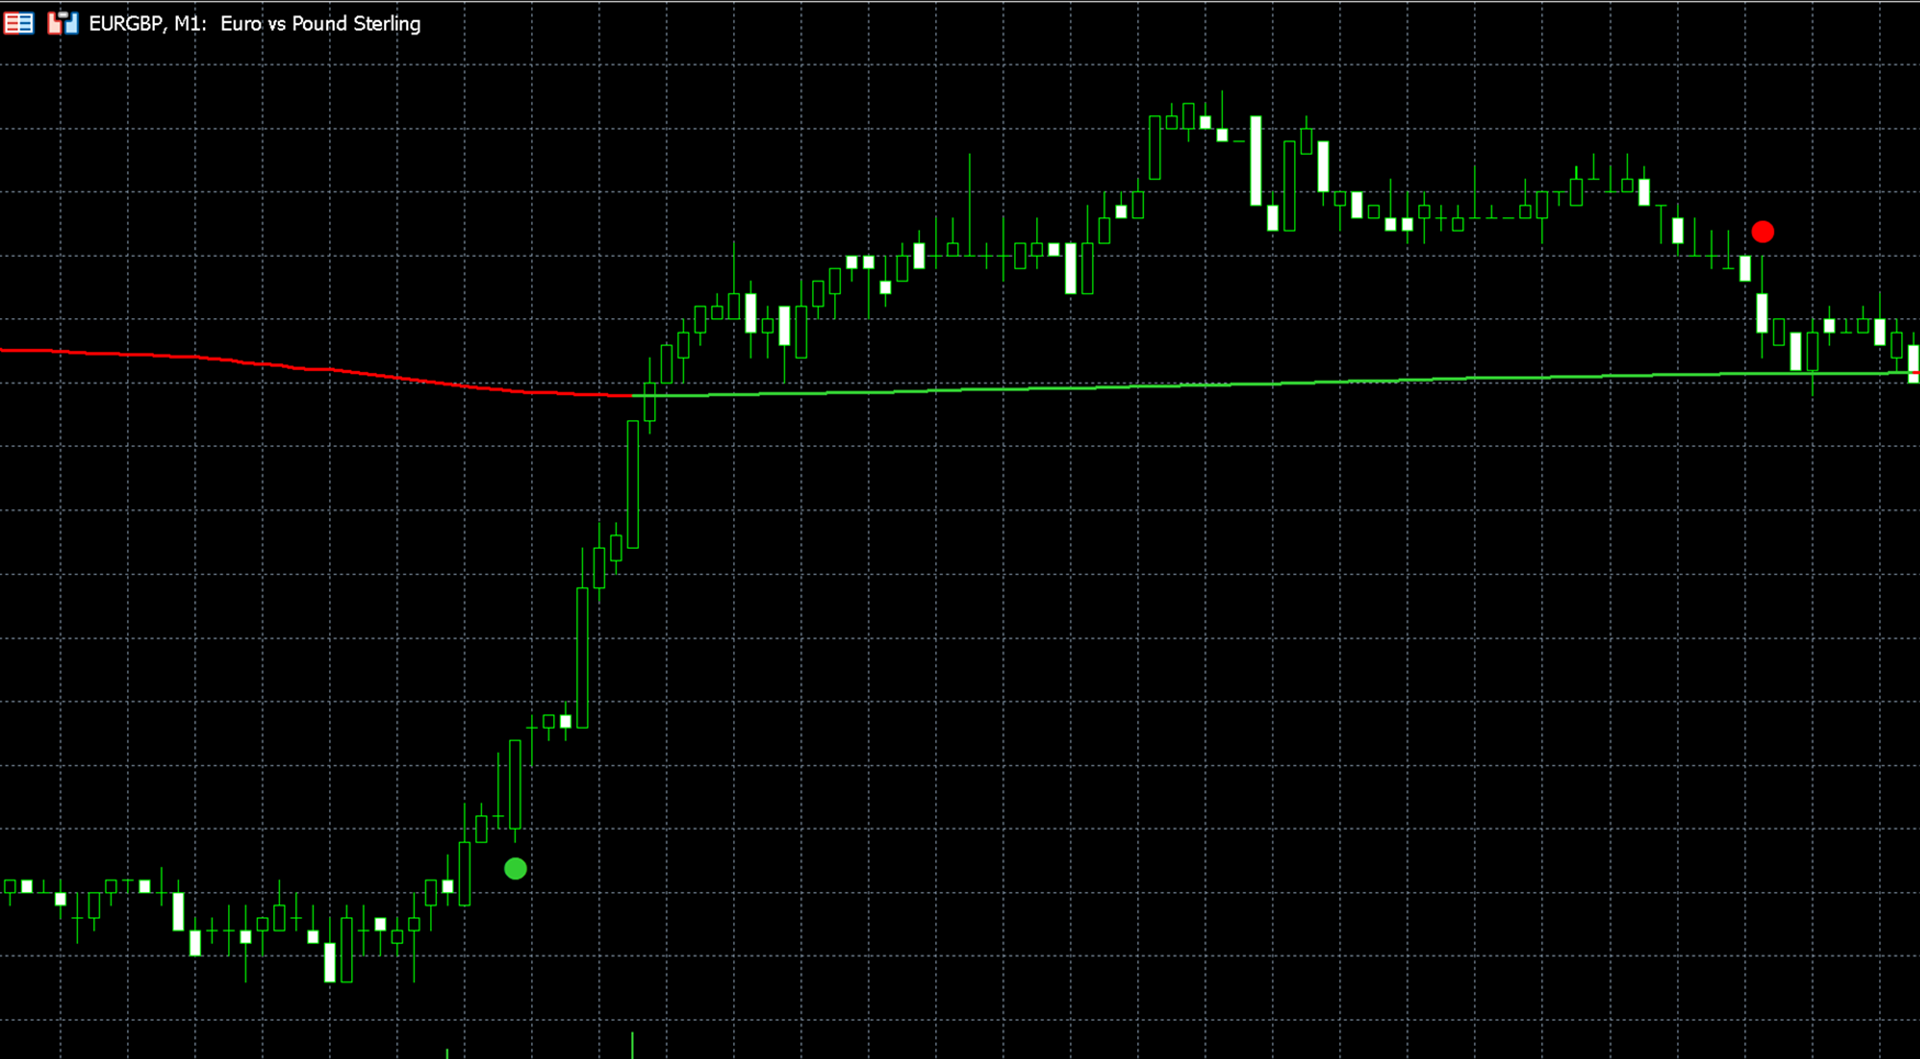
Bearish divergences are denoted by red dots above the candle, while bullish divergences are represented by green dots below the candle.
The primary divergence filter revolves around ATR (Average True Range) and the price movement in the preceding candles within the lookback period. Divergences are identified when the price movement over the lookback period exhibits sufficient sharpness, exceeding the ATR multiplier multiplied by the ATR.
Because of the calculation characteristics, it is advisable to set lower values for the ATR multiplier and lookback period when dealing with higher time frames. On higher time frames, where price movements tend to be more smoothed out, such as the 15-minute chart, sharp price fluctuations occur less frequently and are typically contained within fewer candles compared to lower time frames. Stocks with lower volatility, like HSBC, or BAC, should also employ lower ATR multipliers and shorter lookback periods.
Within the "Visual Settings" section, you have the option to modify the color of the VWAP line, display alternating VWAP colors, adjust the size of the divergence signals, and show or hide the VWAP line.
User didn't leave any comment to the rating