Times
- Indicators
- Ivan Stefanov
- Version: 1.0
- Activations: 5
(Demo of mql5.com doesn't working)
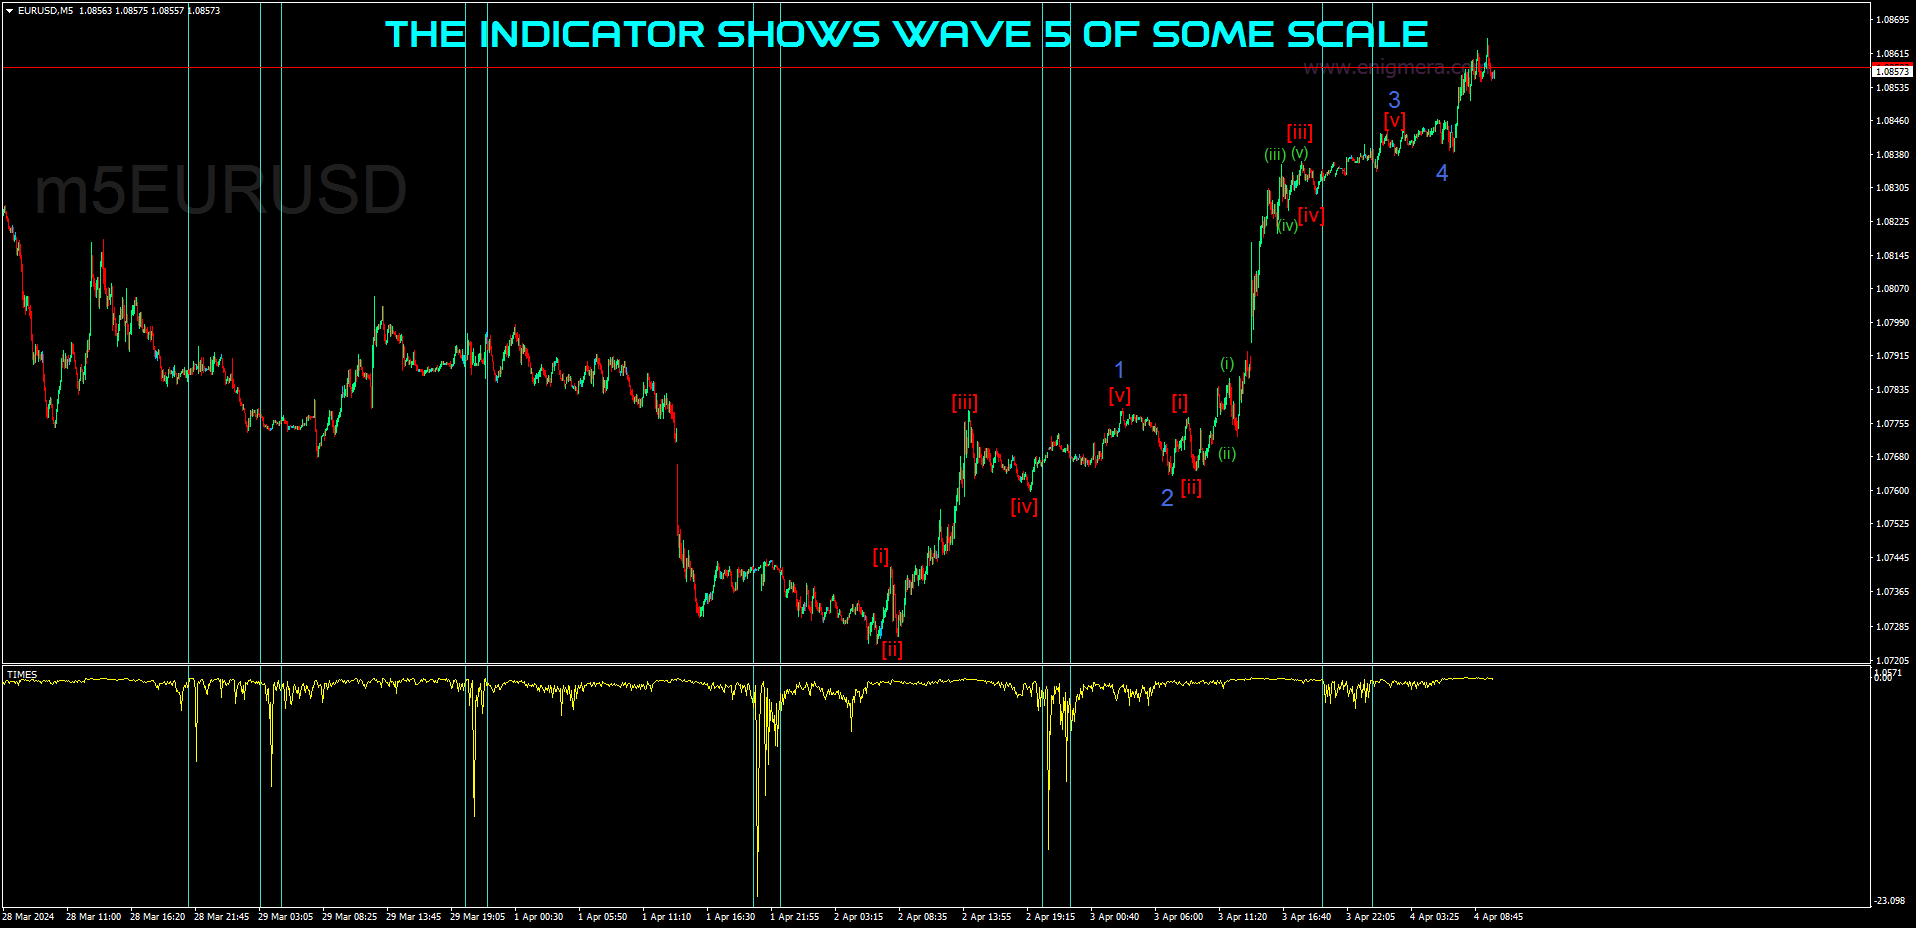
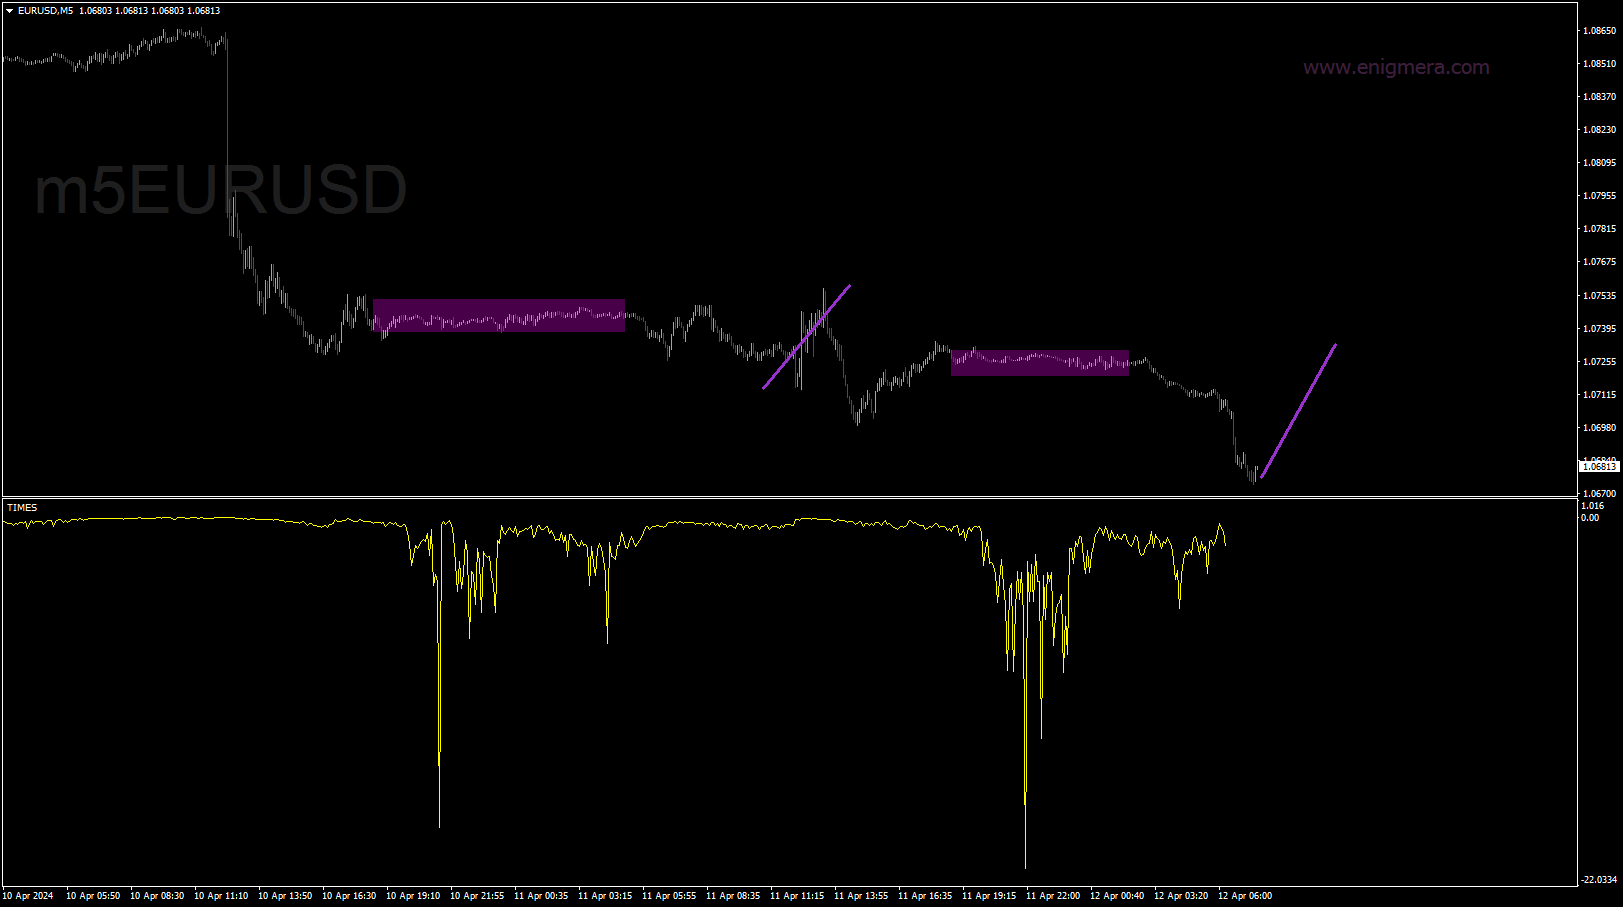
The indicator shows the lowest volatility periods. This is Elliott's wave 5 of some scale. The extreme value of the indicator is the lowest volatility period.
This indicator has the following logic: We know from physics that distance equals velocity multiplied by time. S=V*t If we consider time it will be equal to velocity divided by distance. t=S/V
Speed in forex is tick volume because it is not volume but number of ticks in a certain period of time i.e. it is transaction speed. (I have made such an indicator with its correct interpretation, you can see it) We can define distance as the difference in price from point A to the current point we are at. So in the indicator we set an initial period.
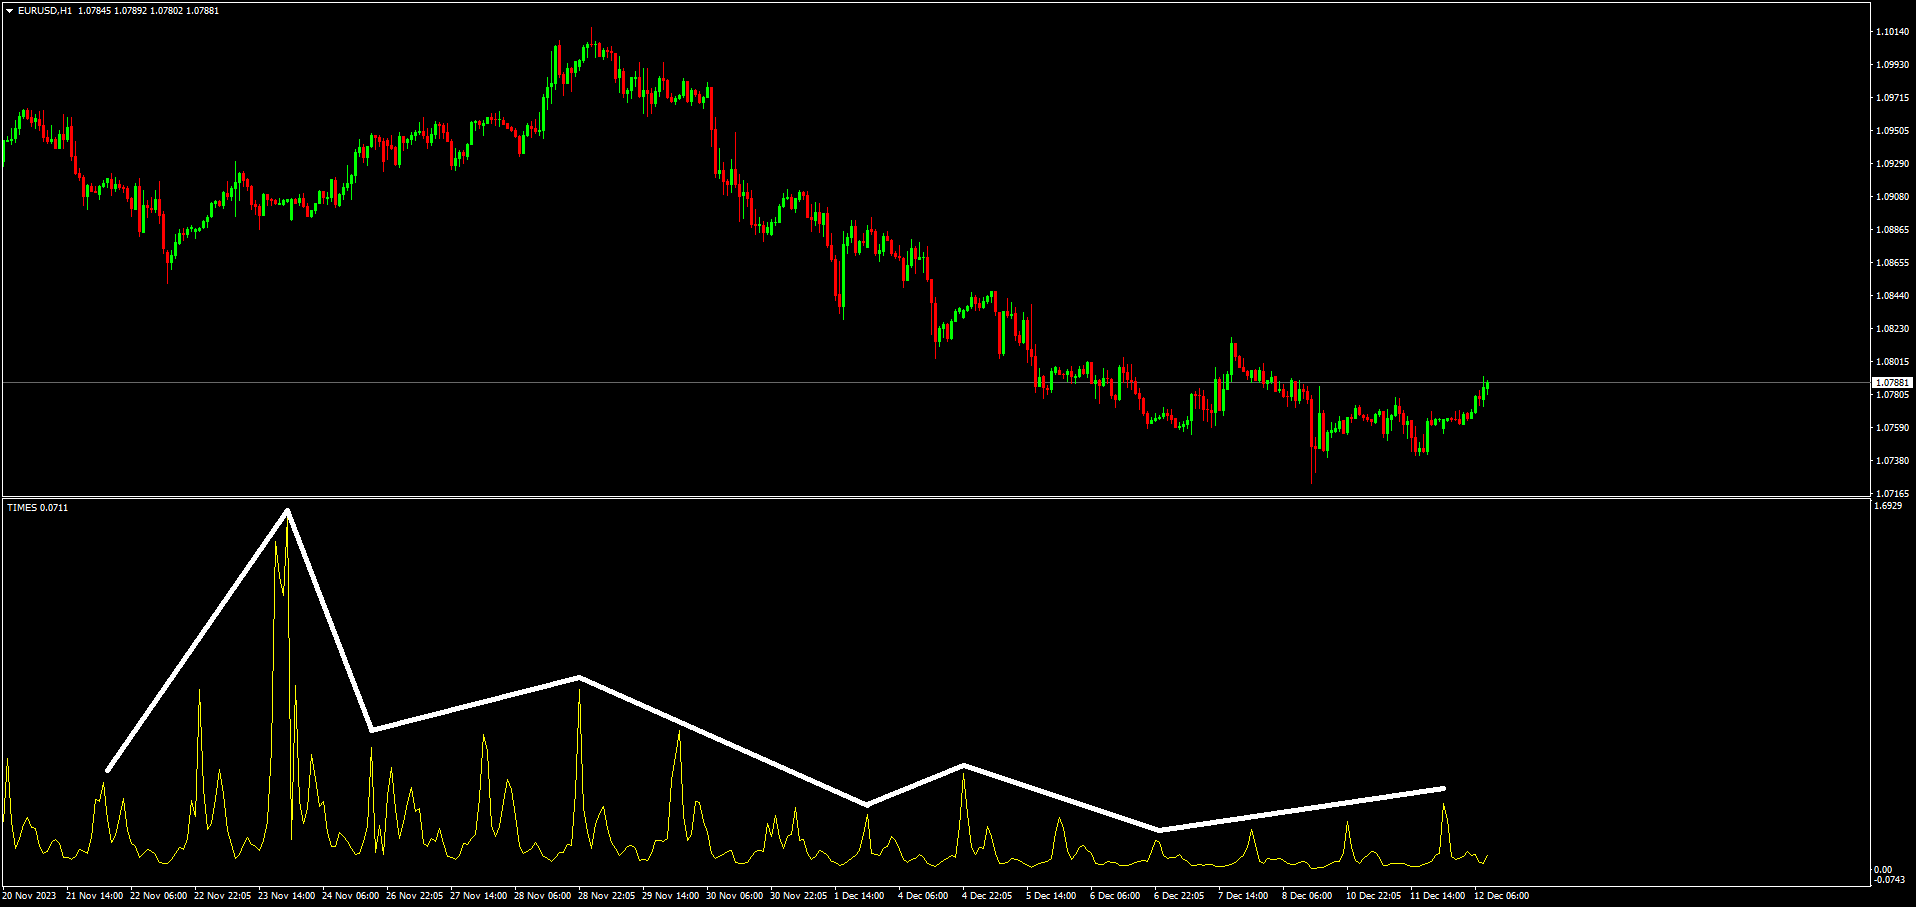
The higher the levels of the indicator, the longer it took for the price to move. Similarly, the opposite is true at lower levels. A bullish trend in the indicator indicates a decrease in activity and a bearish trend an increase in activity. The indicator shows extreme values just before a trend change.