a good indicator to use with combination with other indicators.....
- Overview
- Reviews (4)
- Comments (5)
PipTick Heiken Ashi MT4
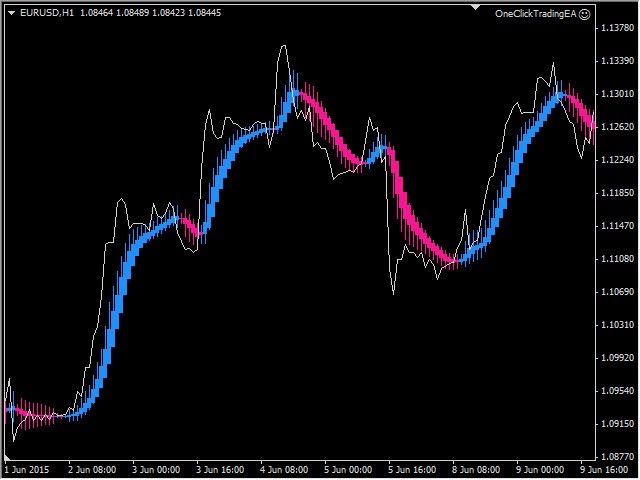
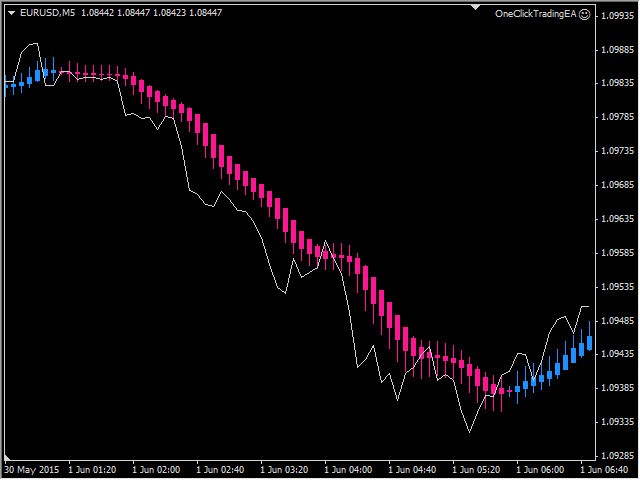
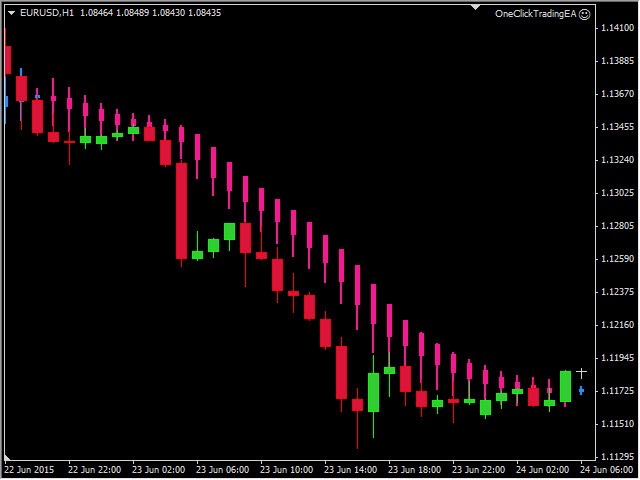
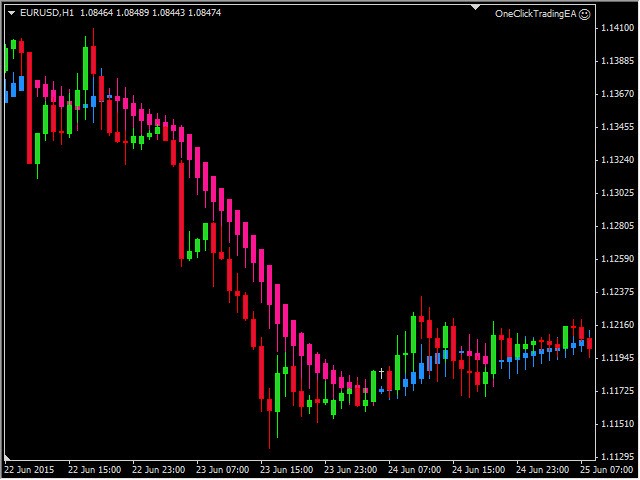
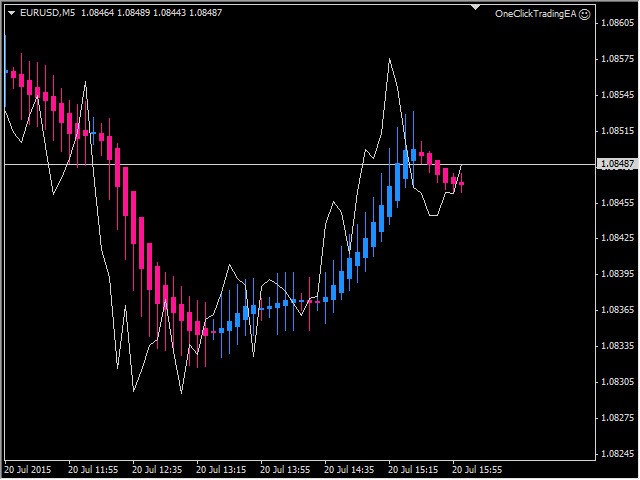
PipTick Heiken Ashi is our version of Heiken Ashi chart indicator. Unlike competitor products, this indicator offers extensive options for calculating of Heiken Ashi candles. It can be displayed as classic or smoothed version.
The indicator can calculate Heiken Ashi with moving average by four methods:
- SMA - Simple Moving Average
- SMMA - Smoothed Moving Average
- EMA - Exponential Moving Average
- LWMA - Linear Weighted Moving Average
Main features
- The indicator shows Heiken Ashi as classic or smoothed version
- Excellent tool for simple assessment of the trend
- Works on every timeframe (M1, M5, M15, M30, H1, H4, D1, W1, MN)
- The indicator is non-repainting
- Ready for backtesting
- Customizable parameters (Colors, MA periods...)
- Very fast calculation
- Available for MT4 and MT5
Input parameters
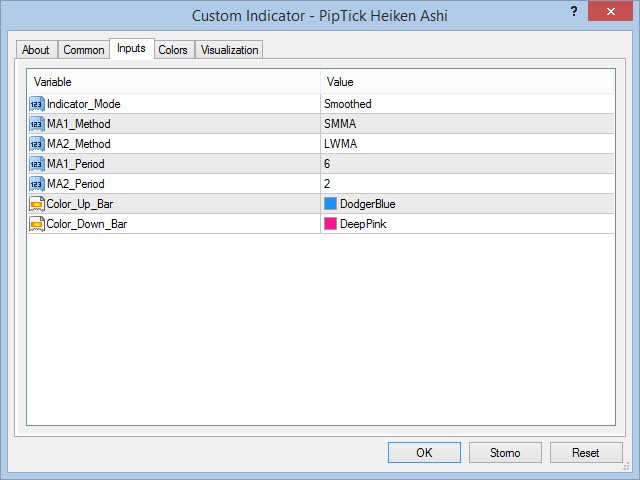
- Indicator_Mode - Allows to choose between Classic and Smoothed version of indicator
- MA1_Method - Allows to choose between SMA, SMMA, LWMA and EMA calculationof Heiken Ashi
- MA2_Method - Allows to choose between SMA, SMMA, LWMA and EMA calculation of smoothing
- MA1_Period - Period of MA calculation of Heiken Ashi
- MA2_Period - Period of MA calculation of smoothing
- Color_Up_Bar - Color of up bar of Heiken Ashi
- Color_Down_Bar - Color of down bar of Heiken Ashi
Outputs parameters
- PipTick HA Low/High - Displays low values for up bar and high values for down bar
- PipTick HA High/Low - Displays high values for up bar and low values for down bar
- PipTick HA Open - Displays open values of HA bar
- PipTick HA Close - Displays close values of HA bar
- PipTick HA Direction - Displays type of HA bar. Number 0 means up bar, 1 means down bar
For more information, visit the PipTick Heiken Ashi product page.
Video
Reviews 4
Recommended products

Universal Heiken Ashi
FREE
Nikolay Churbanov
Universal Heiken Ashi is an indicator that calculates Heiken Ashi candles with different smoothing methods.
Indicator settings Profile - predefined profile: FHA - Fast Heiken Ashi. HA - Standard Heiken Ashi. SHA - Slow Heiken Ashi. Custom - Custom settings. MAType - first smoothing Moving Average type. MAPeriod - period of first Moving Average. UseSecondMovingAverage - using of second Moving Average for smoothing. MAType2 - second Moving Average. MAPeriod2 - period of second Moving Average.

PipTick VWATR MT4
FREE
Michal Jurnik
PipTick VWATR indicator is a helpful tool for measuring of activity of the market. It is based on the idea of the Volume-Weighted ATR. The combination of these two elements helps to identify potential turning points or breakout opportunities. The indicator for the classification of the activity of the market uses moving average and its multiples. Accordingly, where the VWATR bar is located (relative to the moving average), it is labeled as ultra low, low, average, high, very high or ultra high.

Renko Bars 3in1 DEMO
FREE
Yuriy Shatsckiy
The Renko_Bars_3in1_DEMO is designed for plotting 3 types of Offline Renko charts. Standard Renko Bar (the reversal bar is twice the size of the bar). Renko Range Bar (the size of all bars is the same). Renko Bars with the ability to adjust the size of the reversal bar. Note . Renko_Bars_3in1_DEMO is a demo version of Renko_Bars_3in1 indicator. Works only on Demo accounts. A chart with the M1 period is necessary to build an offline chart. When the indicator is attached to a chart, the offline ch

DEMOHistoDiff
FREE
Damian Mateusz Dziadosz
The next indicator is an histogram that compares the difference between highest high of x bars and moving average of same bars compared with the difference between lowest low of same number of bars and moving average also of the same number of bars (that means that if the difference between highest high and moving average is higher than difference between lowest low and moving average the indicator will draw values higher than 0). It has the next inputs: maperiods: Number of bars to calculate th

Trend Magic Indicator free
FREE
Heiko Kendziorra
The Trend Magic Indicator shows the direction of a trend and indicates when it changes. Blue dots in the chart indicate an uptrend, red dots indicate a downtrend. The indicator is the trigger for the Trend Magic Expert .
Input Parameters Counter : number of bars used for calculation PowerSet : shows how near to the bars the trigger dots are placed DotSize : size of the shown dots The colors of the dots can be changed.
Difference from the paid version This is a free version, it works in every

Heiken Ashi Smoothed Alert
FREE
Jan Flodin
This indicator can send alerts when a Heiken Ashi Smoothed color change occurs. Features Can send all types of alerts. Option to delay the alert one bar in order to confirm the color (trend) change. Parameters Wait for candle close: 'true' or 'false'. Setting it to 'true' will delay the alert to the opening of the bar following the bar where the color change occurred. MA method: Default is Smoothed (SMMA). MA period: Default is 4. MA 2 method : Default is Linear Weighted (LWMA). MA 2 period: Def

Heiken Ashi Candles indicator
FREE
DMITRII GRIDASOV
Forex Indicator: Heiken Ashi Candles for MT4. No Repaint.
Heiken_Ashi_Candles has great combination with Trend Line indicator - another my product - test it now . Indicator Heiken_Ashi_Candles is very useful auxiliary indicator to make trend more visible. It's useful for making candlestick charts more readable and trends easier to analyze. Most profits are generated when markets are trending, so predicting trends correctly is necessary. The Heikin-Ashi chart is constructed like a regu

MTF Heiken Ashi MA
FREE
Brian Lillard
MTF Heiken Ashi MA is a multiple timeframe Heiken Ashi & Moving Average indicator. Fully customizable for advanced & unique Heiken Ashi & Moving Average calculations.
Key Features This indicator has three historical bar price inputs of Close, High and Low. Multiple timeframe making it a great tool for trend and confirmations. No repaint is possible making it a great tool for scalping strategies. Tails are not shown in this evaluation of the traditional calculation.
Inputs MA Period(# of Peri

EURUSD best levels
100 USD Zbynek Liska
The best levels for the most traded pair eurusd Constant overview of where the market reacts, no redrawing. Bonus : Calculator for the recommended volume for all situations. Bonus : Calculate the swap field number of days. Bonus : the value of the annual Fibonacci. Bonus : Number of waves of the month and year. Bonus : Calculator of your own value and subsequent calculation of the price range

Time of Renko Bar
FREE
Jad Eid
This "Time of Renko Bar" indicator can be utilized by traders using Renko bars. The indicator will record the time taken for each box to be formed (in seconds) and display those values in a separate indicator window. Some traders use the time of a Renko bar to assess momentum. This means that if a box is taking more time to form, it could mean that the trend is weakening.

BoxInside MT4
FREE
Evgeny Shevtsov
This indicator calculates the volume profile and places labels that correspond to the VAH, VAL and POC levels, for each candle individually.
Indicator operation features The indicator works on the timeframes from M5 to MN, but it uses the history data of smaller periods: M1 - for periods from M5 to H1, M5 - for the H4 period, M30 - for the D1 period, H4 - for the W1 period, D1 - for the MN period. The color and location of the VAL, VAH and POC labels on the current candle are considered to be

Acceleration Fractals 4Free
FREE
Vladimir Tkach
The indicator analyzes the change in the minimum and maximum prices of the previous bars fixing the entrance of the big players. If the change (delta) increases, a signal is displayed on the graph in the form of an arrow. At the same time, virtual trade on history is carried out. In the free version, virtual trade is performed without refills in case of a repeat of the signal. The results of virtual trading in the form of losses / losses, profitability, drawdown and transaction lines are display

Renko One ReversBar Demo
FREE
Yuriy Shatsckiy
The Renko_One_ReversBar_Demo is a Demo version of the Renko_One_ReversBar indicator. The main feature is that only one Reversal Bar is drawn. As in the indicator Renko_Bars_3in1 , you can independently adjust the size of the reversal bar. Works only on Demo accounts. Important. To build an offline chart, you need a chart with a period of M1. When you launch the indicator on the chart, the offline chart opens automatically. When closing the terminal, also close the offline chart, because the nex

AMD Exclusive Two Separate Window Free
FREE
Szymon Palczynski
With this AMD Exclusive Two Separate Window Free indicator, you will be able to spot, predict, trade and profit from strong trends of markets
This is not a simple indicator, it is a ready to use trade system.
AMD Exclusive Two Separate Window Free works only on USDCAD currency pair. The full version of the product has no limitations.
Full version: https://www.mql5.com/en/market/product/33589
What we have? Automatic optimization Overbalance (manual, semi-automatic and automatic) Fibonacci P

Grid levels
FREE
Alexandr Kolesov
The indicator draws a grid of "Horizontal line" graphical objects.
All grid values are changed when moving the main line. Recommendations Use the indicator for displaying rounded prices that are multiple of 1 000 or 500 (points*). Example: EURUSD 1.25000, 1.26000, 1.27000 EURUSD 1.25500, 1.26500, 1.27500 Distance parameter For currency pairs – 1 000 (1 000 points*) For stocks – 100 ($1) Disable grid display for higher timeframes. Grid display can be set in the main line settings of Display tab

PipTick Session MT4
FREE
Michal Jurnik
PipTick Session is a very simple indicator that helps to highlight a specific trading session. For example, it can be used for differentiation of the European, American or Asian session.
Main features The indicator shows a user-defined trading session Alert notifications for start and end of session Custom session time Works on every timeframe (M1, M5, M15, M30, H1, H4, D1, W1 and MN) Customizable parameters (Colors, Alert...) Can be used for creating EA Available for MetaTrader 4 and MetaTrad

SWitch ABF
FREE
Sergey Vedmanov
The indicator saves your time allowing you to apply three indicators to the chart at once. Each indicator has its own settings. Bollinger Bands. Alligator. Fractals.

Trading Vol Index
FREE
Peter Eskander
Trading Vol Index shows the volume of Buying and Selling trades on the current bar or on average of specific number of last bars as you want . Both volumes are shown simultaneously with green index and red index colors for Buying and Selling trading volumes respectively. Notice : This indicator Works on any timeframe and any pair of currencies It is the same like Trading Volume Indicator . It has the same idea and calculations, but the difference is the presentation as it is shown in screenshots

Heiken Ashi Trade System2
FREE
Chaiya Srisawat
The robot is a simple and flexible trading system. It uses Heiken-Ashi candlesticks as a design basis. The robot consists of two parts: 1) sending orders, 2) exiting orders. The details are as follows. Sending orders: The robot uses Heiken-Ashi candlesticks to enter buy/sell orders. If you specify a fixed stop loss level, each order is sent with a fixed stop loss level. Exiting orders: The robot has three exiting choices as follows: Meet its target: a user sets the target level when marketing pr

Cumulative Delta MT4
FREE
Evgeny Shevtsov
The indicator analyzes the volume scale and splits it into two components - seller volumes and buyer volumes, and also calculates the delta and cumulative delta. The indicator does not flicker or redraw, its calculation and plotting are performed fairly quickly, while using the data from the smaller (relative to the current) periods. The indicator operation modes can be switched using the Mode input variable: Buy - display only the buyer volumes. Sell - display only the seller volumes. BuySell -

Magneto Precision Trend Free
FREE
Vladimir Blednov
The Magneto Precision Trend Free indicator is based on candlestick analysis. It determines the trend change on the previous candle, signal is not redrawn. This version of the indicator works only on AUDUSD. To purchase the full-featured version, see Magneto Precision Trend .
Indicator setup and use Increasing the Period parameter decreases the indicator sensitivity, resulting in less frequent changes in color but filtering the market noise. However, the trend change signals will arrive visuall

TrendPlus
FREE
Sivakumar Subbaiya
Trend Plus
Trendplus Indicator Time Frame: Suitable for any time frame. Purpose: Trend Prediction. Blue and red candle indicate the buy and sell call respectively. Buy: When the blue candle is formed buy call is initiated. close the buy trades when the next red candle will formed. Sell: When the Red candle is formed Sell call is initiated. close the Sell trades when the next blue candle will formed. Happy trade!!
Subscribe our trading signal
https://www.mql5.com/en/signals/952330

New Bar Alarm Free
FREE
Tomoyuki Nakazima
This indicator alerts you when/before new 1 or 5 minute bar candle formed. In other words,this indicator alerts you every 1/5 minutes. This indicator is especially useful for traders who trade when new bars formed.
*This indicator don't work propery in strategy tester.Use this in live trading to check functionality.
There is more powerful Pro version .In Pro version,you can choose more timeframe and so on.
Input Parameters Alert_Or_Sound =Sound ----- Choose alert or sound or both to not

Fine Trade AM
50 USD Andriy Matviyevs'kyy
The indicator is intuitive and easy to use. The indicator analyzes the ratio of the current closing price and average prices for the specified period. The indicator signal is generated after the completion of the bar, where the indicator changes its position relative to zero. Never repaints signal. The indicator signals must be confirmed by the price exceeding the High/Low of the bar, where the indicator changed its position relative to zero. The indicator allows to send emails and messages to t

SFT Full MACD
FREE
Artem Kuzmin
A classic indicator with advanced features for more accurate display of the market situation. All settings of all moving averages are available, such as the moving average type and the priced used in its calculation. It is also possible to change the appearance of the indicator - line or histogram. Additional parameters provide the ability of fine tuning.
Distinctive features Does not redraw. Additional parameters for fine tuning. Displayed as a line or as a histogram. Works on all timeframes

MACD plus TDI
FREE
Devy Tanusukma
Moving Average Convergence Divergence (MACD) combined with Traders Dynamic Index (TDI) Input parameters: signal mode: true if you want to plug it into STAT (Signal Tester and Trader) arrow shift: distance between TDI line to arrow on chart middle band: use middle band (middle bolinger band) signal filter price line: use 50 price line signal filter RSI period RSI price method volatility period moving average RSI period moving average signal period moving average method use MACD indicator fast MAC

ZigZag SupportAndResistance
FREE
Nikolay Churbanov
The Zigzag Support And Resistance is an indicator for showing support and resistance zones based on the ZigZag extremums.
Indicator Settings
PrecalculateBars - the number of bars for the preview; SmoothPercent - smoothing of the levels as a percentage; LiveBars - lifetime of a level in bars; D1Depth - depth of the ZigZag indicator on the D1 chart; H4Depth - depth of the ZigZag indicator on the H4 chart; H1Depth - depth of the ZigZag indicator on the H1 chart; M15Depth - depth of the ZigZag

Magic Macd Cross
FREE
Christophe Godart
This classic "old school" MAGIC MACD indicator gives you the cross of the parameters you set. Standart setting is (12,26,9) . The arrows give you a possible change of trend. Be careful and do not use this indicator as a single signal source.
FREE version Please feel free to check out our other REX indicator series. We do have other free indicators.
"OLD BUT GOLD"

GBPUSD best levels
100 USD Zbynek Liska
The best levels for the most traded pair gbpusd Constant overview of where the market reacts, no redrawing. Bonus : Calculator for the recommended volume for all situations. Bonus : Calculate the swap field number of days. Bonus : the value of the annual Fibonacci. Bonus : Number of waves of the month and year. Bonus : Calculator of your own value and subsequent calculation of the price range

Traditional MACD MT4
FREE
Daniel Lewis
MACD indicator in MetaTrader 4/5 looks different than MACD does in most other charting software. That is because the MetaTrader 4/5 version of MACD displays the MACD line as a histogram when it is traditionally displayed as a line. Additionally, the MetaTrader 4/5 version computes the Signal line using an SMA, while according to MACD definition it is supposed to be an EMA. The MetaTrader 4/5 version also does not compute a true MACD Histogram (the difference between the MACD/Signal lines). This
Buyers of this product also purchase

Entry Points Pro
125 USD Yury Orlov
This is a trend indicator for MT4 providing accurate signals to enter a trade without redrawing or delays.
It can be applied to any financial assets: forex, cryptocurrencies, metals, stocks, indices . The best results are on the timeframe M15+
Our Telegram group | MT5 version of the indicator
IMPORTANT! Contact me after your purchase to get the detailed guide and bonus. Video (6:22) - one signal that made a profit equal to triple the price of the indicator. Video (4:4

VR Sync Charts
52 USD Vladimir Pastushak
VR Sync Charts is a program designed as an indicator for the MetaTrader trading terminal. The program solves the problem of synchronization of chart windows by drawing a trend line in one chart window. the program copies and synchronizes the line with another chart in the MetaTrader terminal. Syncing will occur regardless of which period is set in the other chart. In the picture below, you can see how the trader manages the trend line, and the program synchronizes the line in another chart. The

Advanced Supply Demand
148 USD Bernhard Schweigert
CURRENTLY 33% OFF !! Best Solution for any Newbie or Expert Trader! This indicator is a unique, high quality and affordable trading tool because we have incorporated a number of proprietary features and a new formula. With this update, you will be able to show double timeframe zones . You will not only be able to show a higher TF but to show both, the chart TF, PLUS the higher TF: SHOWING NESTED ZONES . All Supply Demand traders will love it. :) Important Information Revealed
Maximize th

Advanced Currency Strength28 Indicator
148 USD Bernhard Schweigert
CURRENTLY 26% OFF Best Solution for any Newbie or Expert Trader! This Indicator is a unique, high quality and affordable trading tool because we have incorporated a number of proprietary features and a new formula. With only ONE chart you can read Currency Strength for 28 Forex pairs! Imagine how your trading will improve because you are able to pinpoint the exact trigger point of a new trend or scalping opportunity? User manual: click here That's the first one, the original! Don't buy a worthle

PipFinite Breakout EDGE
98 USD Karlo Wilson Vendiola
The Missing Edge You Need To Catch Breakouts Like A Pro. Follow a step-by-step system that detects the most powerful breakouts!
Discover market patterns that generate massive rewards based on a proven and tested strategy.
Unlock Your Serious Edge
Get it here www.mql5.com/en/blogs/post/723208
Have access to the game changing indicator that will take your trading to the next level!
How To Trade
Execute your trades in 3 Easy Steps!
Step 1: Trade Setup Enter a signal if Success Rate is

PipFinite Trend PRO
98 USD Karlo Wilson Vendiola
Breakthrough Solution For Trend Trading And Filtering With All Important Features Built Inside One Tool! Trend Pro's smart algorithm detects the trend, filters out market noise and gives entry signals with exit levels. The new features with enhanced rules for statistical calculation improved the overall performance of this indicator.
Important Information Revealed Maximize the potential of Trend Pro, please visit www.mql5.com/en/blogs/post/713938 Test the demo version and explore its feature

FX Volume
75 USD Daniel Stein
You want to become a constantly profitable 5-star forex trader? 1. Read the basic description of our simple trading system & and it's major strategy update in 2020 2. Send a screenshot of your purchase to get your personal invitation to our exclusive trading chat
Following the smart money is finally possible! FX Volume is the FIRST and ONLY volume indicator that provides a REAL insight into the market sentiment from a broker's point of view. It provides awesome insights into how ins

Best Currency Strength Indicator
149 USD Tumelo Rakotsoane
Advanced Currency Strength Indicator
The Advanced Divergence Currency Strength Indicator. Not only it breaks down all 28 forex currency pairs and calculates the strength of individual currencies across all timeframes , but, You'll be analyzing the WHOLE forex market in 1 window (In just 1 minute) . This indicator is very powerful because it reveals the true movements of the market. It is highly recommended to analyze charts knowing the performance of individual currencies or the countries ec

Bermaui Deviation Percent
50 USD Muhammad Elbermawi
Or ( BD% ) which is a volatility index that measures volatility in percent rather than points. The idea of BD% is to make an index depending on the Classic Standard Deviation (CSD) that moves between 0 and 100 percent.
You can use BD% to compare volatility for the same security in different time periods or different time-frames. In addition, you can use BD% to compare volatility between different securities in different markets in terms of percent rather than points.
The idea behind th

TickUnit Scalper Currency Strength28 PRO
148 USD Bernhard Schweigert
CURRENTLY 26% OFF !! This indicator is a super combination of both our main indicators ( Advanced Currency Strength 28 and Advanced Currency IMPULSE with ALERT ). It shows Currency Strength values for TICK-UNITS and alert signals for 28 Forex pairs. 11 different Tick-Units can be used. Those are 1, 2, 3, 4, 5, 6, 10, 12, 15, 20, and 30 Seconds. The Tick-Unit bar in the sub-window will be shown and shifted to the left when there is at least 1 tick within the second’s timer. With only ONE

Infinity TrendLine PRO
99 USD Evgenii Aksenov
PROMO: Buy Trend Line PRO today and contact me to get for free:
1) User's Manual about the indicator and built in pop-up Scanner 2) Settings files for Bitcoin, GOLD, EURUSD, GBPUSD 3) HTF Histogram (basement indicator) which shows Higher TimeFrame trend in the bottom of chart Contact me after purchased to receive useful files: profitcamp@mail.ru
TrendLine PRO indicator is based on the analysis of the strength of bulls and bears. TrendLine PRO never repaint and does not change the

FX Power
75 USD Daniel Stein
️️️️️ You want to become a constantly profitable 5-star forex trader? ️️️️️ 1. Read the basic description of our simple trading system & and it's major strategy update in 2020 2. Send a screenshot of your purchase to get your personal invitation to our exclusive trading chat
FX Power is the first currency strength meter with a complete history across all time frames.
It analyzes the momentum and strength of all major currencies to determine high probability trades. Key Fe

Buy Sell zones x2
99 USD Andrii Malakhov
Индикатор "Buy Sell zones x2" основан на принципе "остановка/разворот после сильного движения". Поэтому, как только обнаруживается сильное безоткатное движение, сразу после остановки - рисуется зона покупок/продаж. Зоны отрабатывают красиво. Или цена ретестит зону и улетает в космос, или пробивает зону насквозь и зона отрабатывается с другой стороны так же красиво. Работает на всех таймфреймах.
Лучше всего выглядит и отрабатывает на Н1.
Может использоваться как: индикатор зон, где лучше

Bermaui Pin Bars
50 USD Muhammad Elbermawi
Bermaui Pin Bars
Or (BPB) is an indicator that find Pin Bars price action pattern on the chart. Pin Bars is a shortcut for "Pinocchio Bars" which is a classic bar pattern alternative to Japanese candlesticks with tall upper or lower shadows and very small bodies like Hammer, Inverted-Hammer, Hanging Man, Shooting Star, Dragon Fly Doji or Grave Stone Doji. Bermaui Pin Bars indicator find this pattern depending on a formula that can be explained in the next steps:
At first BPB calculate the

Square of 9 for all
99.99 USD Francesco Rubeo
Welcome all to the famous Gann's "Square Of 9"!! This method was used by one of the best traders in the history, a person who made his way among the top traders. An "Holy Grail" for whoever wants to learn trading. The "Square of 9" was used by this genius to find the market's future supports and future resistances. Nowadays is possible to find them with just a click, thanks to softwares. At the time Gann was using just his set of square and goniometer!! Gann describes, partially, the tecnique on

Trend Finder For Multi Pair And Multi Time Frame
79 USD ScorpionFX
(FOR MT4) Trend Finder Multi Pair And Multi Time Frame : This indicator has been designed to help find the strongest trends in the forex market, quickly and easily. It simultaneously analyzes the moving averages for all 28 pairs and across 8 time-frames. And then it ranks each pair according to trend-strength.
IMPORTANT FACTORS TO KEEP IN MIND: Institutional traders use moving averages more than any other indicator. And trading with the dominant trend is a CRITICAL part of your long term

TMA Currency Meter
59 USD Paul Geirnaerdt
TMA Currency Meter is the ultimate currency meter. Based on the Triangular Moving Average of all available symbols, this indicator shows which currencies are strong, strengthening, weak or weakening. Experienced as well as novice traders will see the strong and weak currencies in the blink of an eye, and know which trade possibilities to explore further. TMA Currency Meter is a true Multi Timeframe indicator. It is easy to show the currency strengths for a higher timeframe than the chart timefra

Heiken Ashi Scanner
50 USD Philip Pankaj
Heikin-Ashi charts , developed by Munehisa Homma in the 1700s. Munehisa Honma was a rice merchant from Sakata, Japan who traded in the Dojima Rice market in Osaka during the Tokugawa Shogunate. He is considered to be the father of the candlestick chart. Th e man who invented the use of candlestick charts for finding and profiting from chart patterns.He was a billionaire trader on those days if we compared his net-worth with todays dollar . Heikin Ashi Scanner is an Multi-Currency and Multi

Trading Chaos Map
125 USD Andrey Sinegovskiy
For those who studies Bill Williams' books "New Trading Dimensions" and "Trading Chaos (Second Edition)" and tries trading using these methods, it becomes evident that the standard set of indicators is not sufficient for full-fledged work. The Trading Chaos Map indicator draws the "market map", thus allowing you to the charts the same way as the author of the trilogy. Parameters provide options for enabling and disabling each signal. You can use any of the methods, or use them in conjunction. Yo

VR Small Chart
59 USD Vladimir Pastushak
The indicator displays a separate mini chart in a working window similar to МТ5 mini charts. You can expand/collapse the chart, change the chart symbol, period, as well as time and price scales. The app works in the strategy tester and you can switch the period of a mini chart.
Settings Select symbols - All Symbols: all symbols provided by a broker, Only market watch: only the symbols present in the Market Watch Prefix - two letters for distinguishing between a few indicator copies (if more th

Pip Hunter Trend
100 USD Yaroslav Varankin
This is a trend indicator with some filters. If you use this tool as it is written in the recommendation, then the accuracy of open transactions will be 70% or more. Trading recommendations 1 It is worth opening a deal while receiving a signal (The blue dot indicates that it is possible to open an order for Buy. The red dot indicates that it is possible to open an order for Sell) 2 Set Take Profit at 40 pips or 4 points 3 Stoploss is not installed in its place, we exit on the opposite signal if

Bermaui Channel
50 USD Muhammad Elbermawi
This is a price channel that shows five important price levels on the chart. Those levels are: The Highest High (HH) of the previous x bars. The Highest Low (HL) of the previous x bars. The Center Line . The Lowest High (LH) of the previous x bars. The Lowest Low (LL) of the previous x bars. Try Bermaui Channel Demo version: https://www.mql5.com/en/market/product/47663 How to use the buffers to build your own expert advisor: https://www.mql5.com/en/blogs/post/734560
How does Bermaui Chan

Best And Worst Dashboard
100 USD Chantal Sala
Best and worst Dashboard was born from the idea to have a panel that includes all the symbols in a chart. It is very importance to understand which symbols are both positive and negative. In the past, we realized the single indicator Best and Worst ( https://www.mql5.com/en/market/product/11784 ), now thanks to the upgrading of the Metatrader the dashboard displays all the instruments simultaneously. A great revolution. This Dashboard is able to calculate performance at any time frame and clicki

TIL Timeframe Overlay
97 USD Viktor Macariola
The TIL Timeframe Overlay indicator is the perfect tool for multiple timeframe analysis . It does the simple yet powerful task of overlaying a candlestick chart of a different timeframe over another allowing you to see the BIGGER picture and see the underlying TREND amid the noise and volatile price action. Please see the screenshots below for examples. Features: It works in ALL timeframe. It works in ANY instrument/symbol. Displays ENTIRE candlesticks (body and wick) of other timeframes includi

Advanced Currency IMPULSE with ALERT
78 USD Bernhard Schweigert
CURRENTLY 39% OFF !! Best Solution for any Newbie or Expert Trader! This indicator is a unique, high quality and affordable trading tool because we have incorporated a number of proprietary features and a secret formula. With only ONE chart it gives Alerts for all 28 currency pairs . Imagine how your trading will improve because you are able to pinpoint the exact trigger point of a new trend or scalping opportunity! Built on new underlying algorithms it makes it even easier to identify an

Bermaui Bands
50 USD Muhammad Elbermawi
Bermaui Bands (BB) is a technical analysis tool that helps filter between ranging and trending price movements. The idea behind this indicator can be explained in the next steps: Calculate Standard Deviation as an oscillator that moves between 0 and 100. I will name it Bermaui Deviation percent (BD %). If "BD %" is near zero then volatility is at its extreme. In addition, if "BD %" is near 100 then volatility is very low. High volatility means a great probability for a trending market, whi

True Direction Oscillator
60 USD Muhammad Elbermawi
Or (TDO) which is an index that measures the price rate of change using the principle of " Pure Momentum ".
When a security price advances from 10 to 15 then the price rate of change is 150% but when it declines back from 15 to 10 then price rate of change is 33.3% only. That is why technical analysis indicators like "Price Rate of Change" (ROC) or "Momentum" gives higher readings for ascending price movements than that given to descending ones. TDO fixes this problem to help traders at

Bruces Price Predictor Dashboard
50 USD Bruce Webb
This is a Dashboard Indicator based on Bruce's Price Predictor Indicator . This Dashboard will Give you a visual to see the trend direction without having to flip through timeframes, so you can always be trading in direction of the trend, with little effort. I Recommend www.CoinexxBroker.com as a great broker and the one I personally use
*Non-Repainting Dashboard Arrows *For Desktop MT4 Only *Great For Scalping *Great For Swing Trading *Dashboard Arrow Entry Alerts *Dashboard Arrow Signals

FX Trend
75 USD Daniel Stein
️️️️️ You want to become a constantly profitable 5-star forex trader? ️️️️️ 1. Read the basic description of our simple trading system & and it's major strategy update in 2020 2. Send a screenshot of your purchase to get your personal invitation to our exclusive trading chat
FX Trend displays the trend direction, duration, intensity and the resulting trend rating for all time frames in real time.
You'll see at a glance at which direction the trends are running, how long

TPA True Price Action MT4 Indicator
168 USD InvestSoft
TPA True Price Action indicator reveals the true price action of the market makers through 100% non-repainting signals (except early signals mode) strictly at the close of a candle!
TPA shows entries and re-entries, every time the bulls are definitely stronger than the bears and vice versa. Not to confuse with red/green candles. The shift of power gets confirmed at the earliest stage and is ONE exit strategy of several. The first part of the TPA manual "The Basics" is now available (free to g
More from author

PipTick Volume
37 USD Michal Jurnik
PipTick Volume indicator is a great tool for measuring tick volume activity. It quickly and easily helps traders to evaluate the current size of volume. The indicator for the classification of the volume size uses the moving average and its multiples. Accordingly, the area where the volume is located (relative to the moving average) is labeled as ultra low, low, average, high, very high or ultra high. This indicator can calculate moving average by four methods: SMA - Simple Moving Average SMMA -

PipTick Volume Delta MT4
67 USD Michal Jurnik
PipTick Volume Delta indicator shows the difference between Bid volume and Ask volume. Basically, it shows which side of the market participants (Buyers or Sellers) were more active in a certain period of time. Calculation of Bid volume and Ask volume is based on our PipTick Bid-Ask Volume indicator. As we all know, the Forex market is decentralized and therefore we do not have a reliable information about real volume. We also do not know actual and historical values of the Bid volume (Sellers v

PipTick Bid Ask Volume MT4
67 USD Michal Jurnik
PipTick Bid-Ask Volume indicator is a tool that needs every scalper and intraday trader. It uses a special algorithm to determine the activity of buyers and sellers and displays it in the form of histogram. With this feature, the trader can easily compare the level of aggression on the part of buyers and sellers and read the context of the market. As we all know, the forex market is decentralized and therefore we do not have a reliable information about real volume. We also do not know actual an

PipTick VSA MT4
97 USD Michal Jurnik
PipTick VSA is based on the original Volume Spread Analysis method. It was designed for quick and easy recognition of VSA patterns. Even though this indicator looks very simple, it is the most sophisticated tool that we have ever made. PipTick VSA indicator is a really powerful analytical tool that generates very reliable trading signals. Because it is very user friendly and understandable, it is suitable for every type of trader, regardless of their experience.
What Is VSA? VSA (Volume Spread

PipTick Pairs Cross MT4
37 USD Michal Jurnik
PipTick Pairs Cross is a unique tool for negatively correlated trading instruments, such as EURUSD and USDCHF currency pairs. It is based on a concept called pairs trading (or spread trading). Our indicator is comparing the strength of two currency pairs that are inversely correlated and easily tells you when it is time to buy a first pair and short a second pair, and vice versa. This is an extremely simple approach to trading currency pairs that works very well.
How to Use? There are only two

PipTick OHLC MT4
37 USD Michal Jurnik
PipTick OHLC indicator shows the current and historical values of High, Low, Open, Close and Mid for a specific time period. It can plot the current values or the values from the previous session. The range for calculation of the indicator can be taken from a daily, weekly, monthly, or user-specified session.
Levels High of current or previous session. Low of current or previous session. Open of current or previous session. Close of current or previous session. Midpoint of current or previous

PipTick Bid Ask Volume MT5
67 USD Michal Jurnik
PipTick Bid-Ask Volume indicator is a tool that needs every scalper and intraday trader. It uses a special algorithm to determine the activity of buyers and sellers and displays it in the form of histogram. With this feature, the trader can easily compare the level of aggression on the part of buyers and sellers and read the context of the market. As we all know, the forex market is decentralized and therefore we do not have a reliable information about real volume. We also do not know actual an

PipTick VWAP MT4
67 USD Michal Jurnik
PipTick VWAP is our version of Volume-Weighted Average Price indicator. VWAP is the ratio between the value traded (price multiplied by number of volume traded) and total volume traded over a specific time period. It measures the average price of the instrument much better than the simple moving average. Although there are many ways how to use the VWAP, most investors use it to calculate the daily average. The indicator works in five modes: Moving - In this mode the PipTick WVAP works as Moving

PipTick Currency Index MT4
67 USD Michal Jurnik
PipTick Currency Index is a really helpful tool that enables traders to display any index of eight major currencies. The indicator uses the unique calculation formula that reflects actual volume of forex market. Basically, it is a weighted average of currency pairs values which form the crosses of index currency. The default weights are based on the results of the BIS Triennial Central Bank Survey. Because of this advantage, the trader can see the true strength and weakness of each currency. Not

PipTick Supply Demand MT5
97 USD Michal Jurnik
PipTick Supply Demand is the best indicator we have ever made. This great tool automatically draws a supply and demand zones which are the best places for opening and closing the positions. It has many advanced features such as multi timeframe zones support, displaying width of zones, alert notifications for retouched zones and much more. Because of principle of market fractality, this indicator can be used for any kind of trading. It does not matter whether you are positional, swing or intraday

PipTick Heiken Ashi MT5
37 USD Michal Jurnik
PipTick Heiken Ashi is our version of Heiken Ashi chart indicator. Unlike competitor products, this indicator offers extensive options for calculating of Heiken Ashi candles. It can be displayed as classic or smoothed version. The indicator can calculate Heiken Ashi with moving average by four methods: SMA - Simple Moving Average SMMA - Smoothed Moving Average EMA - Exponential Moving Average LWMA - Linear Weighted Moving Average
Main features The indicator shows Heiken Ashi as classic or smoo

PipTick Supply Demand
97 USD Michal Jurnik
PipTick Supply Demand is the best indicator we have ever made. This great tool automatically draws a supply and demand zones which are the best places for opening and closing the positions. It has many advanced features such as multi timeframe zones support, displaying width of zones, alert notifications for retouched zones and much more. Because of principle of market fractality, this indicator can be used for any kind of trading. It does not matter whether you are positional, swing or intraday

PipTick Volume MT5
37 USD Michal Jurnik
The PipTick Volume indicator is a great tool for measuring tick volume or real volume activity. It quickly and easily helps traders to evaluate the current size of volume. The indicator for classification of the volume size uses moving average and its multiples. Accordingly, the area where the volume is located (relative to the moving average) is labeled as ultra low, low, average, high, very high or ultra high. This indicator can calculate moving average by four methods: SMA - Simple Moving Ave

PipTick VWATR MT5
FREE
Michal Jurnik
PipTick VWATR indicator is a helpful tool for measuring of activity of the market. It is based on the idea of the Volume-Weighted ATR. The combination of these two elements helps to identify potential turning points or breakout opportunities. The indicator for the classification of the activity of the market uses moving average and its multiples. Accordingly, where the VWATR bar is located (relative to the moving average), it is labeled as ultra low, low, average, high, very high or ultra high.

PipTick Session MT5
FREE
Michal Jurnik
PipTick Session is a very simple indicator that helps to highlight a specific trading session. For example, it can be used for differentiation of the European, American or Asian session.
Main features The indicator shows a user-defined trading session Alert notifications for start and end of session Custom session time Works on every timeframe (M1, M5, M15, M30, H1, H4, D1, W1, MN) Customizable parameters (Colors, Alert...) Can be used for creating EA Available for MT4 and MT5
Input paramete

PipTick VWATR MT4
FREE
Michal Jurnik
PipTick VWATR indicator is a helpful tool for measuring of activity of the market. It is based on the idea of the Volume-Weighted ATR. The combination of these two elements helps to identify potential turning points or breakout opportunities. The indicator for the classification of the activity of the market uses moving average and its multiples. Accordingly, where the VWATR bar is located (relative to the moving average), it is labeled as ultra low, low, average, high, very high or ultra high.

PipTick Session MT4
FREE
Michal Jurnik
PipTick Session is a very simple indicator that helps to highlight a specific trading session. For example, it can be used for differentiation of the European, American or Asian session.
Main features The indicator shows a user-defined trading session Alert notifications for start and end of session Custom session time Works on every timeframe (M1, M5, M15, M30, H1, H4, D1, W1 and MN) Customizable parameters (Colors, Alert...) Can be used for creating EA Available for MetaTrader 4 and MetaTrad

PipTick Equity MT5
FREE
Michal Jurnik
PipTick Equity is a simple indicator that shows the development of equity curve in real time. For precision measurement, it should be used in a separate window with a period of M1.
Main features The indicator shows the development of equity curve in real time High precision on minute chart Very fast calculation Available for MT4 and MT5

PipTick Close MT5
FREE
Michal Jurnik
PipTick Close is a simple script that allows traders to close theirs trades by three methods. Just run the script and choose the close method. Closing methods Symbol - Allows to close all open trades for certain symbol All_Trades - Allows to close all open trades Magic_Number - Allows to close all open trades according to their magic number Recommendation AutoTrading functions must be activated. If the AutoTrading function is disabled, script will not work. EA should be stopped. If you are using

PipTick Equity MT4
FREE
Michal Jurnik
PipTick Equity is a simple indicator that shows the development of equity curve in real time. For precision measurement, it should be used in a separate window with a period of M1.
Main features The indicator shows the development of equity curve in real time High precision on minute chart Very fast calculation Available for MT4 and MT5

PipTick Close MT4
FREE
Michal Jurnik
PipTick Close is a simple script that allows traders to close theirs trades by three methods. Just run the script and choose the close method. Closing methods Symbol - Allows to close all open trades for certain symbol All_Trades - Allows to close all open trades Magic_Number - Allows to close all open trades according to their magic number Recommendation AutoTrading functions must be activated. If the AutoTrading function is disabled, script will not work. EA should be stopped. If you are using

PipTick Currency Strength Indicator MT4
67 USD Michal Jurnik
Knowledge of the strength and weakness of each currency is vital for every forex trader. Our currency strength indicator measures strength of eight major currencies (USD, EUR, GBP, CHF, JPY, CAD, AUD, NZD) by using Relative Strength Index indicator, also known as RSI. PipTick Currency Strength Indicator show you in a simple and quick way, when a currency is oversold, overbought or in "normal area". In this way, you can simply identify, which currency is the strongest and which is the weakest. Th

PipTick ATR
37 USD Michal Jurnik
PipTick ATR indicator is a really helpful tool for measuring the range of bars. It quickly and easily helps to evaluate the current spread (range) of the ATR, which is especially useful for VSA traders. The indicator for the classification of the range of bars (candles) uses moving average and its multiples. Accordingly, the area where the volume is located (relative to the moving average) is labeled as ultra low, low, average, high, very high or ultra high. PipTick ATR indicator is rendered as

PipTick CSI PRO MT4
97 USD Michal Jurnik
This is a professional version of our PipTick Currency Strength Indicator. Knowledge of the strength and weakness of each currency is vital for every forex trader. Our currency strength indicator measures strength of eight major currencies (USD, EUR, GBP, CHF, JPY, CAD, AUD, NZD) by using several popular indicators. PipTick CSI PRO shows you in a simple and quick way whether the currency is strong or weak. Furthermore, you can also see when the currency is oversold, overbought or in "normal area

PipTick Currency Barometer MT4
67 USD Michal Jurnik
PipTick Currency Barometer is one of our most favorite indicators. It measures the strength of two currencies represented in the pair and compares the difference between them. The result is shown as a histogram where you can simply identify which currency is the strongest. This indicator is designed to measure the strengths and weaknesses of eight major currencies (USD, EUR, GBP, CHF, CAD, JPY, AUD and NZD) and works on 28 currency pairs. The PipTick Currency Barometer uses CCI method (Commodity

PipTick Correlation MT4
67 USD Michal Jurnik
PipTick Correlation shows the actual correlation between the selected instruments. The default setting is set to 28 currency pairs, gold and silver, but the indicator can compare any other symbols.
Interpretation of the indicator Positive correlation (corellation is above 80 %) Negative correlation (corellation is below -80 %) Weak or no correlation (corellation is between -80 and 80 %)
Main features The indicator shows actual correlation between the selected instruments Simple comparison of

PipTick Pairs Spread MT4
67 USD Michal Jurnik
PipTick Pairs Spread indicator has been developed for the very popular strategy known as pairs trading, spread trading or statistical arbitrage. This indicator measures the distance (spread) between prices of two directly (positively) correlated instruments and shows the result as a curve with standard deviations. So, any trader can easily identify when the instruments are too far apart and use this information for trade opportunity.
How to Use? The best results are obtained when the trade is

PipTick Bar Timer MT4
37 USD Michal Jurnik
PipTick Bar Timer indicator displays an advanced bar countdown timer on a chart. This study indicates the remaining time for the last bar on the chart.
Main features The indicator shows remaining time for the last bar in the chart Alert notifications for a new bar Works on every timeframe (M1, M5, M15, M30, H1, H4, D1, W1 and MN) Customizable parameters (Colors, Text size, Visibility...) Ideal tool for all kinds of trading (scalpers, intraday traders...) Very fast calculation Available for Met

PipTick Effort Index MT4
67 USD Michal Jurnik
PipTick Effort Index indicator is based on the work of Karthik Marar, volume spread analysis trader. It compares the change in price (Result) to the size of volume (Effort) for a certain period of time. By comparing the effort and result we can get more information about the future price movement. Both values are normalized and converted to scale of 0-100% based on a selectable look back period. The law of effort and result The law of effort vs. result states that the change in price of a tradin

PipTick Retracement MT4
37 USD Michal Jurnik
PipTick Retracement indicator shows the current and historical values of high, low and mid. Optionally, it can also display an major retracement levels. All these levels together form the significant levels of support and resistance. It is absolutely important to be aware of them for every kind of trader.
Levels High Low Midpoint 76.4 % 61.8 % 38.2 % 23.6 %
Main features The indicator shows the actual levels of High, Low, Mid and selected retracements Four optional retracement levels Alert n
Filter:

Bidhan A Patel
2020.09.22 01:44
#
a good indicator to use with combination with other indicators.....